N A N O E X P R E S S
Open Access
Reliable synthesis of self-running Ga droplets on
GaAs (001) in MBE using RHEED patterns
Beni Adi Trisna, Nitas Nakareseisoon, Win Eiwwongcharoen, Somsak Panyakeow and Songphol Kanjanachuchai
*Abstract
Self-running Ga droplets on GaAs (001) surfaces are repeatedly and reliably formed in a molecular beam epitaxial (MBE) chamber despite the lack of real-time imaging capability of a low-energy electron microscope (LEEM) which has so far dominated the syntheses and studies of the running droplets phenomenon. Key to repeatability is the observation and registration of an appropriate reference point upon which subsequent sublimation conditions are based. The reference point is established using reflection high-energy electron diffraction (RHEED), not the noncongruent temperature used in LEEM where temperature discrepancies up to 25°C against MBE is measured. Our approach removes instrumental barriers to the observation and control of this complex dynamical system and may extend the usefulness of many droplet-related processes.
Keywords:Droplets; Sublimation; Self-running droplets; RHEED; MBE; GaAs
Background
Droplets on semiconductor surfaces play important roles in various devices and processes. Droplets have been used to enhance the conversion efficiency of solar cells through surface plasmons [1]; they also serve as efficient anti-reflection coating [2]. In the fabrication of nanoholes and nanowires, droplets are used as a drilling tool and a virtual template, respectively [3-5]. Through droplet epi-taxy [6], droplets enable the fabrication of optoelectronic devices such as intersublevel infrared photodetector [7] and single-photon emitter [8]. The versatility of droplets can be increased further if droplet dynamics are better understood. Recently, a pioneering experiment involving Ga droplet dynamics on GaAs (001) was reported [9], stimulating further investigations in related systems [10-13]. These reports are conducted principally byin situ real-time observation under a low-energy electron micro-scope (LEEM), with limited availability, leading some to experiment using more readily available molecular beam epitaxial (MBE) chambers [14-16], albeit with limited yields since MBE is optimized for deposition, not for microscopy. It is now accepted that group III droplets nucleate and run on certain III-V surfaces undergoing
sublimation, but many aspects of the running or self-propelled droplets remain unanswered [17]. With easier access and deposition capability, MBE has the potential to advance droplet dynamics studies with the ultimate aim of droplet controls in micro- and nanofabrication. Producing running droplets using MBE however is not trivial as in-accurate thermocouple temperatures often lead to under-or overdecomposition.
In this article, we report a simple procedure that leads to a reliable formation of self-running Ga droplets on GaAs (001) usingin situ reflection high-energy electron diffraction (RHEED) patterns as the primary reference. Thermocouple temperatures serve only as rough indica-tors, secondary to the RHEED patterns. RHEED has been widely used for studying surface morphology dur-ing deposition [18-21]. But in this work, RHEED is used to predict the onset of the self-running droplets during decomposition. This method provides reproducible re-sults of running Ga droplets in MBE which is important for those studying droplet imaging [22,23], dynamics [24], and control [25].
Methods
All samples are scribed from epi-ready GaAs (001) wa-fers (AXT, Inc., Fremont, CA, USA). Each sample is attached to a molybloc and degassed at 450°C for 1 h. Afterward, the sample is loaded into Riber’s 32P MBE
* Correspondence:[email protected]
Semiconductor Device Research Laboratory, Department of Electrical Engineering, Faculty of Engineering, Chulalongkorn University, 254 Phyathai Road, Patumwan, Bangkok 10330, Thailand
growth chamber and radiatively heated. The system pressure is kept below 5.5 × 10⁻⁹ Torr throughout. The samples then undergo a two-stage heating process: oxide desorption and sublimation. The first stage ramps the temperature of the substrate from room temperature at a rate not exceeding 30°C/min. The manipulator rotates at around a few rpm. During ramping, the set point temperature is put on hold whenever the chamber pres-sure approaches 5 × 10⁻⁹Torr. After the pressure reduces below 10−9 Torr, set point ramping resumes. When the thermocouple temperature reaches 580°C, the ramp rate decreases to 10°C/min. Towards the end of the first stage, the oxide is removed and a streaky RHEED pattern ap-pears. The sample manipulator is then rotated so that the electron beam from the RHEED gun impinges the sample in the 1½ 10 direction. The second stage ramps the temperature even more which results in a spotty RHEED pattern. The second stage is carried out with-out rotation. The streaky (spotty) pattern is associated with flat (rough) surfaces. For every significant change in the RHEED pattern, the heating is stopped, the sam-ple is removed, and the surface morphology is studied by two microscopic techniques: optical microscopy (OM) with differential interference contrast (DIC) en-hancement (Nikon’s Eclipse ME600P, Tokyo, Japan), and atomic force microscopy (AFM) using silicon ni-tride tips in the tapping mode in air (Seiko’s SPA400, Seiko Instruments, Tokyo, Japan). The two microscopic techniques allow meaningful correlation between RHEED patterns and surface morphology.
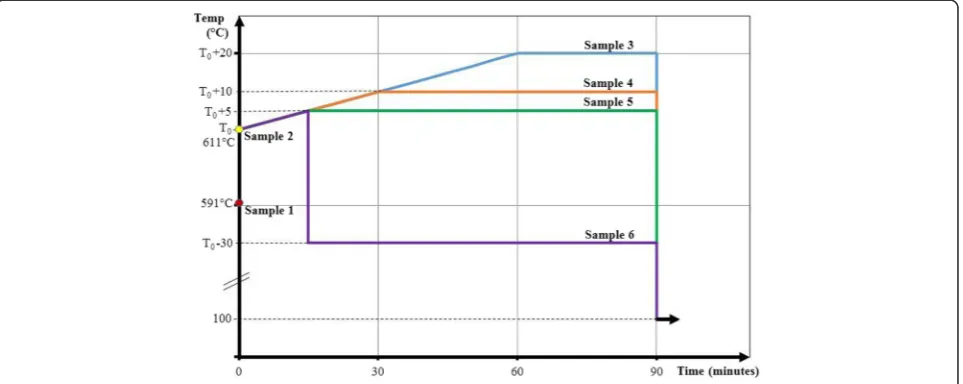
The RHEED pattern from oxide desorption to sublim-ation of III-V surfaces evolve similarly: it slowly changes from streaky to spotty and matures to chevron, then fades away. Six samples are subject to different temperature
profiles as shown in Figure 1. Controlled samples 1 and 2 show that the streaky and chevron patterns appear at thermocouple temperatures of 591°C and 611°C, respect-ively. Prolonged sublimation above the latter temperature results in the RHEED pattern disappearance, an expected result since theμm size droplets may scatter, absorb, or re-flect the electron beam from the RHEED gun. RHEED pattern’s decay and disappearance is a characteristic typic-ally associated with the growth of films with poor crystal-linity or turning amorphous [26]. Thus, strictly, there is no direct information from the RHEED pattern to distinguish between a static, amorphous surface and one teeming with dynamic, running droplets. However, we are able to show that running droplets can be reliably formed simply by registering the chevron condition and applying appropri-ate temperature offsets and durations using appropriappropri-ate profiles.
[image:2.595.59.541.525.717.2]The chevron condition designates the temperatureT0 where the chevron pattern appears. T0 serves as the reference temperature for the sublimation of samples 3 to 6 using the temperature profiles shown in Figure 1. Sample 3 is sublimated at T0+ 20°C for 30 min by ramping the temperature fromT0toT0+ 20°C at a rate of 0.3°C/min. This slow ramping rate allows droplet density control and prevents rapid decomposition [13]. Samples 4 and 5 are sublimated at T0+ 10°C and T0+ 5°C for 60 and 75 min, respectively, and ramped at the same rate as sample 3. Sample 6 is sublimated at T0− 30°C for 75 min: the temperatureTat first increases to T0+ 5°C to create a Ga-rich surface condition that stim-ulates Ga droplets nucleation, it then drops to T0−30°C and kept constant for 75 min. After quenching and sample removal, the surface morphology is studied by OM and AFM.
Results and discussion Reference condition
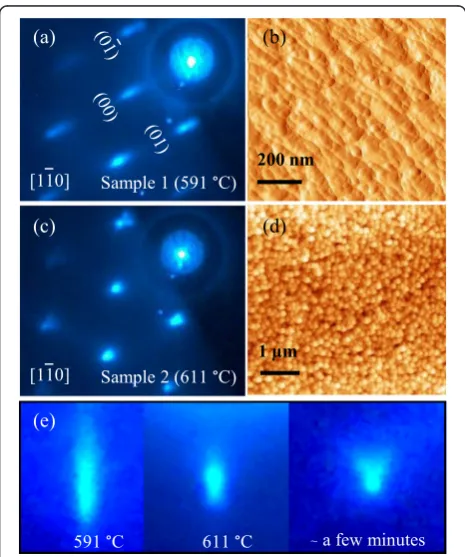
The reference condition is established with samples 1 and 2. Figure 2 shows the RHEED (left) and the corre-sponding AFM (right) images of the surfaces of samples 1 and 2. All sublimated samples undergo the condition of sample 1 with streaky pattern in Figure 2a and morphology in Figure 2b. These correspond to thermal desorption of native oxide which occurs at thermocouple temperature approximately 550°C to 590°C. As the temperature increases, all samples subsequently undergo the condition of sample 2, at T0, with spotty/chevron patterns in Figure 2c. These correspond to the early stages of noncongruent evaporation where excess Ga co-alesce to reduce surface tension. As soon as the spotty pattern appears, the temperature is held constant (T0). Soon after, the spotty pattern sharpens and develops into a chevron pattern as shown by the evolution of the
specular beam in Figure 2e; the latter is similar to those observed during epitaxial growth of quantum dots indi-cating the presence of facets [27]. The power supply to the substrate is turned off at this point and the sample is removed after the holder cools down to below 100°C. The surface is then probed by AFM, and the result in Figure 2d shows that the chevron pattern corresponds to nano-sized droplets with an average diameter and height of 20 and 30 nm, respectively.
[image:3.595.57.290.317.596.2]These nanoscale droplets form spontaneously and homogeneously throughout the surface, giving extremely high droplet density. This characteristic is general in het-eroepitaxy and does not require a nucleation layer [28]. A strong indication that the droplets seen in Figure 2d form spontaneously after oxide desorbed surface seen in Figure 2b is the root mean square (rms) roughness which increases from 5.7 nm in Figure 2b to 9.0 nm in Figure 2d. The nanoscale droplets later evolve into mi-croscale droplets. For III-V (001) substrates, in situ LEEM experiments have confirmed homogeneous and spontaneous formation of micro- and nanoscale Ga and In droplets [12,13].
Varying sublimation conditions
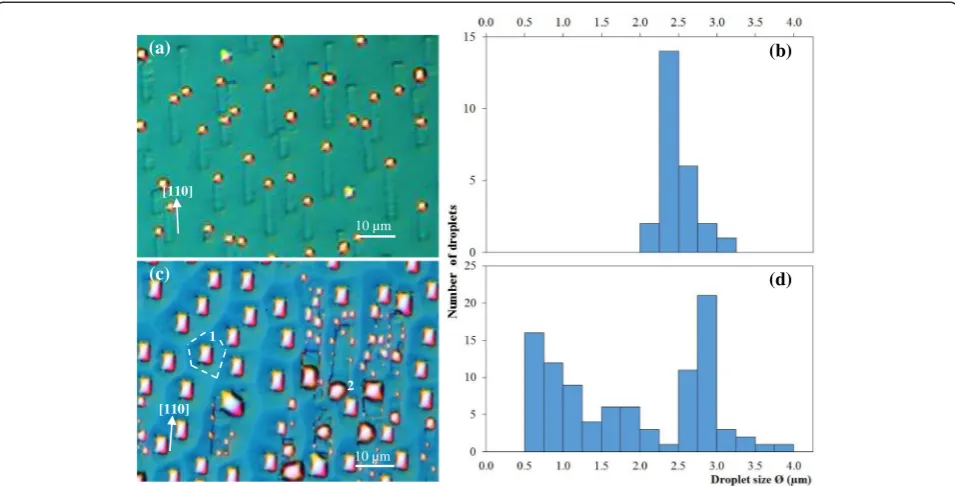
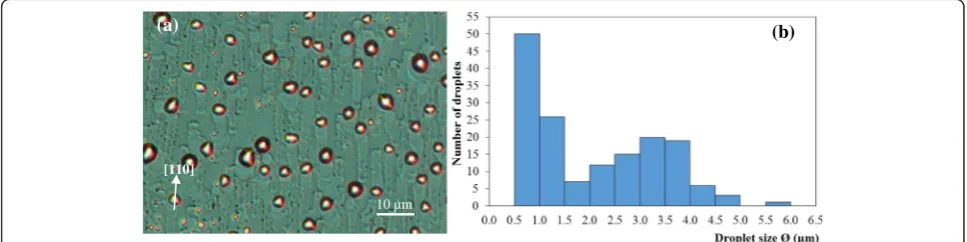
Subsequent sublimation experiments exceedT0and kept aboveT0throughout for samples 3 to 5 or kept aboveT0 only momentarily for sample 6. Sample 3 is subject to the highest sublimation temperature (T0+ 20°C) and the sublimated surface is highly nonuniform. Figure 3a shows the DIC image of an area with small droplets with corresponding size histogram in Figure 3b. In contrast, Figure 3c shows the DIC image of another area with large droplets with corresponding histogram in Figure 3d. These illustrate surfaces at different stages of decompos-ition, most likely caused by temperature nonuniformity. The running droplet mechanism is highly sensitive to temperature and the rate of change of temperature: a slight variation in temperature, compounded by long sublimation time, could result in very different surface morphologies. The high degree of sensitivity is the main factor responsible for the small number of self-running droplet studies using MBE systems as they lack real-time, real-space imaging capability. Though temperature nonuniformity can generally be minimized using appro-priate heater element and uniform backside radiation, the samples here are attached to the molybloc using in-dium (In) and thus a risk of nonuniformity is always present. Sample 3 is poorly prepared as unevenness of backside contact is clearly visible upon dismounting the sample from the bloc. The cloudy front areas - full of large, light-scattering droplets - are aligned with In-corrugated backside. Good thermal contact is achieved in these areas and hence they are referred to hereafter as the ‘hot’ zones. In contrast, the shiny front areas -Figure 2Correlation between RHEED patterns and surface
populated by small droplets - are aligned with almost In-free backside. Poor thermal contact is achieved in these areas and hence they are referred to as the‘cold’ zones. The droplets in the cold and hot zones differ both qualitatively and quantitatively.
The cold zones as exemplified by Figure 3a consist mainly of small, single-sized droplets. The Ga droplets have been running before quenching as the trails along the [110] direction consistent with earlier reports [9,12] are clearly visible. The histogram in Figure 3b shows that the droplet size is nominally 2.4μm and falls within the 2 to 3.5 μm range. This supports the critical running size of 1.9 μm previously determined by Wu et al. [14]. These first-generation droplets are typically referred to as primary or mother droplets [16].
The hot zones as exemplified by Figure 3c are popu-lated by large and small droplets. The droplet size distri-bution in this area as summarized in the histogram in Figure 3d shows that the droplets are bimodal: the large, primary droplets are nominally 2.9 μm and range from 2.4 to 4 μm in diameter, whereas the small, secondary droplets are as small as 0.5μm. The surface is character-istic of late-stage coalescence [29] and represent the ma-jority of reported sublimated III-V surface studies [30,31] before the realization of the self-running Ga droplets [9]. The running trails are either not formed or obliterated as a result of droplet coalescence. The ab-sence of the running trails is associated with samples which have been sublimated at too high a temperature
too quickly [13] where high-density droplets compete for material, delaying all to reach the critical running size. The droplets thus grow by coalescence. Once reaching the critical size, a droplet may be immobile or mobile depending on the surrounding. The droplet marked 1 in Figure 3c is immobile. The boundaries (shown as dashed lines) surrounding the droplet fix the droplet in place, blocking it from lateral motion. These boundaries do not exist in the cold zones as the droplets have plenty of space to move around. The droplet marked 2, on the other hand, is mobile due to the ab-sence of nearby boundaries.
The shapes of these two groups of droplets are differ-ent: the immobile droplets are rectangular while the mobile droplets are curved, almost circular for some droplets. The rectangular shape is the original shape of the droplets due to the {111} bounding planes inter-secting the (001) surface along the [110] and 1½ 10 di-rections, i.e., at right angles [12]. The rectangular droplets become more circular as they slip and hence less confined by the {111} planes. After slipping, the droplets gain more mass, etch the surface, and are again bound by the slow-etching {111} planes. The droplets’stick-slip motion causes shape cycling as reported by Shorlin et al. [30]. The presence of the hot and cold zones on a 1″ area of a highly conductive solid sample shows that the running droplet phenomenon is highly temperature sensitive and explains why the phenomenon was not first detected in MBE. Due to this temperature
[110] 1
2 (c)
(b)
(d) 10 µm
[110] (a)
[image:4.595.59.537.89.332.2]10 µm
sensitivity, subsequent samples were carefully mounted to ensure even distribution of In glue.
Samples 4 and 5 are sublimated at lower temperatures but at longer durations than sample 3. Due to even dis-tribution of backside In glue, post-sublimated surfaces of samples 4 and 5 are highly uniform. The DIC images and size histograms of sample 4 in Figure 4 and sample 5 in Figure 5 are thus representative of the whole sam-ples and show that for both surfaces, small droplets exist in greater proportion than large droplets. The running trails are clearly evident in both cases. The DIC image of sample 4 shows that large droplets with diameter as wide as 4.5 μm exist on the surface whereas the largest droplets of sample 5 is approximately 7.5 μm. Since sample 5 is sublimated at a slightly lower temperature (5°C) but for longer (15 min) than sample 4 and that 5°C is within experimental accuracy (the uncertainty in visu-ally registering T0 from sample to sample), the larger droplets in sample 5 are attributed to the longer sublim-ation period. The histograms further show that inter-mediate size droplets (2 to 4 μm) from sample 4 are significantly reduced in sample 5. These indicate that at 5°C to 10°C aboveT0, large Ga droplets grow at the ex-pense of smaller droplets, a characteristic of Ostwald ripening.
The very large and very small droplets pose limits to applications in micro- and nanotechnologies, respect-ively, and it is thus important to know how they ori-ginate or evolve. Judging from the running trails, the largest droplets can occur as a result of the coales-cence of two or more droplets running in opposite di-rections. Immediately after coalescence, the liquid droplets will try to distribute material so as to achieve the lowest surface energy but material mobility is lim-ited by etched walls and thus the hemispherical shape of the droplets is unlikely for these large droplets. The small droplets, on the other hand, emerge from the walls of the etched trails; their presence as secondary droplets has been previously identified and studied in detail [16].
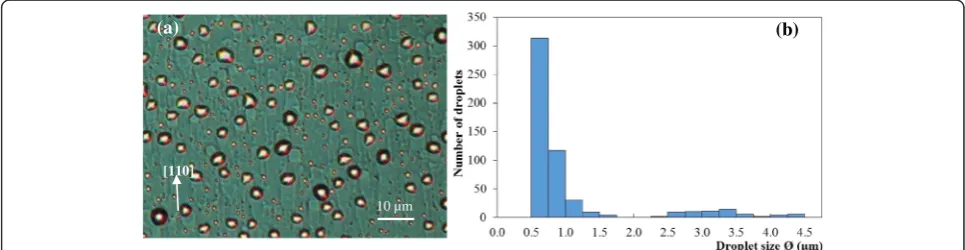
Sample 6 is sublimated at the lowest temperature (T0−30°C) but for the longest time (75 min). The DIC image in Figure 6a shows that the average size of drop-lets is the smallest among all the sublimated samples, excluding those on the cold zones of sample 3. In addition, the histogram in Figure 6b indicates that sample 6 has very small number of small droplets (<1.5μm). The absence of very small droplets possibly results from droplets shrinking while dwelling at a temperature lower than the congruent temperatureTC [9]. These results are consistent with expectations from thermal activated processes and are a strong indi-cation that T0−30°C is less than TC. From the trail length, the average droplet velocity can also be esti-mated at 10 to 15μm per hour.
Surface and RHEED evolutions
Based on the size distributions and varying temperature profiles of the six samples, the relationship between the RHEED patterns and the evolution of the self-running Ga droplets on GaAs (001) can be established as fol-lows. Starting from ramping up the temperature of the epi-ready GaAs (001), the first RHEED pattern ob-served is a broad, streaky pattern corresponding to cor-rugated surface as a result of thermal desorption of native oxides which occurs at Tdeox of approximately 580°C. If the temperature ramping continues, the RHEED pattern changes from the broad, streaky ap-pearance to one of spotty and chevron-like at T0, simi-lar to those observed during growth - e.g., of InAs on GaAs. At this stage, the surface is roughened and be-comes nonstoichiometric. This surface is associated with a Ga-rich, or equivalently an As-deficit, condition and denotes the first detectable sign of noncongruent evaporation in MBE. The temperature where the chevron pattern appears, or the chevron temperatureT0, is not the same as the literature value of the noncongruent temperatureTCwhich in the case of GaAs (001) is 625°C [9]. TC is the start of the noncongruent evaporation whereasT0 represents the condition at which nanoscale
(b)
(a)
[110]
[image:5.595.56.539.578.703.2]10 µm
Ga droplets have already been formed. It is thus natural to assume thatT0ishigherthanTC. Our results, however, in-dicate that T0 is merely 20°C aboveTdeox. Since Tdeoxis approximately 580°C, T0 is thus approximately 600°C, which is evenlower than the literature value ofTC by as much as 25°C. For the self-running Ga droplets on GaAs (001), a temperature miscalculation of such magnitude often the case without accurate temperature reference -would mean either overly sublimated or no sublimation conditions.
Sublimation above T0 results in the RHEED pattern quickly disappearing. The RHEED pattern as a guide to sublimation studies in MBE ceases to be useful at this point. Beyond this, systematic variations in sublimation time and temperature (with respect to T0) can instead be used to meaningfully produce and thus interpret the dynamics of group III droplets in MBE.
In MBE, it is very difficult to produce self-running droplets without RHEED. Prior to the six samples re-ported above, we failed to produce any self-running droplets in MBE despite having reliable temperatures from previously reported values ofTC which are mostly derived from LEEM experiments or taken from the litera-ture value [9]. We achieved either very low- or very high-density droplets as a result of under- or oversublimation. No running trails are observed for both conditions. It is
only after the proper reference temperature (T0) is estab-lishedin situ(RHEED patterns) that self-running droplets are produced repeatedly. Many past experiments that sublimated III-V surfaces in vacuum failed to produce self-running III droplets mainly because the temperature or the pressure is too high; the former results in coalesced droplets [29] whereas the latter results in droplets etching instead of running [32].
Conclusions
A simple procedure based on RHEED patterns is in-troduced and shown to be able to reliably produce self-running Ga droplets on GaAs (001) undergoing sub-limation in an MBE chamber. Instead of relying on re-ported temperatures from other systems, the procedure registers the reference temperatureT0 and systematically vary the sublimation time and temperature aroundT0to achieve the running droplets on all samples tested. While III-rich surface conditions have been known to the MBE community for decades, the self-running III-droplets have only recently been discovered using in situ microscopy [9]. The temperature sensitivity of the running droplet mechanism results in very few instances of this type of studies conducted in MBE [16]. Now with our proposed procedure, the running droplet mechanism can be easily accessed and probed, paving the way for improved
(b)
(a)
[110]
[image:6.595.59.539.89.213.2]10 µm
Figure 5Sample 5 after 75-min sublimation atT0+ 5°C.(a)The DIC image and(b)the corresponding size histogram of the droplets on the post-sublimated surface.
(a) (b)
[110]
10 µm
[image:6.595.56.540.582.703.2]fundamental understanding of this rarely reported mech-anism and of dynamics at liquid-solid interfaces in general.
Abbreviations
AFM:atomic force microscopy; DIC: differential interference contrast; LEEM: low-energy electron microscope; MBE: molecular beam epitaxy; OM: optical microscopy; RHEED: reflection high-energy electron diffraction.
Competing interests
The authors declare that they have no competing interests.
Authors’contributions
BAT, NN, and WE performed the MBE experiments. SP provided technical and managerial supports. SK conceived, designed, and supervised the experiments. BAT and SK analyzed the data and wrote the manuscript. All authors read and approved the final manuscript.
Acknowledgements
This work is supported by Thailand’s National Research University Project, Office of the Higher Education Commission (WCU-036-EN-57). We acknowledge discussion and insights gained while working with our colleagues at the beamline 3.2b of the Thai’s Synchrotron Light Research Institute.
Received: 29 January 2015 Accepted: 7 April 2015
References
1. Pillai S, Catchpole K, Trupke T, Green M. Surface plasmon enhanced silicon solar cells. J Appl Phys. 2007;101(9):093105.
2. Lee E, Song J, Yoon J, Bae M, Han I, Choi W, et al. Formation of self-assembled large droplet-epitaxial GaAs islands for the application to reduced reflection. J Appl Phys. 2013;113(15):154308.
3. Heyn C, Stemmann A, Koppen T, Strelow C, Kipp T, Grave M, et al. Optical properties of GaAs quantum dots fabricated by filling of self-assembled nanoholes. Nanoscale Res Lett. 2009;5(3):576–80.
4. Law M, Goldberger J, Yang P. Semiconductor nanowires and nanotubes. Annu Rev Mater Res. 2004;34:83–122.
5. Wang ZM, Liang B, Sablon K, Salamo G. Nanoholes fabricated by self-assembled gallium nanodrill on GaAs (100). Appl Phys Lett. 2007;90(11):113120. 6. Wu J, Wang ZM. Droplet epitaxy for advanced optoelectronic materials and
devices. J Phys D Appl Phys. 2014;47(17):173001.
7. Wu J, Shao D, Dorogan VG, Li AZ, Li S, DeCuir Jr EA, et al. Intersublevel infrared photodetector with strain-free GaAs quantum dot pairs grown by high-temperature droplet epitaxy. Nano Lett. 2010;10(4):1512–6.
8. Cavigli L, Abbarchi M, Bietti S, Somaschini C, Sanguinetti S, Koguchi N, et al. Individual GaAs quantum emitters grown on Ge substrates. Appl Phys Lett. 2011;98(10):103104.
9. Tersoff J, Jesson DE, Tang WX. Running droplets of gallium from evaporation of gallium arsenide. Science. 2009;324(5924):236–8. 10. Curiotto S, Leroy F, Cheynis F, Müller P. Self-propelled motion of Au-Si
droplets on Si (111) mediated by monoatomic step dissolution. Surf Sci. 2015;632:1–8.
11. Hilner E, Zakharov AA, Schulte K, Kratzer P, Andersen JN, Lundgren E, et al. Ordering of the nanoscale step morphology as a mechanism for droplet self-propulsion. Nano Lett. 2009;9(7):2710–4.
12. Kanjanachuchai S, Euaruksakul C. Self-running Ga droplets on GaAs (111)A and (111)B surfaces. ACS Appl Mater Inter. 2013;5(16):7709–13.
13. Kanjanachuchai S, Euaruksakul C. Directions and breakup of self-running in droplets on low-index InP surfaces. Cryst Growth Des. 2014;14(2):830–4. 14. Wu J, Wang ZM, Li AZ, Benamara M, Lee J, Koukourinkova SD, et al. Critical
size of self-propelled motion of droplets on GaAs (100) surface. J Appl Phys. 2012;112(4):043523.
15. Wu J, Wang ZM, Li AZ, Benamara M, Li S, Salamo GJ. Nanoscale footprints of self-running gallium droplets on GaAs surface. PLoS One. 2011;6(6), e20765.
16. Wu J, Wang ZM, Li AZ, Benamara M, Salamo GJ. On the secondary droplets of self-running gallium droplets on GaAs surface. ACS Appl Mater Inter. 2011;3(6):1817–20.
17. Kanjanachuchai S, Photongkam P. Dislocation-guided self-running droplets. Cryst Growth Des. 2015;15(1):14–9.
18. Chen X, Gao W, Sivaramakrishnan S, Hu H, Zuo J. In situ RHEED study of epitaxial gold nanocrystals on TiO2 (110) surfaces. Appl Surf Sci. 2013;270:661–6.
19. Hopkins J, Leys M, Brübach J, Van der Vleuten W, Wolter J. A RHEED study of the dynamics of GaAs and AlGaAs growth on a (001) surface by MBE. Appl Surf Sci. 1995;84(3):299–307.
20. Ino S. Some new techniques in reflection high energy electron diffraction (RHEED) application to surface structure studies. Jpn J Appl Phys. 1977;16(6):891.
21. Mašek K, Beran J, Matolín V. RHEED study of the growth of cerium oxide on Cu (111). Appl Surf Sci. 2012;259:34–8.
22. Kennedy S, Zheng C, Tang W-X, Paganin D, Jesson D. Caustic imaging of gallium droplets using mirror electron microscopy. Ultramicroscopy. 2011;111(5):356–63.
23. Tang W-X, Jesson DE, Pavlov KM, Morgan M, Usher B. Ga droplet morphology on GaAs (001) studied by Lloyd’s mirror photoemission electron microscopy. J Phys Condens Matter. 2009;21(31):314022.
24. Wu C, Xu X, Qian T. Molecular dynamics simulations for the motion of evaporative droplets driven by thermal gradients along nanochannels. J Phys Condens Matter. 2013;25(19):195103.
25. Tersoff J, Jesson DE, Tang WX. Decomposition controlled by surface morphology during langmuir evaporation of GaAs. Phys Rev Lett. 2010;105 (3):035702.
26. Shen J, Gai Z, Kirschner J. Growth and magnetism of metallic thin films and multilayers by pulsed-laser deposition. Surf Sci Rep. 2004;52(5):163–218. 27. Nabetani Y, Ishikawa T, Noda S, Sasaki A. Initial growth stage and optical
properties of a three‐dimensional InAs structure on GaAs. J Appl Phys. 1994;76(1):347–51.
28. Sutter P, Lagally M. Nucleationless three-dimensional island formation in low-misfit heteroepitaxy. Phys Rev Lett. 2000;84(20):4637.
29. Zinke-Allmang M, Feldman L, Van Saarloos W. Experimental study of self-similarity in the coalescence growth regime. Phys Rev Lett. 1992;68 (15):2358.
30. Shorlin K, Zinke-Allmang M. Shape cycle of Ga clusters on GaAs during coalescence growth. Surf Sci. 2007;601(12):2438–44.
31. Riesz F, Dobos L, Karanyi J. Thermal decomposition of bulk and heteroepitaxial (100) InP surfaces: a combined in situ scanning electron microscopy and mass spectrometric study. J Vac Sci Technol B. 1998;16(5):2672–4.
32. Li S, Wu J, Wang Z, Li Z, Su Y, Wu Z, et al. Thermal etching process of microscale pits on the GaAs(001) surface. Phys Status Solidi (RRL). 2012;6(1):25–7.
Submit your manuscript to a
journal and benefi t from:
7 Convenient online submission 7 Rigorous peer review
7 Immediate publication on acceptance 7 Open access: articles freely available online 7 High visibility within the fi eld
7 Retaining the copyright to your article