Munich Personal RePEc Archive
When is social protection
productivity-enhancing? Costs and
benefits on economic performances
Tomassi, Federico
Dipartimento per lo sviluppo e la coesione economica - UVAL
21 May 2010
Online at
https://mpra.ub.uni-muenchen.de/44381/
When is social protection productivity-enhancing?
Costs and benefits on economic performances
Federico Tomassi
*Abstract
This work aims to contribute to the contingency view of the relationships between
social protection and economic performances, by exploring under what conditions
social expenditure is productivity-enhancing or not. Well-designed welfare states and fit
socio-economic contexts can yield direct and positive relationships between equality
and efficiency. Social expenditure plays a twofold role: short-term financial cost notably
in traditional economic sectors, and long-term social investment especially in innovative
sectors. Some structural variables matters: distance from the world technological
frontier, share of productive expenditure, effectiveness of social expenditure, degree of
economic and financial globalisation, discount rate of expected future benefits.
Keywords: productivity, social expenditure, welfare state.
JEL classification: E62, H55, I31.
* Italian Ministry of economic development – Department of economic development and cohesion
1. Introduction: equality and efficiency
There is a wide literature about the effects of social protection and the welfare state
on economic performances, but theoretical works show different outcomes according to
different hypotheses about the role of welfare systems. These relationships are crucial in
understanding whether individual and social welfare can be protected from the
increasing risks we meet in the global economy, marked by ITC revolution and
consequent changes in jobs and skills, growing interdependence of productive and
financial markets, emergence of new competitors.
Because of the trade-off between equality and efficiency, one could expect social
protection – and notably its public pillar – to be an even heavier cost for the even
increasingly global economy. Large welfare states and social equality are at odds with
economic performances, and the latter decreases when the former increase. Freed from
fiscal costs and public regulation, markets could better reduce disincentives, favour
economic growth and satisfy social needs: economic growth trickles down wealth,
guaranteeing social justice. Social protection is a black hole, a leaky bucket where
resources accumulated during economic growth are wasted, so that searching for
equitable ‘slices’ reduces the dimension of the ‘cake’ (Okun, 1975).
There are macro- and micro-economic issues against social expenditure. The former
are (i) financial inconsistency related to public debt and expectations of international
investors, and (ii) the burden on the prices of goods and services when globalisation
imposes greater international competition and social dumping. Micro-economic
problems are (iii) reduction of individual responsibility by limiting freedom of
objectives and enjoyment of one’s own effort, and (iv) non-market failures caused by
However, the economic mainstream relies upon hypotheses which do not represent
long-term economic and social relationships, but only short-term financial sustainability
of social spending. Some scholars consider social protection merely as an income
redistribution from productive to unproductive classes, e.g. from working to retired
people (Alesina and Perotti, 1997) or from successful to unsuccessful individuals
(Hassler et al., 2003). From an analytical point of view, such models assume that
advanced economic systems are situated on the frontier of the transformation curve and
therefore every public intervention represents a zero-sum game displacing resources
between sectors or individuals1.
Recent theories stress more complex relationships between economic and social
issues. First, trickle-down is not so obvious, as is demonstrated by growing inequalities
in the advanced countries in the last 30 years although they have seen economic growth.
Second, some conditions for perfect competition to hold are not met in our real world –
due to heterogeneity of individuals, aversion to risky activities, second best outcomes,
uncertainty and information asymmetries – jeopardizing the feasibility to protect people
from increasing risks (Barr, 2001: ch. 2). Third, social protection represents not only
consumption or redistribution among individuals (‘Robin Hood’), but also insurance not
efficiently provided by private markets and redistribution over the life cycle (‘Piggy
Bank’) (Barr, 2001: ch. 1). Fourth, according to the concepts of capabilities and
functionings, social protection provides individuals with wider liberty of choice and
more opportunities of participation in economics, politics and social life (Sen, 1992;
1999).
1 There are shortages of physical and social resources, contrary to the Keynesian approach which
Economic growth could even have no positive effects on individual and social
well-being, to the extent that: (i) well-being depends on relative incomes rather than absolute
incomes, provided that basic needs are fully satisfied, and (ii) the scale of the economic
system becomes too big to ensure that social costs are lower than social benefits,
harming the feasibility of a sustainable development (Daly, 1996).
Empirically, the equality-efficiency trade-off does not hold, since many econometric
analyses do not show any conclusive or significant evidence that social expenditure or
taxation levels are correlated with economic performances: outcomes are uncertain,
often not significant or unrealistic (Atkinson, 1999: ch. 2, Lindert, 2004b: 82-99). Via
well-designed social protection systems, there can be direct and positive relationships
between equality and efficiency (Lindert, 2004a: 235-263). Social protection can even
be considered as a long-term ‘social investment’ in exchange for taxes (Esping
Andersen, 2002: 9-10), or as a ‘productive factor’ contributing to political stability and
economic dynamics (Fouarge, 2003: 35).
To overcome the inconclusiveness of empirical analyses focused only on spending
levels, some scholars suggest that the structure of social protection matters, i.e. its
institutional details (Atkinson, 1999: chs. 1-2) and its recasting according to external
pressures (Ferrera and Rhodes, 2000; Pierson, 2001: 419-427). The relationship
between social expenditure and economic performances could be contingent on national
socio-economic and institutional contexts: history, economic policy choices, laws,
finance system, labour market, corporate governance, productive specialization (Crouch
and Streeck, 1997; Barr, 2001: 268-270; Rodrik et al., 2004). As Gough (1996) points
out: ‘Different welfare regimes exhibit different configurations of effects on
another’.
In order to contribute to the contingency view, this paper aims to explore under what
conditions high social spending undermines economic productivity and when,
conversely, large and well-designed welfare systems are consistent with it. A
coexistence of positive and negative effects of social expenditure is assumed in a
dualistic economic system composed by an advanced innovative sector, in which
welfare systems imply benefits larger than costs, and a traditional imitative sector, in
which just the opposite holds. Such a formalization helps to stress some country- and
time-specific conditions under which social and economic benefits are higher than
financial costs.
This paper could contribute to redirect the current debate on equality and efficiency,
which lacks satisfactory explanations of outstanding stylized facts: the possibility for
both residual and social-democratic welfare states to be strong innovators, and the great
difference in taxation and social expenditure levels between the advanced countries,
with no empirical evidence of convergence.
The paper is organised as follows. The second section reviews some channels by
which welfare system elements are positively linked to social and economic
performances. The third section sketches the analytical formalization of a dualistic
economic system, where social spending yields both positive and negative effects on
productivity, depending on some structural variables. In the fourth section such a
framework is applied to the contingent circumstances of the U.S. and Europe. A short
2. Economic, social and welfare systems
There are complex relationships between welfare state elements, social issues and
economic performances. Social protection can improve economic indicators both
directly and indirectly. Two lines of research suggest a direct relationship. The ‘costs of
non social policy’ approach stresses that social protection provides immediate and
dynamic savings (Begg et al., 2003; Fouarge, 2003). The ‘varieties of capitalism’
approach highlights that different economic systems are fit to specific welfare system
structures and workers’ skills, taking advantage of their own institutional advantages
and corporate strategies (Hall and Soskice, 2001; Pierson, 2001).
Welfare systems are also indirectly linked to economic systems, via the increasing
opportunities that individuals achieve through social protection (Gough, 1996; Goodin
et al., 1999; Fouarge, 2003; van der Ploeg, 2004). This is related to: (i) stability facing
economic shocks and fluctuations, in order to accept technological and organizational
changes (Esping Andersen, 1999: ch. 3) and growing international openness (Rodrik,
1998); (ii) reduction of risks for asset-poor entrepreneurs, in order to favour profitable
but insecure activities and behaviours (Sinn, 1996; Bowles and Gintis, 2000); (iii)
promotion of equal opportunities, notably conciliation between motherhood and female
employment (Esping Andersen, 2003); (iv) increase in quantity (education since
childhood and lifelong learning) and quality (healthcare) of human capital.
The role of social protection as a productive factor becomes even stronger in our
global economy, which amplifies interdependences and risks. Social protection could
support structural competitiveness – defined as the long-term ability to provide high and
productivity2 (Gough, 1996) – to the extent that advanced countries rely their economic
performances upon high-quality and high-technology production rather than upon low
export prices. As a matter of fact, large social expenditure is not harmful for innovation
capabilities and productivity growth: e.g. Scandinavian countries and the Netherlands
succeed in conjugating their egalitarian social objectives with economic performances
(Goodin et al., 1999: 259-264; Castells and Himanen, 2002).
In this work, welfare systems are defined as composed of public social expenditure,
private market expenditure (both corporate and out-of-pocket) and family self-servicing
(Esping Andersen, 1999: §9.1, 2003: §4). As a matter of fact, both public and total
social expenditure are key issues: although public debt and economic distortions depend
on public pillar and taxation level, ‘Diminishing public health, pension, or social care
expenditure is unlikely to produce any real cost savings since households will
compensate with market purchase or with self-servicing. If welfare is externalized to
markets, this will not result in appreciably lower net household money outlays’ (Esping
Andersen, 2002: 25). The lack of a suitable public protection could even generate a
more costly and less effective private social spending (Atkinson, 1999: chs. 4-7;
Hacker, 2006).
This view3 needs a new system of social accounting (Adema and Ladaique, 2005),
focusing on total net social expenditure ( net tot
S ) as the sum of public net social
expenditure ( net pub
S ) and private expenditure for education, healthcare and retirement
2 On the contrary, performing competitiveness is defined as the ability to export in contested
markets, but that could derive by negative social changes – lower wages, devalued exchange rates, or delocalization of plants – so that this meaning is relevant only at the sector level.
3 Castles and Obinger (2007: 220) do not agree that net total measures provide a more
funds (Spriv). In turn, public net social expenditure is equal to its gross value, i.e. social
protection level such as usually defined ( gross pub
S ), plus tax breaks for social purposes
(TBSP, e.g. fiscal incentives for private insurances), minus direct taxes on benefits and
indirect taxes on consumption (T):
priv gross
pub priv net
pub net
tot S S S TBSP T S
S (1)
The social expenditure level and the fiscal policies necessary to finance it play a
contradictory role. In the short term, negative effects of financing public protection or
private insurance prevail, by burdening production prices via corporate taxes and labour
costs, and by hampering productive agents via economic distortions. In the long term,
positive but uncertain effects of benefits increase via better human and social capital,
greater propensity to risky behaviour, higher socio-political and macroeconomic
stability, lower resistance to technological and organizational changes. High social
expenditure is consistent with high productivity to the extent that the long-term benefits
offered by social protection to the economic systems outweigh its short-term costs
(Mares, 2001; Begg et al., 2003: §4; Zagler and Dürnecker, 2003).
3. Analytical formalization
Acemoglu et al. (2006) use a model of endogenous growth driven by innovation and
imitation. Entrepreneurs can engage in innovation thanks to their skills (relying on
entrepreneurial selection) or adopt already well-established technologies from the
frontier (skills play a less important role than in innovation). In order to capture these
two dimensions of productivity dynamics, the growth rate of aggregate technology in a
1 0 1 0 1 1 1 1 0 1 ) ( ) ( ~ ) ( dv v dv v A A A dv v A A A t t t t t t tt (2)
in which At(v) is the productivity of sector v at time t, 1 ~
t
A is the state of world
technology in the previous period, < 1 is the rate of adoption of established
technologies, (ν) > 1 are innovation skills in sector v, and is the distance from the technological frontier. The closer an economy is to the world technology frontier (
close to 0), the higher the importance of innovation relative to imitation as a source of
productivity growth.
It is feasible to include in such a model the effects of social protection on innovation
and imitation. For the sake of simplicity, the economy is composed of two sectors with
no spillovers: the traditional imitation sector aims to gain price competitiveness and low
production costs; the innovation sector aims to gain quality competitiveness and
innovation. Both sectors export to the rest of the world, but the globalisation process has
different effects on them. Far from the world technological frontier, the traditional
sector competes in perfectly competitive markets, which are based on low prices. On the
contrary, the innovation sector competes in not perfectly competitive markets, which are
based on high quality and incorporated innovation, and which are characterized by a
low elasticity of demand on price. As the economy approaches the world technological
frontier, its growth rate slows down and the traditional sector loses importance to
increase productivity in favour of the innovative sector. A country close to the frontier
then needs to shift its productive resources. The question is: does it require more or less
social expenditure to support its innovative sector?
As social expenditure (S) increases, both sectors have long-run and indirect benefits
financial costs. The costs are the same in both sectors, i.e. (i) fiscal receipts as a ratio of
GDP (t), which are a positive function of the public social expenditure level, since they
are increased by taxes to finance it; (ii) labour costs as a share of GDP (w), which are a
positive function of the private social expenditure level4, since they are increased by
corporate benefits spending or wage claims to support out-of-pocket spending:
B = B (
S, W) and B = B (
S, W) (3)
t = t (
S) and w = w (
S) (4).
By arranging (3) and (4), we get and in (2) as functions of S and W:
= ~(B,t,w) = (S ,W) and = ~(B,t,w) = (S ,W) (5).
Partial derivatives S and S
depend on the combined effect of costs and benefits.
My basic hypothesis is that the net effect of social expenditure is negative for the
imitation sector, harmed by increasing prices in the short term, because higher taxes and
labour costs raise export prices and reduce imitation capabilities in competitive markets.
Conversely, the net effect on innovation capabilities is supposed to be positive, because
the productivity-enhancing and long-term ‘social investments’ allowed by taxes and
contributions outweigh their short-term costs:
B w t
, and B t,w
(6).
Such hypotheses allow to represent the contrasting costs and benefits of social
expenditure (Figure 1).
Figure 1: Imitation and innovation capabilities as a function of total social expenditure
Source: author’s own elaborations.
By inserting (5) in (2), we get productivity growth (a) as a function of S and W:
a = + = ~( , , ) w t B + ~( , , ) w t B = (
S, W) + (
S, W) (7)
Partial derivative
S a
is not self-evident, because it depends on the combination of
positive effects on the innovation sector and negative effects on the traditional sector.
Maximizing equation (7) yields to get the optimal level of S (call it S*) at which the net
marginal costs for the traditional sector (C’) are equal to the net marginal benefits for
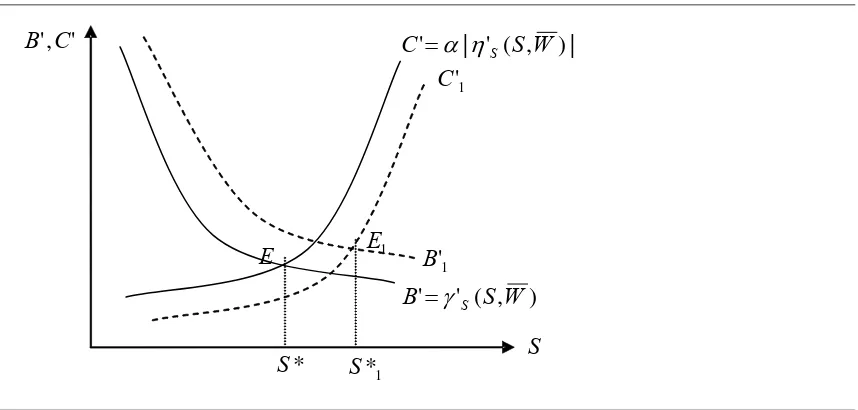
the innovation sector(B’)5, given the other variables. The first-order condition is:
’S (S,W) + ’S (S,W) = 0 (8)
’S (S,W) = |’S (S,W)| (9).
If the optimal level S* is high, then large social expenditure is sustainable, thanks to
its well-designed structure and the favourable economic environment. The probability
5 It is reasonable that benefits are decreasing in
S, because satisfaction of needs begins from basic
ones, and that costs are increasing in S, because of growing complexity of administrative management.
The costs and benefits of social expenditure can be represented by applying a micro-economic framework, similar to Daly’s (1996: chs. 2 and 7) analysis of social and environmental costs related to well-being benefits, provided that its perspective is changed from sustainable development to social protection.
) , (SW
) , (S W
,
that S* increases as marginal benefits shift upward from B’ to B’1 or as marginal costs
shift downward from C’ to C’1, according to suitable values of distance () and
[image:13.595.84.513.204.409.2]structure (W), upon which the probability for equilibrium to hold depends (Figure 2).
Figure 2: Marginal costs and benefits as a function of total social expenditure
Source: author’s own elaborations.
Such parameters have to be discussed in order to compare the sustainability of
different sets of social and economic institutions. Notably, a structure of social
protection able to reduce costs and increase benefits depends on some underlying
parameters shaping W, namely effective and ‘productive’ spending, discount rate of
benefits, and global pressures.
1) A reduced distance from the world technological frontier () increases the weight of
innovation in comparison to imitation, so enhancing the importance of benefits instead
of costs.
2) A low discount rate of expected future benefits (i) increases the actual value of the
benefits flow, often delayed for whole generations (e.g. human capital) despite their
immediate costs.
| ) , ( ' |
' S W
C S
) , ( '
' S W
B S
1 '
C
1 '
B
' ,'C B
E E1
1 *
S
*
3) A high effectiveness of social spending (thanks to low distortions, stickiness,
administrative costs and wastes) and a high share of ‘productive’ expenditure6 ()
increase benefits of a given amount of social protection.
4) Low global pressures – proxied by the dimension of economic and financial
exchanges with the rest of the world () – reduce the importance of global
competitiveness and consequently increase the sustainability of higher production costs
in order to finance social protection.
4. Globalisation, the United States and Europe
The above framework is useful to study the globalisation process, some differences
between countries, and the situation of lagging countries such as Italy.
Globalisation. The optimal expenditure level S* (equilibrium E) is not stable in the
long term. As the degree of globalisation increases, social spending becomes more
costly7, shifting C’ upward (C’glob) (Figure 3). But ‘resistance of status quo’ prevents
taxes and expenditure from being cut in the new equilibrium Eglob, because of strong
electoral incentives, institutional or informal veto points and path dependency (Pierson,
2001: 411-419). This makes S* a disequilibrium, where marginal costs are higher than
marginal benefits (|C’glob| > B’). Two solutions are feasible: either lowering social and
political resistances to rolling back welfare states, or reducing marginal costs and
raising marginal benefits. The latter implies an alteration of the structural parameters
affecting the position of the two curves, notably in the short term: economic systems
6 Notably socioeconomic infrastructures, knowledge and health accumulation, and incentives for
women and young people to enter into the workforce (Zagler and Dürnecker, 2003: 405-408).
7 Increasing pressures of globalisation process on social protection depend on narrower financing
more biased toward high-technology and R&D-intensive sectors (lower ), or a social
expenditure mix more biased toward productive items, with lower administrative costs,
distortions, stickiness and wastes (higher ). Of course, it is more difficult to modify the
[image:15.595.83.524.251.454.2]degree of globalisation () or the discount rate (i) in the short term8.
Figure 3: Effects of globalisation and country-specific circumstances on marginal costs and
benefits
Source: author’s own elaborations.
Country-specific conditions. Structural parameters shaping W are country- and time-
specific. A comparison between the US and continental Europe (Table A.1) shows
interesting institutional and social differences: (i) the best performing country in most
technological indexes is the US, so that its distance from the frontier is 0, but many
European countries are close to the US; (ii) the amount of international assets and
liabilities out of the GDP is high and rising both in the US and in Europe, suggesting a
similar degree of globalisation; (iii) social spending in Europe is more effective and
8 The former could only be possible in supranational coordinated policies, e.g. a stronger
European Union whose continental political level would be closer to the global economic level. The latter depends on cultural and social factors: it could be lower when individuals feel collective long-term
| ) , ( ' |
' S W
C S
) , ( '
' S W
efficient, due to a lower private management and a larger coverage of people9; (iv) the
discount rate is lower in Europe, due to a greater social affinity between taxpayers and
recipients10, to a lower perceived chance to move upward, to different ideas about
luckiness and laziness, to more inclusive political systems, to a greater role of central
government (Alesina et al., 2001; Lindert, 2004a: 179-190). Apart from the distance,
other variables suggest that for continental Europe B’ shifts upward (B’eur) thanks to its
lower discount rate and its higher effectiveness, so that the optimal expenditure level
could be a little higher in Europe (S*eur) than in the US (Figure 3).
Italy. Many scholars stress some major Italian problems in comparison to the rest of
continental Europe: (i) sector specialization in medium-low technology (higher distance
from the frontier); (ii) persistent corruption and criminality, slow administrative
procedures, overly high monetary transfers and excessively low incentives for young
people and women to increase their participation in the workforce (lower effectiveness
of social expenditure); (iii) low fertility rate and fast ageing (higher discount rate of
future benefits). Because of higher marginal costs and lower marginal benefits, the
Italian present-day social expenditure, although slightly lower than in other major
European countries, could be inconsistent with good economic performances. This
could support, from the point of view of the welfare system, the growing amount of
literature about the so-called Italian economic decline.
9 In the US, ongoing transition from corporate benefits for contracted insurance schemes to fiscal
incentives for individual choices implies low control of costs, high advertising expenditure, high use of tax breaks, and low coverage for middle-class workers (Hacker, 2006). E.g. healthcare expenditure in the US is very high, but its coverage and performance are low; Anglo-Saxon pension funds are more costly than European ‘pay-as-you-go’ system because of their administrative costs, and their performances are more variable.
10 Notably in the US an increase in income redistribution represents a transfer of money from
well-off white people to poor Afro- or Latin-Americans, by so limiting the identification between taxpayers
5. Empirical evidence
Some simple empirical analyses for the main OECD countries yield interesting
outcomes about the relationships between social and economic issues (Table A.2), and
reason and effects of different degrees in public involvement11.
1) A principal component analysis (PCA) between social and economic variables
confirms no empirical evidence that in advanced countries productive and innovative
efforts are significantly correlated to their social expenditure or taxation levels (Figure
A.1). The first component (call it ‘social equality’) is positively characterized by social
expenditure, fiscal receipts and the European dummy, and negatively characterized by
some indexes of social uneasiness (poverty, Gini, infant mortality rate) and the
Anglo-Saxon dummy. The second component (call it ‘economic efficiency’) is positively
characterized by competitiveness, technology, innovation and per capita GDP.
2) There is no trade-off between equality and efficiency, because a low public social
expenditure implies an high private spending, so that the shares of national product
devoted to social purposes are similar. The net total social expenditure at factor cost
(public + private – taxes on benefits + tax breaks for social purposes) is similar in
continental Europe (in 2005 France 33.6%, Sweden 29.6%, Germany 30.2%) and in
Anglo-Saxon countries (UK 29.3%, US 27.2%)12. As a consequence, even if their levels
of gross public expenditure are very different, some European countries and the US are
strong innovators and global exporting countries, because what matters is not only the
11 Social expenditure figures refer to 2005 only, since there are no reliable time series; as a
consequence, economic data refer to their annual average from 2003 to 2007. Also competitiveness indexes and social uneasiness indicators are not comparable in different editions of the reports, so last figures only are used.
12 The gap of 19.9 percentages points between the US and Sweden in gross public social
total social expenditure but also its structure.
3) The different proportions of public social expenditure to the total
i pub i i
S S
(10),
higher in continental Europe than in Anglo-Saxon countries13, derive from each
countries’ preferences about public redistribution. This is also confirmed by the
significance of the European and Anglo-Saxon dummies in the PCA. Since such a
divergence derives from institutional, social and political preferences, it does not imply
a priori different innovation capabilities or a gap in productivity. Some scholars wonder
whether a twofold equilibrium holds: in the US low equality among people and high
market competition between firms, while in continental Europe high social inclusion
and strategic interactions between firms, banks and institutions (Scharpf and Schmidt,
2000; Hall and Soskice, 2001; van der Ploeg, 2004; Bénabou, 2004). This is confirmed
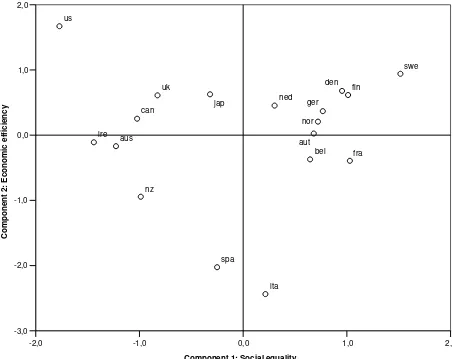
by the country scores on the two components of PCA, which show two different clusters
for continental Europe and Anglo-Saxon countries (the US and New Zealand excluded,
although in the same quadrant) (Figure A.2).
4) However, such differences in the public-private mix of social spending do have
an impact on effective protection from social needs and on the distribution of social
well-being. Europeans are more protected than Anglo-Saxons, thanks to their higher
public involvement in benefit provision: ‘(…) politics remains the key to who gets what,
when and with what effect in the welfare arena’ (Castles and Obinger, 2007: 217). A
number of indexes of social uneasiness (U), proxied by the UNDP human poverty index
for advanced countries (HPI-2), are negatively and significantly correlated with public
13 Public share in continental Europe (
eur between .86 and .96, the Netherlands excluded) is
higher than in the US (us = .68) and in other Anglo-Saxon countries, since European private expenditure
social expenditure and fiscal receipts (Figure A.3):
U = U (
Spub) (11).
This is not only a social problem, because an unfair access to social protection limits its
redistributive effectiveness, thus harming the channels through which some welfare
system elements become productive factors for the economic system.
6. Concluding remarks
Empirical evidence seems to confirm that high levels of social expenditure could be
consistent with economic performances, to the extent that some structural conditions are
met. Since the design and the structure of the welfare systems are crucial in analyzing
their costs and benefits, the total social expenditure levels do not suffice to clarify
whether the long-term benefits outweigh their short-term costs. This holds when the
social protection structure is efficient and designed to reduce its financial constraints, to
ensure protection from growing global risks, and to support productive specialization in
high-tech and high-innovation sectors. Therefore, adjusting and recasting should be the
priority focus in reforming social protection systems, rather than either rolling back the
welfare state or defending its present-day levels. As a matter of fact, the former would
imply higher – and not necessarily more efficient – private social spending, while the
latter does not guarantee its sustainability over time. Such considerations provide some
suggestions in respect of outstanding stylized facts.
1) Economies with different social protection systems can all have good
performances because the net total social expenditure and its structure are more
analogous issues and growing needs: higher exposure to global shocks, more flexible
employment, ageing and less standard families.
2) Differences in the public expenditure levels in advanced countries depend on
historical preferences regarding redistribution, according to social affinity, ideas on
poverty and social mobility, and political systems. Reached via dissimilar growth paths,
such differences usually do not prevent a priori high innovation and productivity.
3) Large social protection systems can be thus sustainable and even
productivity-enhancing. Since globalisation, technological change and demographic transition imply
strong pressures on social protection – by raising its financing costs despite its growing
demand – a disequilibrium appears, where marginal costs outweigh their benefits. It is
necessary to reduce marginal costs and to increase benefits, via more effective spending
items and productive specialization more biased toward high-technology sectors.
4) In lagging countries such as Italy, sector specialization is biased toward
medium-low technology and protection schemes are not aimed to support productive or effective
expenditure. This is related to the capability of satisfying social needs, which is at the
very same time a precondition for productivity growth. Italy thus needs political action
to break its low-productivity and low-protection equilibrium, and to approach the
Appendix: empirical evidence in some OECD countries
Table A.1: Values of structural parameters in different countries
Parameters Proxies USA Europe Italy 1. Distance from the
technological frontier ()
Difference with the US
technological index Zero Low High 2. Effectiveness of the social
expenditure ()
Share of private management,
coverage of people, wastes Low High Interm. 3. Degree of globalisation
()
International assets and
liabilities out of GDP High High High 4. Discount rate of expected
future benefits (i)
Social affinity and political
inclusion Low High High Overall effect on optimal expenditure level (S*)
Source: author’s own elaborations.
Table A.2: Socio-economic variables in the main OECD countries
Variables Year USA UK Germ. France Italy
Social expenditure
Gross public (% of GDP) 2005 17.1 24.1 30.0 33.8 28.8 Net public (% of GDP) 2005 18.5 22.7 28.2 30.4 24.8 Net total (% of GDP) 2005 27.2 29.3 30.2 33.6 26.6 Fiscal receipts (% of GDP) 2003-07* 33.1 40.9 43.8 49.8 45.0
Economic performances
PPP per capita GDP (1.000 USD) 2003-07* 36.8 28.4 26.9 26.5 26.1 Productivity growth (% change) 2003-07* 1.77 1.84 1.07 1.32 0.03 Competitiveness index (1 to 7) 2007 5.67 5.41 5.51 5.18 4.36 Innovation index (1 to 7) 2007 5.68 5.10 5.70 5.08 4.18 Technology index (1 to 7) 2007 5.77 5.53 5.28 5.04 4.38
Social uneasiness
HPI-2 index 2005 15.4 14.8 10.3 11.2 11.6** Infant mortality rate (‰) 2005 6.37 5.01 4.08 3.41 5.72 Gini index (1 to 100) about 2000 40.8 36.0 28.3 32.7 36.0
Notes: (*) Annual average. (**) Earlier data, since 2005 figure is unreliable.
[image:21.595.87.538.377.584.2]Figure A.1: Loadings of socio-economic variables on the components of PCA
1,0 0,5
0,0 -0,5
-1,0
Component 1: Social equality
1,0
0,5
0,0
-0,5
-1,0
Comp
onent 2: Eco
nomic
eff
iciency dum_eur
dum_as
gini infmort
hpi
tech
innovat compet
product gdppcppp
fiscalre nettotex
netpubex
gropubex
Notes: Component 1: = 6.48 and variance = 46.3%. Component 2: = 3.67 and variance = 26.2%. Total explained variance = 72.5%. Dummy variables denote Anglo-Saxon (dum_as) and continental European countries (dum_eur).
Figure A.2: Scores of the countries on the components of PCA
2, 1,0
0,0 -1,0
-2,0
Component 1: Social equality
2,0
1,0
0,0
-1,0
-2,0
-3,0
Com
p
one
n
t 2: Ec
onom
ic ef
ficienc
y
us
uk
swe
spa
nor
nz
ned jap
ita ire
ger
fra fin den
can
bel aut aus
Figure A.3: Social uneasiness and fiscal receipts
60,0 55,0
50,0 45,0
40,0 35,0
30,0
Fiscal receipts (annual avg 2003-07)
16,0
14,0
12,0
10,0
8,0
6,0
Hpi-2
index
(2
005
)
us
uk
swe spa
nor ned
jap
ita ire
ger
fra
fin den can
bel
aut aus
Notes: Pearson correlation = -.78 (significant at 1% level).
References
Acemoglu, D., Aghion, P., Zilibotti, F. (2006) ‘Distance to Frontier, Selection, and Economic Growth’,
Journal of the European Economic Association 4 (1): 37-74.
Adema, W., Ladaique, M. (2005) ‘Net Social Expenditure, 2005 Edition. More comprehensive measures
of social support’, OECD Social, Employment and Migration Working Papers, 29.
Alesina, A., Perotti, R. (1997) ‘The Welfare State and Competitiveness’, American Economic Review 87
(5): 921-939.
Alesina, A., Glaeser, E., Sacerdote, B. (2001) ‘Why Doesn’t the United States Have a European-Style
Welfare State?’, Brookings Papers on Economic Activity, 2/2001.
Atkinson, A.B. (1999) The economic consequences of rolling back the Welfare State. Cambridge, Mass.:
MIT Press.
Barr, N. (2001) The Welfare State as Piggy Bank. Information, Risk, Uncertainty, and the Role of the
State. Oxford: Oxford University Press.
Begg, I., Ferrera, M.,Hodson, D., Madsen, P., Matsaganis, M., Sacchi, S., Schelkle, W. (2003) The Costs
of Non-Social Policy: Literature Review, Report for the DG Employment and Social Affairs of the European Commission, Brussels.
Bénabou, R. (2004) ‘Inequality, Technology, and the Social Contract’, in Aghion, P., Durlauf, S.N. (eds.)
Handbook of Economic Growth. Amsterdam: North Holland.
Bowles, S., Gintis, H. (2000) ‘Risk Aversion, Insurance, and the Efficiency-Equality Tradeoff’, Working
papers, 2000-03, University of Massachusetts Amherst – Dept. of Economics.
Castells, M., Himanen, P. (2002) The Information Society and the Welfare State: The Finnish Model.
Oxford: Oxford University Press.
Castles, F.G., Obinger, H. (2007) ‘Social expenditure and the politics of redistribution’, Journal of
European Social Policy 17 (3): 206-222.
Crouch, C., Streeck, W. (eds.) (1997) Political Economy of Modern Capitalism: Mapping Convergence
and Diversity. London: Sage.
Daly, H. (1996) Beyond Growth. The Economics of Sustainable Development. Boston: Beacon Press.
Esping Andersen, G. (1999) Social Foundations of Postindustrial Economies. Oxford: Oxford University
Press.
Esping Andersen, G. (2002) ‘Towards the Good Society, Once Again?’, in Esping Andersen, G., Gallie,
D., Hemerijck, A., Myles, J. Why We Need a New Welfare State. Oxford: Oxford University Press.
Esping Andersen, G. (2003) Welfare and Efficiency in the New Economy, Report to the Progressive
Governance Conference, London.
Ferrera, M., Rhodes, M. (2000) Recasting European Welfare States. London: Cass.
Fouarge, D. (2003) Costs of non-social policy: towards an economic framework of quality social policy –
and the costs of not having them, Report for the DG Employment and Social Affairs of the European Commission, Brussels.
Goodin, R.E., Headey, B., Muffels, R., Dirven, H.J. (1999) The Real Worlds of Welfare Capitalism.
Cambridge: Cambridge University Press.
Gough, I. (1996) ‘Social Welfare and Competitiveness’, New Political Economy 1 (2): 209-232.
Hacker, J.S. (2006) The Great Risk Shift. Oxford: Oxford University Press.
Comparative Advantage. Oxford: Oxford University Press.
Hassler, J., Rodriguez Mora, J.V., Storesletten, K., Zilibotti, F. (2003) ‘The Survival of the Welfare
State’, American Economic Review 93 (1): 87-112.
Lindert, P.H. (2004a) Growing Public. Social Spending and Economic Growth Since the Eighteenth
Century, Volume I: The Story. Cambridge: Cambridge University Press.
Lindert, P.H. (2004b) Growing Public. Social Spending and Economic Growth Since the Eighteenth
Century, Volume II: Further Evidence. Cambridge: Cambridge University Press.
Mares, I. (2001) ‘Firms and the Welfare State: When, Why, and How Does Social Policy Matter to Employers?’, in Hall and Soskice (2001).
Okun, A. (1975) Equality and Efficiency: the Big Trade-off. Washington: Brookings.
Pierson, P. (ed.) (2001) The New Politics of the Welfare State. Oxford: Oxford University Press.
Rodrik, D. (1997) Has Globalization Gone Too Far?. Washington: Institute for International Economics.
Rodrik, D. (1998) ‘Why Do More Open Economies Have Bigger Government?’, Journal of Political
Economy 106 (5): 997-1032.
Rodrik, D., Subramanian, A., Trebbi, F. (2004) ‘Institutions Rule: The Primacy of Institutions over
Geography and Integration in Economic Development’, Journal of Economic Growth 9 (2): 131-165.
Scharpf, F.W., Schmidt, V.A. (eds.) (2000) Welfare and Work in the Open Economy. Volume I: From
Vulnerability to Competitiveness. Oxford: Oxford University Press.
Sen, A. (1992) Inequality Reexamined. Oxford: Clarendon.
Sen, A. (1999) Development as Freedom. Oxford: Oxford University Press.
Sinn, H.W. (1996) ‘Social Insurance, Incentives and Risk Taking’, International Tax and Public Finance
3 (3): 259-280.
Tanzi, V. (2000) ‘Globalization and the Future of Social Protection’, IMF Working Paper, 00/12.
van der Ploeg, F. (2004) ‘The welfare state, redistribution and the economy: Reciprocal altruism,
consumer rivalry and second best’, CESifo Working Paper, 1234.
Zagler, M., Dürnecker, G. (2003) ‘Fiscal Policy and Economic Growth’, Journal of Economic Surveys 17