http://dx.doi.org/10.4236/jss.2016.47004
Study on the State Grid Operational
Diagnosis Index System
Jijun Wang
1, Jing Tan
2, Lisha Gao
1, Hui Zhang
31State Grid Jiangsu Electric Power Company, Nanjing, China
2Jiangsu Electric Power Information Technology Co. Ltd., Nanjing, China 3Beijing China Power Information Technology Co., Ltd, Beijing, China
Received 30 March 2016; accepted 18 July 2016; published 25 July 2016
Abstract
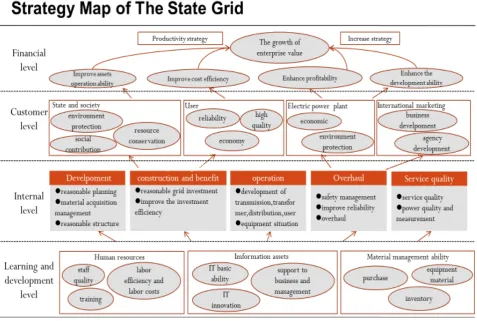
This research analyzes the strategy objectives in the financial level, customer level, the internal level, learning and growth level with the method of the strategy map, and then sets up the targets on each strategic objectives. At last, this paper analyzes indicators to measure these targets, and establish the enterprise operation index system aiming to provide a new way of thinking and me-thods for evaluating the operation of Power Grid Corp.
Keywords
Operation Diagnosis, Index System, Strategy Map
1. Introduction
In recent years, the State Grid aims to accelerate the construction as a modern enterprise, and create a “world- class power grid, international first-class enterprise”. To reform as a driving force, it’s a target to improve the modern enterprise system, complete the restructuring of the grid enterprise business, assets, institutions and personnel, strengthen enterprise management, transform the management mechanism, and initially establish a modern enterprise system. It’s important to accelerate structural adjustment, optimize the allocation of resources, realize asset to maintain value rise, and finally realize the goal of constructing the national power grid enterprise to a modern large-scale enterprise.
In this context, the scientific enterprise diagnosis is very necessary. This paper constructs the enterprise oper-ation diagnosis index system based on the strategic map analysis method. The system, according to the strategic map, fully reflects the business operations in financial level, customer level, internal level, and learning and growth level.
2. Research Method
This paper adopts the method of strategy map. Strategy map theory was formally proposed by Robert Kaplan and David Norton in 2004 in their co-authored book, “strategy map–converting in tangible assets into tangible outcomes”, which is an important part of the famous theoretical system, the balanced score card. The strategy map completely interprets the logic of the Balanced Scorecard theory: it is a must to be able to measure strategy before managing strategy, and it is a must to be able to describe strategy before measuring strategy.
As a strategy performance management and evaluation tool, the strategy map mainly measures the corporate from financial level, customer level, internal process level, and learning and innovation level. The core idea is to show the strategic trajectory through analyzing the interaction between the four indicators.
3. Analysis Process
3.1. Determined All Levels of the Power Grid Strategic Direction
According to the Strategy Map Analysis Method
According to the analysis above, the strategy map mainly measures corporate from financial level, customer level, internal process level, and learning and innovation level. Therefore, this study, combining with the devel-opment strategy and the actual situation of the national grid, firstly determines the strategic objectives of the four levels.
The total strategic goal in the financial level for the enterprise is value growth. At the customer level, four main bodies related to China State Grid Corp are the state and society, users, power plants, and the international market. Therefore, at this level, State Grid’s strategy is to coordinate the relationship with the four main bodies. At the internal level, the strategy is development, construction and investment efficiency, operation, overhaul, and quality of service. At the learning and growth level, the strategy is human capital, information capital, and material management ability.
3.2. Determining the Target Level According to the Strategic Direction
At the financial level, we determine the five specific targets: cost, level of profitability, solvency, operation abil-ity, and development ability.
At the state and society level, the targets are environment protection, resource conservation and social contri-bution. At the user level, as the State Grid is an electric energy service provider, the specific targets are reliabil-ity, economy, and quality.
At the power plant level, the power generation enterprises pay close attention to the cooperation with the na-tional grid and the economic benefits from the cooperation, so the specific targets are environmental protection and power plant economy. At the international market level, as the national grid positively develops national business in recent years, therefore, the specific targets are the development of international institutions and the development of overseas business.
At the internal level and the learning and growth level, we set goals according to the company strategic direc-tion the same way as the levels above, which will be discussed in the following secdirec-tions.
3.3. Determining Index System According to the Corresponding Target Index
Based on the basic theory of strategic map, we analyze strategic objectives and specific targets in all aspects of the national grid, and operation diagnosis index system is formulated referring to these goals and national grid existing index database.
4. Results and Discussion
According to strategy map theory, we can get the strategy map of State Grid. As shown below, Figure 1 shows the goals and specific targets of national grid in the financial level, customer level, internal level, learning and development level. Specific indicators based on these targets are further provided to measure these goals.
4.1. Financial Level
Figure 1. Strategy map of the state grid.
enterprise financial risk indicators, so this study analyzes the risks from five aspects, namely cost, profit ability, debt paying ability, operating ability, and development ability. The analysis at the cost level shows if cost con-trol is reasonable in the process of enterprise operation. Profitability analysis shows the questions of business links. Solvency analysis shows the enterprise’s ability to continue as a going concern and its risks. Operational capacity study shows the assets operation ability. Developmentability study shows the development trend of the enterprise, and judges whether there are risks in its operating and financial decisions. These four aspects includ-ing static indicators and dynamic indicators, can reflect the financial position, operatinclud-ing results, and judge the existence of enterprise financial crisis (Table 1).
4.2. Customer Level
At the customer level, it mainly analyzes the four main bodies which are closely connected with the National Grid: the state and society, the sale of electricity purchase terminal, terminal and the international market.
4.2.1. State and Society
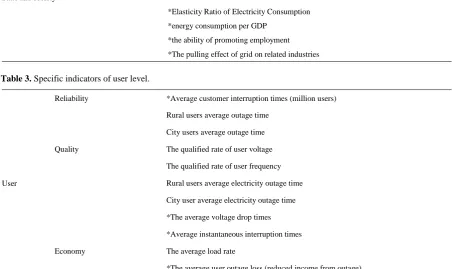
With the national energy development strategy as the guidance, the targets are to save energy and reduce emis-sions of harmful gases (Table 2).
4.2.2. User
Table 1. Specific indicators of financial level.
Financial level
Cost level Cost Profit Ratio
A unit of electricity transmission and distribution cost transmission and
distribution cost transmission and distribution cost transmission and distribution cost
Per million of power grid assets operation and maintenance costs
Profitability Operating Profit Margin
Rate of Return on Common Stockholders’ Equity
Return on Total Assets
Solvency
Quick Ratio
Debt to Assets Ratio
Operation ability Receivables Turnover Ratio
Current Assets Turnover
Total Assets Turnover
Development ability Operating Profit Growth Rate
Main Business Revenue Growth Rate
[image:4.595.85.544.365.503.2]The rate of remain and increasing value of the state-owned assets
Table 2. Specific indicators of state and society level.
State and society
Generation rights trade coal saving
Generation right transaction reduction SO2
Generation right transaction reduction CO2
Energy saving distribution transformer ratio
*The utilization rate of land resources
*Elasticity Ratio of Electricity Consumption
*energy consumption per GDP
*the ability of promoting employment
*The pulling effect of grid on related industries
Table 3. Specific indicators of user level.
User
Reliability *Average customer interruption times (million users)
Rural users average outage time
City users average outage time
Quality The qualified rate of user voltage
The qualified rate of user frequency
Rural users average electricity outage time
City user average electricity outage time
*The average voltage drop times
*Average instantaneous interruption times
Economy The average load rate
[image:4.595.86.548.440.709.2]4.2.3. Electric Power Plant
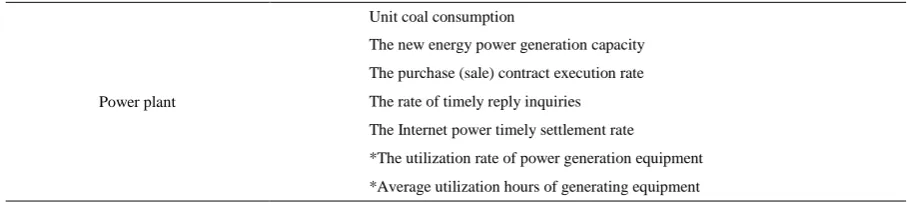
Since several competitors formed at the generation side, all power enterprises became independent economic entity, which pursuit maximizing its benefit. Therefore, power companies pay more attention to the cooperation with the national grid and its economic benefit (Table 4).
4.2.4. International Marketing
In recent years, the State Grid has been working in constructing “a world-class power grid, an international first-class enterprise”, and its business is actively expanding into the international market. Through international distribution, its ability of international company business management has improved significantly. The devel-opment of the international market also has a certain role in promoting the develdevel-opment of power grid enterprise. Therefore, it’s necessary to pay attention to exploration and development of the international market in the index system. The specific indicators consist of overseas business income, interests and development of overseas in-stitutions (Table 5).
4.3. Internal Level
According to the company’s strategy, it’s necessary to focus on the human resources, financial, material inten-sive management, the planning, construction, operation, overhaul, and marketing system.
At the internal level, mainly based on the strategic requirements, we select the relevant diagnostic indicators in the five aspects of power grid development, power grid construction and investment efficiency, power grid operation, maintenance and customer service.
4.3.1. The Development of Power Grid
[image:5.595.85.539.406.507.2]We pay attention to accuracy rate of planning project, material procurement, the situation of grid lines from the aspect of the development of State Grid (Table 6).
Table 4. Specific indicators of power plant level.
Power plant
Unit coal consumption
The new energy power generation capacity
The purchase (sale) contract execution rate
The rate of timely reply inquiries
The Internet power timely settlement rate
*The utilization rate of power generation equipment
*Average utilization hours of generating equipment
Table 5. Specific indicators of the international market financial level.
The international market (for group)
Overseas contract amount
Overseas business income
The total profit of overseas business
Total amount of overseas assets
The number of overseas institutions
[image:5.595.88.540.648.720.2]*The proportion of the operating income in the total income
Table 6. Specific indicators of the development level.
The development of power grid
Project planning accuracy rate
The procurement standard execution rate
Capacity-load ratio
The passing rate of power grid N-1
4.3.2. Construction and Investment Efficiency
As power grid construction is the foundation of development, the investment and efficiency of equipment are important factors (Table 7).
4.3.3. Operation
The diagnosis of power grid operation is mainly from the evaluation of power transmission, substation, power distribution and power users, and at the same time, we evaluate the operation of the power grid equipment.
a) Transmission link
The goal of building a smart grid transmission side is to enhance the transmission capacity of transmission lines, reduce transmission cost, strengthen the line running state considerable and controllability, and realize state assessment, fault diagnosis, maintenance and risk early warning. It mainly consists of the key technology of UHV transmission, flexible HVDC transmission line, transmission line condition monitoring and intelligent inspection (Table 8).
b) Transformer link
The development of the transformer side focuses on intelligent substation, and its main goal is to provide ref-erence for smart grid scheduling and equipment operation management optimization and decision through the construction of Smart Substation and other intelligent device (Table 9).
c) Dispatching link
At the dispatching link, the key problem to solve is safety and stable operation of large power grid; energy saving, emission reduction and resources allocation optimization, and grid integration operation coordination control.
Based on the distributed integration platform, it’s important to realize homogenization scheduling manage-ment, enhance grid scheduling control ability and optimize the ability of the resource allocation, decision-mak- ing, regulation and control, grid security, stability, economic operation, high quality guarantee. The construction of distribution network, distribution automation, the popularization of electric vehicles and distributed energy access are also important concerns. The targets are to building the efficient, flexible and reasonable distribution network, achieve centralized/decentralized storage compatible access, unified control device and distributed power supply, and complete the construction of practical distribution automation system (Table 10).
Table 7. Specific indicators of the construction and investment benefit level.
Construction and investment benefit
The scale of under-construction project
*The unit power supply load increase investment
*The increase electricity per power investment
Asset formation rate
Investment income ratio
The number of equipment and materials’ defects for new production
Table 8. Specific indicators of the transmission link.
Transmission link
The scale of UHV transmission line
The scale of flexible transmission device application
The proportion of new transmission technology application
Transmission line condition monitoring rate
Intelligent inspection rate of transmission line
Table 9. Specific indicators of the transformer link.
Transformer link The proportion of Smart Substation Intelligent substation capacity ratio
Table 10. Specific indicators of the dispatching link.
Dispatching and operation The daily load forecasting qualified rate
The proportion of 220 kV and above unattended substation
At or above the provincial level monitoring information accuracy
The actual maximum power delivery of cross line
Adjustable capacity
Distribution link Insulated overhead line rate of city distribution network
Distribution automation terminal coverage rate
Distributed power grid connection capacity
The construction scale of Micro-grid system
d) User link
The main task of user side is the construction of the electricity information collection system, the construction of two-way interaction between the user and the system of power grid, and finally to enhance the efficiency of user electric energy utilization and operation. In addition, the development of the smart grid user side focuses on the promotion of electric vehicles and the construction related to charge and discharge facilities (Table 11).
e) Equipment situation
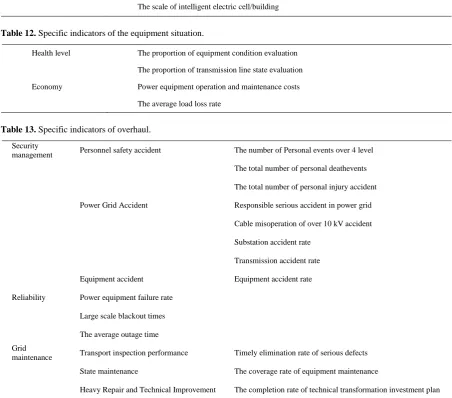
The condition of the equipment is very important during the operation process. Therefore, health and econo-my of equipment are two important aspects to diagnose (Table 12).
4.3.4. Overhaul
Network security is an important aspect of power grid construction. Therefore, maintenance is an essential link. Three aspects of grid maintenance focus on safety management, reliability, and maintenance condition. Main-tenance of accidents and the situation of power grid are necessary (Table 13).
4.3.5. Customer Service
The evaluation of customer service is mainly to measure service quality and power quality (Table 14).
4.4. Learning and Development
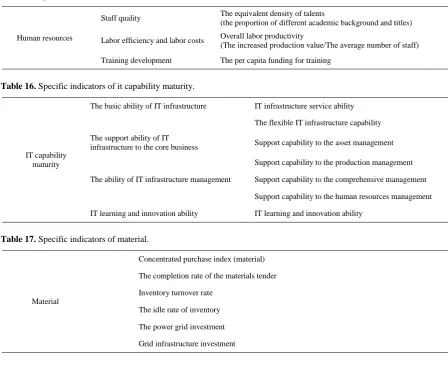
4.4.1. Human ResourcesIn the diagnosis of human resources, we need to analyze the team quality, and the analysis consist of the propor-tion of employees with different levels of educapropor-tion and titles, employee work efficiency and training develop-ment [4] (Table 15).
4.4.2. IT Capability Maturity
The enterprise IT capability maturity consists of four dimensions, which are basic ability, ability of supporting business, ability of supporting management, and ability of IT learning and innovation [5] (Table 16).
4.4.3. Material
The diagnosis of the enterprise supplies focuses on the power grid investment and construction, inventory, and procurement bidding (Table 17).
Based on the strategy map method, this study analyzes the strategic goals of the national grid in four different levels of and the specific targets of strategic objectives. Combined with the existing internal index database, we established an enterprise diagnosis index system and provided a new method for diagnosis of power grid opera-tion.
Table 11. Specific indicators of the user side.
User link Smart meter penetration rate
The scale of electricity information collection system
The scale of electric vehicle charging facilities
Electric vehicle charging load
The scale of intelligent electric cell/building
Table 12. Specific indicators of the equipment situation.
Health level The proportion of equipment condition evaluation
The proportion of transmission line state evaluation
Economy Power equipment operation and maintenance costs
[image:8.595.86.539.172.570.2]The average load loss rate
Table 13. Specific indicators of overhaul.
Security
management Personnel safety accident The number of Personal events over 4 level
The total number of personal deathevents
The total number of personal injury accident
Power Grid Accident Responsible serious accident in power grid
Cable misoperation of over 10 kV accident
Substation accident rate
Transmission accident rate
Equipment accident Equipment accident rate
Reliability Power equipment failure rate
Large scale blackout times
The average outage time
Grid
maintenance Transport inspection performance Timely elimination rate of serious defects
State maintenance The coverage rate of equipment maintenance
[image:8.595.88.541.597.718.2]Heavy Repair and Technical Improvement The completion rate of technical transformation investment plan
Table 14. Specific indicators of the customer service.
Service quality Average electrical connection time of high-press customer business expanding
The average duration of power failure
95598service satisfaction rate
Customer satisfaction rate
Power quality
and measurement The pass rate of electric energy metering device configuration The qualified rate of comprehensive voltage
Table 15. Specific indicators of human resources.
Human resources
Staff quality The equivalent density of talents
(the proportion of different academic background and titles)
Labor efficiency and labor costs Overall labor productivity
(The increased production value/The average number of staff)
Training development The per capita funding for training
Table 16. Specific indicators of it capability maturity.
IT capability maturity
The basic ability of IT infrastructure IT infrastructure service ability
The flexible IT infrastructure capability
The support ability of IT
infrastructure to the core business Support capability to the asset management
Support capability to the production management
The ability of IT infrastructure management Support capability to the comprehensive management
Support capability to the human resources management
IT learning and innovation ability IT learning and innovation ability
Table 17. Specific indicators of material.
Material
Concentrated purchase index (material)
The completion rate of the materials tender
Inventory turnover rate
The idle rate of inventory
The power grid investment
Grid infrastructure investment
case of the statistics need. In the practical application of the index system for performance evaluation, the enter-prise can use the AHP score method to diagnose the operation situation.
References
[1] Wang, J.-M. and Shi, T. (2012) Construction of Evaluation Index System for Smart Grid. North China Electric Power University, 40, 194-196.
[2] Song, Q. (2014) Research on Comprehensive Benefits Evaluation and System Planning of Smart Grid. Zhejiang Uni-versity.
[3] Ding, D. and Qian, C.-Z. (2014) Security Stability Analysis of Photovoltaic Access to Regional Power Grid Based on P-V Curve. Computer Engineering & Software, 37, 106-112.
[4] Yang, Q. and Chen, M.-Y. (2010) Research on Evaluation Index System of Provincial Electric Power Enterprise Based on AHP. Journal of Shaanxi University of Science & Technology (Natural Science Edition), 28, 159-164.
Submit or recommend next manuscript to SCIRP and we will provide best service for you:
Accepting pre-submission inquiries through Email, Facebook, LinkedIn, Twitter, etc. A wide selection of journals (inclusive of 9 subjects, more than 200 journals) Providing 24-hour high-quality service
User-friendly online submission system Fair and swift peer-review system
Efficient typesetting and proofreading procedure
Display of the result of downloads and visits, as well as the number of cited articles Maximum dissemination of your research work