Munich Personal RePEc Archive
Effects of the crisis on the financial
sector: Trends and policy issues
Escudero, Verónica
International Labour Organization
2009
Online at
https://mpra.ub.uni-muenchen.de/55759/
Verónica Escudero
The International Institute for Labour Studies was established in 1960 as an autonomous facility of the International Labour Organization (ILO). Its mandate is to promote policy research and public discussion on issues of concern to the ILO and its constituents — government, business and labour.
1
The paper has been prepared by Verónica Escudero, with inputs from Ekkehard Ernst, Steven Tobin and Raymond Torres (International Institute for Labour Studies).
Verónica Escudero
1Effects of the crisis on the
financial sector: Trends and
policy issues
Copyright © International Labour Organization (International Institute for Labour Studies) 2009.
Short excerpts from this publication may be reproduced without authorization, on condition that the source is indicated. For rights of reproduction or translation, application should be made to the Editor, International Institute for Labour Studies, P.O. Box 6, CH-1211 Geneva 22 (Switzerland).
ISBN Print: 978-92-9014-912-5 Web/pdf: 978-92-9014-913-2
First published 2009
The responsibility for opinions expressed in this paper rests solely with its author, and its publication does not constitute an endorsement by the International Institute for Labour Studies of the opinions expressed.
TABLE OF CONTENTS
Preface...vi
Introduction ...2
Part I. Impact of the crisis on employment in the financial sector ...2
1. Recent trends in the US and the UK ... .5
2. Job prospects for 2009-2010: possible scenarios ...12
Part II. Possible policy responses ...18
1. Adopting a comprehensive strategy to respond to the crisis ...18
2. Helping workers cope with the crisis in the financial sector ...19
3. Policies for a more effective financial sector at the service of the real economy ...22
Concluding Remarks ...24
Bibliography...26
Annex 1 – Evolution of total employment: United States and United Kingdom...27
Preface
The economic prospects for this year are the worst in modern economic history. Projections for 2009 point to the worst contraction in the world economy since the Second World War. Meanwhile, international trade and foreign direct investment, among the most powerful engines of economic growth and development, are expected to contract following two decades of rapid expansion. For many developing countries, this is further aggravated by the fall in export prices and a cut in migrants’ remittances.
The economic crisis is already causing massive job losses. In developed countries, this means higher unemployment – so far mitigated somewhat by recourse to shorter hours and labour hoarding. In developing countries, the crisis is leading to losses of formal jobs, affecting women disproportionately. Workers go back to rural areas or take informal jobs, entailing lower pay and worse working conditions. Everywhere, youth leaving school face significant difficulties entering the labour market. A jobs crisis of colossal proportions is in the making.
The crisis is hitting the financial sector disproportionately and on a permanent basis, at least in some countries. This paper looks at the effects of the crisis on employment and earnings in the financial sector. It also considers how policies can help support adjustment in the sector, while also paving the way for a financial system that truly serves the needs of the real economy.
Raymond Torres Director
Introduction
There is a heated debate regarding the role of the financial sector in the current financial and economic crisis. Inappropriate regulations, combined with irresponsible risk-taking on the part of certain actors, have been regarded as key factors behind the crisis. Accordingly, experts recommend a range of financial reforms to overcome the pervasive effects of the crisis and put the financial system on a more sustainable track. Some advocate a radical overhaul of the financial system, while others favour a more gradual approach. Yet, little consideration has been given so far to the labour and social challenges resulting from ongoing adjustments in the financial sector itself and to the impacts these reforms may have in terms of the role of the financial sector in supporting growth.
The purpose of this paper is to address this gap. The paper begins with an assessment of the effects of the crisis on employment and earnings in the financial sector (Part I). The analysis provides first a discussion of international employment trends in the sector in the group of EU27 countries and other developed countries with an in-depth analysis of the United States and the United Kingdom – two countries at the epicentre of the crisis and where its impacts on the financial sector have been felt most strongly. Part I also presents projections for employment losses for the sector during 2009 and 2010. In Part II, the paper considers the role of policies in supporting adjustment in the financial sector and discusses a number of key dilemmas in this regard. Finally, Part III presents concluding remarks.
Part I. Impact of the crisis on employment in the financial
sector
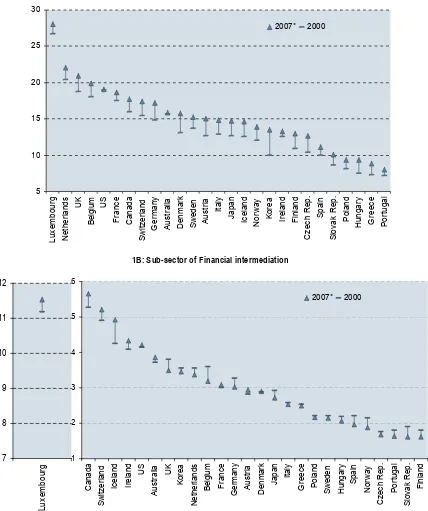
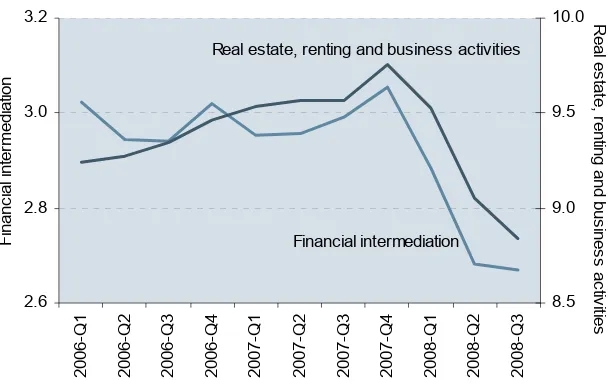
2In the developed world, employment in the broader sector of Finance, insurance, real estate and business services3, during the period 2000-2007, seems to have gained importance as a share of total employment (see figure 1A). However, when analyzing the sub-sector of financial intermediation specifically, a trend decline that began prior to the crisis is apparent (see figure 1B). Since the end of 2007, this downward trend accelerated and spread to the sub-sector of Real estate, renting and business activities. Thus, employment in both sub-sectors has ended up losing size as a share of total employment, as a consequence of the crisis (see figure 2). The share of financial intermediation’s employment and its changes over time, however, varies considerably within the developed countries analyzed (see figure 1B).
2
See Box 1 for an explanation of what comports the sector of financial activities for the analysis of this paper.
3
Figure 1. Share of employment in financial services in total employment, 2000 and 2007** (Per cent)
1A: Sector of Finance, insurance, real estate and business services*
5 10 15 20 25 30 Lux embour g N et h er lands UK B e lg iu m US F ranc e C anada S w itz er land G er m any A u s tr a lia D enmar k S w eden Au s tr ia It al y J apan Ic el and No rwa y Ko re a Ir el and F inl and C z ec h R ep. S pai n S lov ak R ep. P ol and H ungar y G reec e P or tugal 2007* 2000
1B: Sub-sector of Financial intermediation
1 2 3 4 5 6 C ana da Sw itz e rl a n d Ic e la n d Ir e la n d US Au s tr a lia UK Ko re a N e th er la nd s Be lg iu m Fr a n c e Ge rm a n y Au s tr ia Den m ar k Ja p a n Ita ly Gre e c e Po la n d S w ede n H u nga ry Sp a in No rw a y C z ec h R e p. P or tug al S lov a k R e p. Fi n la n d 2007* 2000
Source: Author’s estimates based on OECD STAN Database.
Note: *The sector of Finance, insurance, real estate and business services comports two sub-sectors according to this classification: (1) Financial intermediation, and (2) Real estate, renting and business activities.**Information for Austria, Belgium, Canada, Czech Republic, Denmark, Finland, Germany, Greece, Italy, Iceland, Japan, Korea, Luxembourg, Norway, Slovak Republic, Switzerland, the UK and the US corresponds to 2007 data. Information for Australia, France, Hungary, Ireland, Netherlands, Portugal, Spain and Sweden corresponds to 2006 data. Information for Poland corresponds to 2005 data.
Figure 2. Share of employment in financial services in total employment in the EU27, 2006-2008 2.6 2.8 3.0 3.2 2006-Q 1 2006-Q 2 2006-Q 3 2006-Q 4 2007-Q 1 2007-Q 2 2007-Q 3 2007-Q 4 2008-Q 1 2008-Q 2 2008-Q 3 F inan c ial in ter m edi ati o n 8.5 9.0 9.5 10.0 R eal es tat e , r enti ng and bus ines s ac tiv iti es
Real estate, renting and business activities
Financial intermediation
Source: Author’s estimates based on Eurostat’s LFS statistics.
Box 1 – Financial activities: what the sector comports
For the purpose of this paper Financial activities refer to the broad sector of Finance, insurance, real estate and business services as defined by NACE and ISIC. This broad sector comports two sub-sectors: (1) Financial intermediation, and (2) Real estate, renting and business activities. Data taken from OECD and from Eurostat correspond to this definition.
However, for the study of employment in the financial sectors of the US and the UK, country-specific databases were preferred, following the recommendations of the statistical departments of both countries. Country-specific databases use different definitions to explain the extent of the financial sector and also use different methodologies in collecting data. In the US, Financial activities refer to the sub-sectors of (1) Finance and Insurance, and (2) Real estate, rental and leasing; which means that business services are not part of this economic activity. For the UK, on the other hand, the sector includes financial and business activities, which explains the larger size of the sector’s employment relative to total employment.
It is important to note, therefore, that the results presented here for the US and the UK are not comparable across countries.
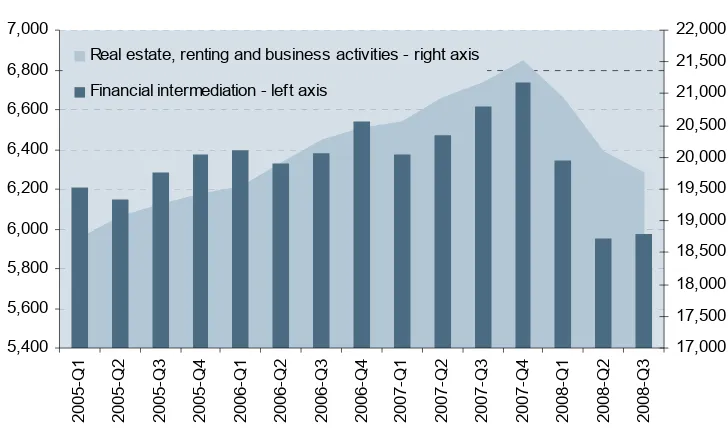
Figure 3. Evolution of employment in financial services in the EU27, by sub-sector (In thousands) 5,400 5,600 5,800 6,000 6,200 6,400 6,600 6,800 7,000 2005-Q 1 2005-Q 2 2005-Q 3 2005-Q 4 2006-Q 1 2006-Q 2 2006-Q 3 2006-Q 4 2007-Q 1 2007-Q 2 2007-Q 3 2007-Q 4 2008-Q 1 2008-Q 2 2008-Q 3 17,000 17,500 18,000 18,500 19,000 19,500 20,000 20,500 21,000 21,500 22,000 Real estate, renting and business activities - right axis
Financial intermediation - left axis
Source: Author’s estimates based on Eurostat’s LFS statistics.
The financial sector of developing countries seems to be less affected by the crisis; though in part this may be explained by a lag in the impact of the crisis on these countries. In many of the developing countries, financial markets are not yet as developed as those of other Western Countries. Financial institutions therefore have less or none of their holdings in failing US and UK banks and less probability of their assets being contaminated by the crisis. Large countries, such as China and India are likely to be less seriously affected because of this; their banking systems have held less of the bad assets from the US mortgage lending market, and they have large reserves of foreign currency.
However, restrictions on credit may prove to be the most immediate risk for developing countries. Small, highly-indebted countries with weak public finances, current account difficulties/deficits and exposed banks might be the ones to face the most risk. In addition, emerging economies will likely be affected by the limited availability of credit and lack of confidence in the financial sector. This is the case of Brazil, where the housing construction industry is suffering from the effects of the confidence and credit crisis and is continuing in a descending spiral this year.
1. Recent trends in the US and the UK
4Jobs in US financial services have been strongly affected by the economic slump
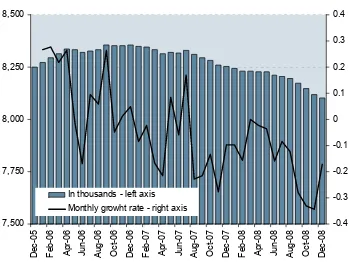
The financial sector was at the epicentre of the economic crisis that started in 2007 and, not surprisingly, layoffs in that sector accounted for a disproportionate share of initial job loses. Since the beginning of 2008, total employment in financial services has contracted by 148,000 to 8.1 million (1.8 per cent decrease), that is around 6 per cent of total non-farm employment (see figure 4). Net job losses in the sector also represent about 6 per cent of the net job losses in the non-farm economy as a whole. Interestingly, the process of downsizing in the sector coincided with the advent of the sub-prime crisis, in the second half of 2007. However, almost 74 per cent of the decrease in employment in the sector happened during the last six months of 2008. On
4
current trends, job losses are predicted to continue at least until the second quarter of 2009 (see below).
Figure 4. Evolution of employment in financial services*, January 2006 - December 2008 (In thousands) 7,500 7,750 8,000 8,250 8,500 De c -0 5 F e b-06 Ap r-0 6 Ju n -0 6 Au g -0 6 Oc t-0 6 De c -0 6 F e b-07 Ap r-0 7 Ju n -0 7 Au g -0 7 Oc t-0 7 De c -0 7 F e b-08 Ap r-0 8 Ju n -0 8 Au g -0 8 Oc t-0 8 De c -0 8 -0.4 -0.3 -0.2 -0.1 0 0.1 0.2 0.3 0.4
In thousands - left axis Monthly growht rate - right axis
Source: Author’s estimates based on the Establishment Survey Data of the US Bureau of Labor Statistics.
Note: *This is proxied by employment in the sector of Financial Activities, which in the US comprises two sub-sectors: (1) Finance and Insurance, and (2) Real estate, rental and leasing. The Finance and Insurance sub-sector includes (1) Monetary authorities and central bank, (2) Credit intermediation and related activities, (3) Securities, commodity, contracts and investments, (4) Insurance carriers and related activities, and (5) Funds, trusts and other financial vehicles. Data are seasonally adjusted.
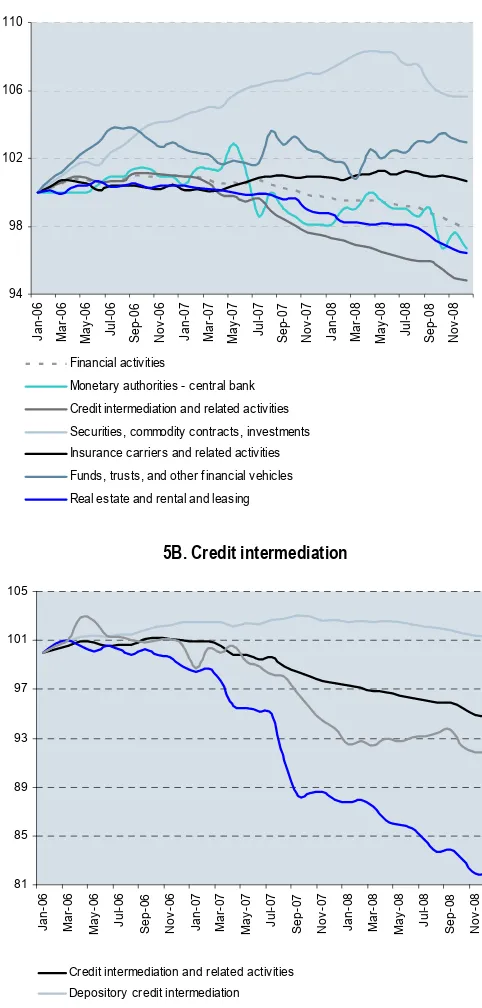
Credit intermediation, and Real estate, rental and leasing are the two main sub-sectors in terms of job losses in the sector of Financial activities in the US. Together, they made for 88 per cent of the total job losses recorded in the sector during the last year (see figure 5A):
• In 2008, employment in the credit intermediation sector fell by more than 78 thousand (3 per cent of total job losses and 53 per cent of job losses in the sector). Within this sub-sector, the biggest job losses were recorded in non depository credit intermediation, such as credit card issuing, sales financing, consumer lending and real estate credit. Other activities related to credit intermediation, such as mortgage and non mortgage loan brokers, financial transaction processing and clearing, also show important declines in employment. The substantial decrease in employment in these sub-sectors reflects the decline in credit activities by lending institutions and the need for these institutions to restore a fragile financial position. Moreover, it is noticeable that the steepest decrease in employment in these two sub-sectors occurred during 2007, before the rest of the US economy entered into recession.
Figure 5. Financial services employment by sub-sector, January 2006 - December 2008 (January 2006=100)
5A. Financial activities*
94 98 102 106 110 J an-06 M a r-0 6 Ma y -0 6 Ju l-0 6 S ep-06 No v -0 6 J an-07 M a r-0 7 Ma y -0 7 Ju l-0 7 S ep-07 No v -0 7 J an-08 M a r-0 8 Ma y -0 8 Ju l-0 8 S ep-08 No v -0 8 Financial activities
Monetary authorities - central bank Credit intermediation and related activities Securities, commodity contracts, investments Insurance carriers and related activities Funds, trusts, and other financial vehicles Real estate and rental and leasing
5B. Credit intermediation
81 85 89 93 97 101 105 Ja n -0 6 Ma r-0 6 Ma y -0 6 Ju l-0 6 Se p -0 6 No v -0 6 Ja n -0 7 Ma r-0 7 Ma y -0 7 Ju l-0 7 Se p -0 7 No v -0 7 Ja n -0 8 Ma r-0 8 Ma y -0 8 Ju l-0 8 Se p -0 8 No v -0 8
Credit intermediation and related activities Depository credit intermediation Nondepository credit intermediation (1)(3) Other activities related to credit intermediation (2)(3)
Source: Author’s estimates based on the Establishment Survey Data of the US Bureau of Labor Statistics. Notes: * The five categories: Monetary authorities and central bank; Credit intermediation and related activities; Securities, commodity, contracts and investments; Insurance carriers and related activities; and, Funds, trusts and other financial vehicles add up to for the sub-sector of Finance and Insurance. Real estate, rental and leasing constitutes the second sub-sector of the Financial Activities sector.
Average earnings in financial services have continued to grow, though more moderately than during the expansionary period…
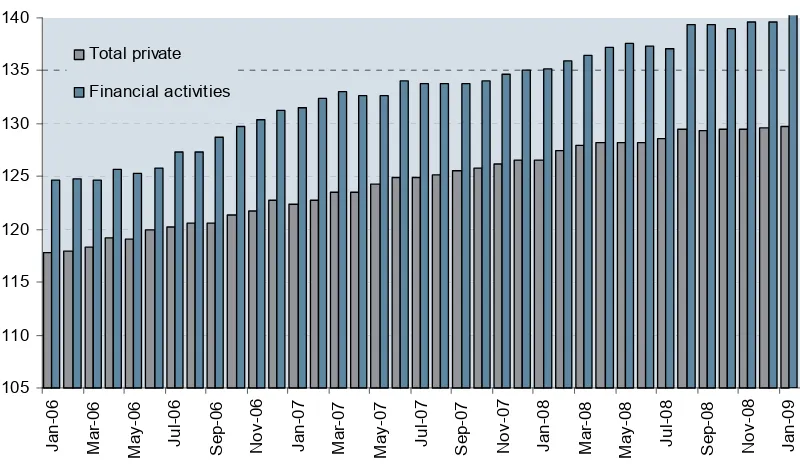
[image:15.595.96.496.297.532.2]Earnings in financial services continued to grow over the past 3 years. However, a deceleration can be discerned (see figure 6). In general, earnings in that sector have tended to exceed average earnings in the US economy. And, during most of the 2000s, earnings in financial services grew faster than for the average US worker; in 2000 average earnings in the sector were 23 per cent higher than for the average US worker, in 2007 financial sector’s earnings were 32 per cent higher. However the trend may have been reversed recently.5 Other studies also find these trends of high wages in finance unsustainable. Philippon and Reshef (2009) argue in their study that 30 per cent to 50 per cent of wage differentials observed during the last 10 years between the financial sector and the rest of the economy can be attributed to rents, and can be expected to disappear as happened before in the wake of the Depression.6
Figure 6. Average weekly earnings of production workers, January 2006 - January 2009 January 2000=100 105 110 115 120 125 130 135 140 J a n-06 Ma r-0 6 Ma y -0 6 Ju l-0 6 Se p -0 6 No v -0 6 J a n-07 Ma r-0 7 Ma y -0 7 Ju l-0 7 Se p -0 7 No v -0 7 J a n-08 Ma r-0 8 Ma y -0 8 Ju l-0 8 Se p -0 8 No v -0 8 J a n-09 Total private Financial activities
Source: Author’s estimates based on the Establishment Survey Data of the US Bureau of Labor Statistics.
Note: Data is seasonally adjusted.
There is also evidence that remuneration of executives grew faster than earnings for the average employee in financial services. An examination of executive pay in 2007 for the 15 largest companies in six selected countries shows that the highest-paid CEOs are in the US, where average pay exceeds US$ 10 million per year the wage of the average American worker. The real average pay of American CEOs, including share-based compensation, rose from over
5
Year to year, earnings of private sector workers followed a different path than earnings of workers in financial activities. Private workers have seen their earnings grow but at a decreasing monthly growth rate. During 2006, the average monthly growth rate was 0.4 per cent, while in 2007 the average fell to 0.3 per cent and to 0.2 per cent in 2008. Earnings for workers in financial activities, on the other hand, decreased in 2007 compared to 2006 (from an average monthly growth rate of 0.5 per cent to 0.2 per cent) but showed a slight recovery in 2008 (0.3 per cent per month in average).
6
US$ 16 million per year in 2003 to nearly US$ 24.5 million in 2007. This increase – nearly 10 per cent per year on average – far exceeded that of 2.5 per cent for other executives and 0.7 per cent for employees.
Including share-based compensation accentuates the gap between CEO compensation and average salaries. In fact, an analysis of the principal components of compensation reveals that, in 2007, variable compensation (share-based and variable in cash) constituted nearly 90 per cent or more of total compensation for CEOs and average executives in the US. Furthermore, share-based compensation was the dominant component of total compensation, constituting more than 60 per cent for CEOs and 50 per cent for average executives. Even though these numbers include all sectors of the economy, they are especially pertinent for analyzing the level of executive pay in the financial sector given that 40 per cent of the highest-paid CEO in the US works for financial and insurance institutions.
Employment in UK finance and business sectors has also been strongly affected by the crisis…
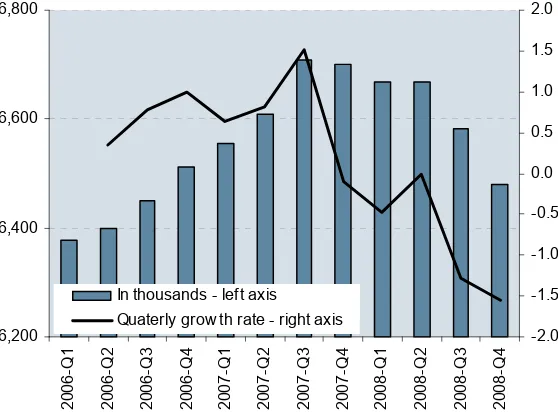
[image:16.595.161.440.433.639.2]Like in the US, employment in the finance and business sector in the UK dropped well before the start of the financial crisis, in the autumn of 2007 (see figure 7). Since the third quarter of 2007, employment in this sector has contracted by 227,000 (more than 80 per cent of the net job losses in the total economy) to less than 6.5 million (3.3 per cent decrease). More than 80 per cent of this decrease happened during the third and fourth quarter of 2008. The finance and business sector showed the largest quarterly employment decrease among all UK economic sectors.
Figure 7. Evolution of employment in the finance and business services sector*, 2006 Q1 – 2008 Q4 (In thousands) 6,200 6,400 6,600 6,800 2 006-Q 1 2 006-Q 2 2 006-Q 3 2 006-Q 4 2 007-Q 1 2 007-Q 2 2 007-Q 3 2 007-Q 4 2 008-Q 1 2 008-Q 2 2 008-Q 3 2 008-Q 4 -2.0 -1.5 -1.0 -0.5 0.0 0.5 1.0 1.5 2.0
In thousands - left axis Quaterly grow th rate - right axis
Source: Author’s estimates based on the Workforce Jobs statistics of the UK Office for National Statistics.
Note: Data is seasonally adjusted; Workforce Jobs statistics are the ONS preferred source of statistics on jobs by industry, since it provides a more reliable industry breakdown than the Labour Force Statistics (LFS).
… but the crisis has not had as yet a major effect on earnings
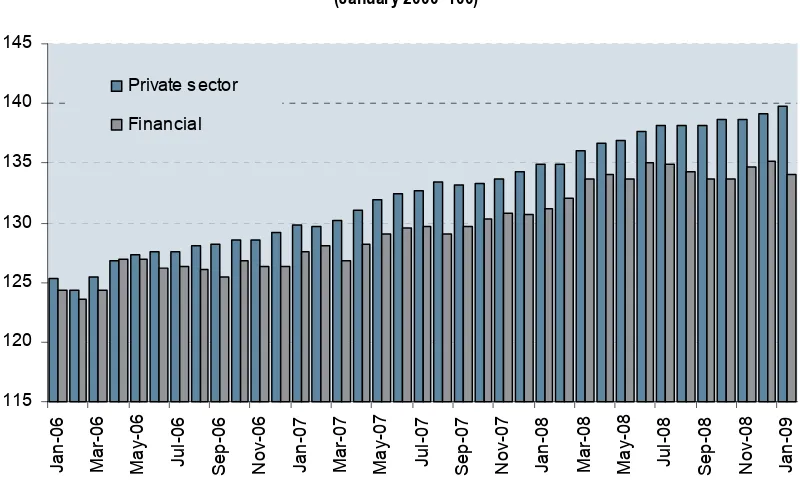
[image:17.595.96.496.190.433.2]As in the US, earnings of private sector workers in the UK are on the rise. Yet, contrary to what was observed in the US, private sector earnings have grown at a faster pace than earnings in financial and business sectors.7
Figure 8. Average weekly earnings of production workers, January 2006 - October 2008
(January 2000=100) 115 120 125 130 135 140 145 J a n-06 Ma r-0 6 Ma y-0 6 Ju l-0 6 S e p-06 Nov -06 J a n-07 Ma r-0 7 Ma y-0 7 Ju l-0 7 S e p-07 Nov -07 J a n-08 Ma r-0 8 Ma y-0 8 Ju l-0 8 S e p-08 Nov -08 J a n-09 Private sector Financial
Source: Author’s estimates based on the UK Office for National Statistics.
Note: Data is not seasonally adjusted. Data excludes bonuses.
In short, in both the UK and the US, the crisis has already provoked major job losses in the financial sector. This has therefore put a break on the long-term increase in employment in that sector (see Box 2). By contrast, the effect of the crisis on earnings has been relatively limited so far. The extent of these impacts will very much depend on the manner in which restructuring occurs during the time the crisis unfolds (e.g. young people being more affected that older/higher level position’s employees, will have a lesser impact on earnings and vice versa); and in the tightness of new regulatory measures on the sector. The amplitude of the negative impact the crisis is having on employment of the financial sector suggests that a redeployment of talents to other, more productive, sectors of the economy will be inevitable. According to some studies if history repeats, the financial sector will no longer be a monopole for the brightest and best workers8. This will be exacerbated by tight measures to regulate the sector that will tend to reduce the gap between remunerations in the sector and in the wider economy. This will affect not only people already employed in the sector but also new graduates or future new graduates.
7
The annual rate of growth in average earnings excluding bonuses was 3.8 per cent in the three months to December 2008, down by 0.1 percentage points from the three months to November. Average monthly growth rates of earnings during the last three years have remained relatively constant at 0.3 per cent for the private sector. Average monthly growth rates of earnings in the financial intermediation sector, on the other hand, have slightly decreased, from 0.23 per cent in 2007 to 0.18 per cent in 2008.
8
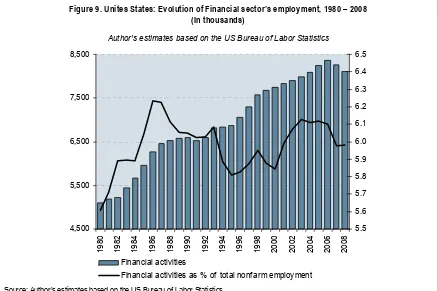
Box 2 – Financial sector employment: trends over the past 20 years9
In the US, employment in the financial sector has increased by nearly 60 per cent since 1980, employing 51 million in 1980 and 81 in 2008 (see figure 9). During the 1980s, financial services flourished, with an annual compound growth rate of 2.6 per cent. It was the era when large parts of the public became involved in the stock market, through mutual funds and 401k retirements plans. In the 1990s this upward trend shifted, making visible the effects of the banking crisis of 1988-1991. Following this crisis, more than 1,400 savings and loan institutions and 1,300 banks failed and cleaning up savings and loan institutions cost $180 billion, or 3 per cent of GDP. During this decade the sector grew at an annual compounded growth rate of 1.6 per cent. The sector’s employment picked up again in the late 1990s, following the increase in financial activities motivated by low interested rates, the increase in liquidity and the acceleration of the credit market especially for housing.
[image:18.595.81.519.231.522.2]Despite this fast employment growth in the financial services industry, however, the share of the sector in total employment has not increased and remained continuously at or slightly below 6 per cent of total non-farm employment (see figure 9).
Figure 9. Unites States: Evolution of Financial sector’s employment, 1980 – 2008 (In thousands)
Author’s estimates based on the US Bureau of Labor Statistics
4,500 5,500 6,500 7,500 8,500
1980 1982 1984 1986 1988 1990 1992 1994 1996 1998 2000 2002 2004 2006 2008
5.5 5.6 5.7 5.8 5.9 6.0 6.1 6.2 6.3 6.4 6.5
Financial activities
Financial activities as % of total nonfarm employment
Source: Author’s estimates based on the US Bureau of Labor Statistics.
9
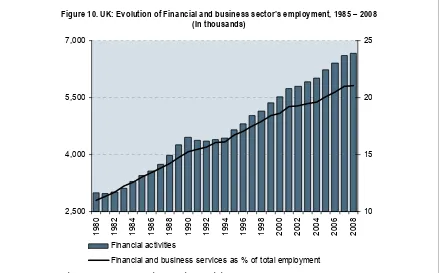
In the UK, the financial and business sector’s employment has more than doubled during the last 20 years (see figure 10). Employing almost 3 million in 1980 it employed 6.7 million in 2008. During this period, the sector’s employment has grown nearly 123 per cent. As in the case of the US the early 1990s were the years of depression of employment in financial activities, due to several banking failures that occurred in this period.10 The annual compounded growth rate fell from 4.1 per cent during the 80s to 2.1 per cent during the 90s. The contribution of the sector’s employment to total employment in the UK has increased steadily since 1980 (see figure 10). The sector has gained in importance from 11 per cent to 21 per cent of total employment.11
Figure 10. UK: Evolution of Financial and business sector’s employment, 1985 – 2008 (In thousands)
2,500 4,000 5,500 7,000
1980 1982 1984 1986 1988 1990 1992 1994 1996 1998 2000 2002 2004 2006 2008
10 15 20 25
Financial activities
Financial and business services as % of total employment
Source: Author’s estimates based on the UK Office for National Statistics.
2. Job prospects for 2009-2010: possible scenarios
Previous financial crises have caused substantial adverse labour market consequences with particularly long-lasting effects, sometimes reversed only several years after the end of the crisis. Indeed, the negative employment effects of the crisis tend to persist well after the start of the economic recovery. A recent study on the history of banking crises by Reinhart and Rogoff (2008)12 shows that, on average, a crisis is associated with a 7 percentage point increase in the unemployment rate. Moreover, it takes on average 4.8 years to return to the pre-crisis unemployment level. The fall in output, on the other hand, is sharper, yet the duration of the downturn is considerably shorter than for unemployment. In other words, the labour market
10
Notable bank failures included Johnson Matthey (1984), Bank of Credit and Commerce International (1991), and Barings (1995).
11
Please note that in the UK the sector includes financial and business activities, which explains the large size of the sector.
12
recession associated with a banking crisis tends to be more pervasive and longer-lasting than the economic recession.
There is no reason to expect that this financial crisis will be different from earlier ones. As shown in the Annex, the negative effects of the present financial crisis on the US and UK labour markets are already visible and appeared soon after the credit crunch. In order to gauge the possible employment consequences of the crisis for the financial sector, two scenarios are presented in this section. These scenarios draw on output-employment elasticities13, which have been estimated by way of an econometric analysis of the employment impact of past financial crises, carried out for the purpose of this paper (see Annex 1 for details of the empirical analysis in question). The scenarios also build on growth projections from the IMF and Deutsche Bank.14 The outcomes of this analysis are presented in Figures 11 and 12. The main result which emerges is that many of the employment losses recorded in the sector are likely to persist. In addition, the next two years are likely to witness considerable employment shifts within the sector –with some sub-sectors strongly affected while others are in a position of creating new jobs –or to other sectors, as discussed before. Both results are relevant for policy, as will be seen in Part B. More details on the scenarios are as follows:
• Figure 11 shows projections for employment in the financial sector in the US. Scenario 1 is based on the IMF projections for US economic output. According to these projections, the downward trend in employment in the financial sector recorded since 2007 will continue but will moderate in 2009-2010. A small decrease in employment of 0.2 and 0.06 per cent for the two years, respectively, would contribute to a loss of 17.8 thousand jobs in 2009 and another 5 thousand jobs in 2010. The total loss in employment will be nearly 23 thousand jobs. Projections for the sub-sectors of Finance and insurance and Real estate, rental and leasing are somewhat more encouraging. According to this scenario, the finance and insurance sub-sector would experience an additional year of job loses in 2009 (30 thousand) though it would recover nearly 22.5 thousand jobs in 2010 (annual growth rates of -0.5 and 0.4 per cent in 2009 and 2010, respectively). Employment in the sub-sector of Real estate, rental and leasing, on the other hand, would experience an almost negligible recovery in 2009 before stagnating in 2010. Overall, employment in this sub-sector would fall by nearly 8 thousand jobs during this period.
• Scenario 2, based on the Deutsche Bank’s projections for the US economy, depicts a bleaker picture than the one portrayed by the IMF projections. Scenario 2 is also consistent with the long lag in the recovery of employment typically associated with financial crises. It suggests that employment in financial activities would continue to fall during 2009 and 2010, adding nearly 88 thousand job losses to the 148 thousand already recorded since the beginning of employment losses in the sector in 2007. Employment in Finance and insurance would also follow a downward trend in 2009, while a modest upturn would happen in 2010. Finally, employment losses in Real estate, rental and leasing would accelerate during the projection period. While in 2009, 6.7 thousand jobs would be lost, the figure would be 20.2 thousand in 2010.
• The scenarios suggest that finance and business sector’s employment in the UK would continue to suffer from the consequences of the crisis during 2009 and 2010 (see figure 12); yet the magnitude will be deeper than in the US. This may reflect the fact that, like other European countries, the UK started to feel the effects of the crisis with a delay vis-à-vis the US. According to the first scenario, employment in the sector would decrease by 1 and 1.5 per cent, respectively, in 2009 and 2010. The loss in employment according to
13
The elasticities found from the empirical analysis are: 1) Finance, insurance, real estate and business services: 1=0.56 and t0=0.52; 2) Financial intermediation: 1=0.24 and t0=0.48; 3) Real estate, renting and business services: t-1=0.74 and t0=0.51.
14
these projections will total 167 thousand during the two years (71 thousand in 2009 and 96 thousand in 2010). According to the second scenario, finance and business sector’s employment would decrease by more than 57 thousand jobs in 2009 and an additional 71.7 thousand jobs in 2010. In total, 129 thousand jobs will be lost by the end of 2010, according to these projections. Contrary to the forecasts for US employment, the IMF scenario shows a more hostile picture than the one depicted by the Deutsche Bank’s projections.
Figure 11. United States: Financial sector’s employment projections, 2000 – 2010 (In thousands)
11A. Financial activities
Projections
7,600 7,800 8,000 8,200 8,400
2000 2001 2002 2003 2004 2005 2006 2007 2008 2009 2010 Scenario 1*
Scenario 2**
11B. Finance and insurance
Projections
5,600 5,800 6,000 6,200
2000 2001 2002 2003 2004 2005 2006 2007 2008 2009 2010 Scenario 1*
11C. Real estate and rental and leasing
Projections
2,000 2,050 2,100 2,150 2,200
2000 2001 2002 2003 2004 2005 2006 2007 2008 2009 2010 Scenario 1*
Scenario 2**
Source: Author’s estimates based on the US Bureau of Labor Statistics; and EU KLEMS database.
[image:22.595.166.433.401.598.2]Notes: * Based on the IMF Economic Outlook Projections; ** Based on the Deutsche Bank Projections.
Figure 12. United Kingdom: Finance and Business sector’s employment projections, 2000 – 2010 (In thousands)
Projections
5,500 5,800 6,100 6,400 6,700
2000 2001 2002 2003 2004 2005 2006 2007 2008 2009 2010 Scenario 1*
Scenario 2**
Source: Author’s estimates based on the UK Office for National Statistics; and EU KLEMS database.
Notes: * Based on the IMF Economic Outlook Projections; ** Based on the Deutsche Bank Projections.
has been accentuated by the crisis, which has affected the sector’s employment most likely in a permanent way. This is more evident in the US than in the UK, which might be explained by the fact that in the UK the effects of the crisis were apparent later than in the US. In the case of the US, the sharp fall in the share of financial employment in total employment occurred during 2006 and 2007. Within the sector of Financial activities, the plunge in the relative share in total employment was stronger in the sub-sector of Real estate, rental and leasing than in Finance and insurance.
Figure 13. Total employment projections, US and UK, 2000 – 2010 (In thousands)
13A. US
Projections
129,000 131,000 133,000 135,000 137,000 139,000
2000 2001 2002 2003 2004 2005 2006 2007 2008 2009 2010 Scenario 1*
Scenario 2**
13B. United Kingdom
Projections
29,000 30,000 31,000 32,000
2000 2001 2002 2003 2004 2005 2006 2007 2008 2009 2010 Scenario 1*
Scenario 2**
Source: Author’s estimates based on the US Bureau of Labor Statistics; UK Office for National Statistics; and EU KLEMS database.
Figure 14. Share of employment in financial activities in the evolution of total employment, US and UK
14A. United States* (Per cent)
6.2 6.3 6.5 6.6
2
000 2001 2002 2003 2004 0052 2006 2007 2008 2009 2010
Financial activities
4.4 4.5 4.6 4.7 4.8
20
00
20
01
20
02
20
03
20
04
20
05
20
06
20
07
20
08
20
09
20
10
1.54 1.56 1.58 1.60 1.62
Finance and insurance Real estate, rental and leasing
14B. United Kingdom** (Per cent)
22 23 24 25 26 27
2000 2001 2002 2003 2004 2005 2006 2007 2008 2009 2010
Part II. Possible policy responses
As documented in the previous Part, the crisis has led to significant job losses with prospects for further losses in the financial sector. From a policy perspective, the sector faces four challenges: one global and three sector-specific. The global challenge concerns the worsening global economic conditions. The largest developed countries have entered a deep recession and the situation continues to deteriorate as the crisis spreads from financial markets to the real economy and from developed countries to the rest of the countries. Reactivating the financial sector under these circumstances represents the first major challenge for the sector.
The three remaining challenges are specific to the sector and are mutually-reinforcing: ii) a permanent decline in overall activity and employment after years of expansion; iii) stagnation and even deceleration in income growth; and iv) restructuring within the financial sector as a large number of financial institutions, including important parts of the industry, have disappeared due to mergers and acquisitions.15 More fundamentally, the crisis has hit the sector unevenly, affecting employment in some activities more than in others. In particular, employment in investment banking has shrunk strongly, while traditional depositary and credit bank activities’ employment has only slightly decreased and employment in funds and trusts has continued to grow. It is likely that further labour reallocation among financial sub-sectors will occur in the near future.
Two different scenarios are presented in the empirical section: one showing a more positive picture regarding employment in the sector for the two coming years and the other a more worrying one. However, both scenarios coincide on the slump in employment that is expected to take place over the next years. How long these pernicious effects will last is difficult to predict with certitude. But whether employment in the sector approaches the more positive or negative scenario will depend heavily on the timing and type of policies that governments put in place to mitigate the effects of the crisis.
The policy recommendations that follow aim at preparing the ground for a faster recovery of the sector, trying to reduce the depression time and bringing the financial sector to a positive scenario of employment growth. Three sets of policies are recommended: i) adopting a comprehensive strategy that responds to the consequences of the crisis in the overall economy; ii) undertaking measures that address the social effects of the crisis and accompany financial workers during the period of economic depression; and iii) tackling the fundamental problems of the financial sector through policies that attenuate the risk that similar crises will develop again in the future.
1. Adopting a comprehensive strategy to respond to the crisis
To a large extent, the outlook for the financial sector depends on the overall policy strategy adopted to respond to the crisis. The world economy is being affected by a vicious cycle of rapidly declining confidence, leading to lower demand, output and employment, which are further depressing confidence. These overall consequences of the crisis have been fostered by a troubled financial sector but are at the same time further reinforcing the sector’s downward trend. In addition, the current financial crisis has now become global and therefore requires a global policy approach. Bail-out plans of the financial sector, crucial as they are, are not enough.
15
What is needed is a global, coordinated stimulus package that breaks this vicious cycle and responds to the current juncture of shrinking output, failing capital markets, drying-up of credit, massive job losses and growing poverty.16
Such a policy package would be based on the following broad principles:
• An immediate policy objective is to stabilize the financial sector and restore confidence in capital markets.
• In addition, a macroeconomic stimulus is needed to boost domestic demand, thus supporting the economy and job creation.
• Moreover, to mitigate the adverse effects of the crisis on disposable incomes and income inequality, social welfare systems need to be strengthened and workers’ rights protected. Experience shows that social dialogue, as part of the Decent Work Agenda, can be instrumental in designing an effective package of measures.
• Finally, the massive hit of the crisis for the financial sector needs to be addressed by social policies that compensate the pervasive consequences on employment and wages and help those who lost their jobs in the sector to return quickly to employment.
These measures are instrumental to stabilise the economy and thereby help improve the outlook for overall employment as well as for the financial sector. In addition, specific policies targeted towards stabilising prospects and maintaining employment are necessary as the sector undergoes a period of major restructuring.
Nevertheless, complexity remains in terms of how to implement a global stimulus package without limiting the capacity of the financial sector to overcome the crisis and keep supporting growth. Longer-term policies that address the origins of the crisis, such as dealing with the economy’s structural problems, are crucial to bring the economy to a more stable track. It is necessary as well to tackle inappropriate financial regulation in order to pave the way for a better functioning of the financial sector. Setting the right incentives is fundamental for preventing excessively risky decisions and financial products with pervasive systemic consequences for the economy. However, simply chocking off the sector to avoid any risk taking will not be beneficial for the economy and for employment. Additional policies that support the financial sector during the transition period are fundamental in order to maintain the incentives that keep the financial sector running.
The following looks more closely into policies to tackle the economic and social consequences for the financial sector per se.
2. Helping workers cope with the crisis in the financial sector
The second set of policies must mitigate more directly the labour and social consequences of the crisis in the financial sector, namely the job losses, reduction of disposable income and redeployment of labour within the sector. To do so, support measures are needed that accompany the financial sector workers through the crisis period, assisting them in finding new jobs, adapting their skills or even embarking on new career prospects.
It is therefore important to adopt measures that: i) provide adequate, well-designed unemployment benefits and social protection. Honouring existing commitments made vis-à-vis workers is especially crucial for those financial enterprises that are forced to leave the market (there are cases where employees have to opt for legal actions to protect their rights at work). ii)
16
support job-search and placement into new jobs, which may sometimes necessitate skill development measures – all the more important, because, as noted earlier, the sector is likely to face a permanent cut in employment and many job losers need to obtain jobs in other sectors; and iii) strengthen social dialogue within financial institutions to mitigate the adverse social effects of the crisis and pave the way for a healthier sector.
Access to adequate, well-designed unemployment benefits and social protection
Policies are needed to make sure that workers in the financial sector laid off in the course of the crisis are properly protected against substantial losses of disposable income. In particular lower ranking employees in the sector are unlikely to receive generous severance payments, so they have to rely on unemployment benefits. As the crisis unfolds, it is suggested that policy makers ensure that financial-sector employees continue to be appropriately covered in their return to a new job. In some countries, policies have been put in place to extend the maximum length of unemployment benefit duration. For example, in Vietnam, the government will launch this year a new unemployment insurance policy, under which the monthly subsidy can be up to 60 per cent of the person's previous salary. The policy is aimed at supporting the unemployed but also at contributing to the redeployment of labour17. The US government also made public a new social plan aiming at extending unemployment benefits and health insurance and increasing social security benefits for those who lost their jobs.
Even those employees that can count on contractual guarantees for severance payments – often highly-skilled specialists – are put at risk as the crisis brings down entire financial institutions. Ensuring that contractual commitments are respected and eventually guaranteeing earlier promises to these employees is another effective measure that governments could put in place in order to make sure that workers get adequate protection.
In addition, it is suggested that governments ensure that financial sector employees continue to benefit from relevant social services such as health insurance. Currently, in some countries like the US, health-care insurance is tightly linked to the job. There is therefore a risk of a further rise in the incidence of workers without proper health coverage. This will be a particular risk for those laid off in the financial sector that are likely to face a higher risk of job loss and a longer average duration of unemployment spells. Some countries are already studying measures that go in this direction. In Thailand, for example, the Social Security Office is looking at expanding the health care network to cover more people, including the family members of private firm employees who are members of the social security fund. Besides expanding the security net, this measure would address the problem of a drastic reduction in contributions to the fund due to the rising number of jobless people18.
Unemployment benefits, social protection and employment protection are also embedded in ILO conventions that many member states have ratified. It is especially important to apply these conventions in the current context. Indeed this will reinforce automatic stabilisers, thereby supporting economic recovery.
Activation policies and effective public employment services
Effective activation policies could play a crucial role in promoting the re-employment prospects of job losers from the financial sector. Main elements of these programmes include employment services (such as job matching, career guidance and job-search support; adequate
17
Xinhua News Agency, “Vietnam to launch unemployment insurance next year”, 19 February, 2008.
18
management of unemployment benefits; and the referral of jobseekers to reintegration programmes after a period of unsuccessful job search). In certain cases, employment programmes like direct job creation or subsidised jobs can also play a useful role – especially in avoiding demotivation among job seekers. These programmes, if well designed, have proven to be very beneficial, helping cushion economic shocks without jeopardizing growth when the upswing sets in. For example, universal social policies such as those used by Nordic countries (e.g. Denmark, Sweden) have managed to support economic development by maintaining high employment and strong labour force participation while at the same time leading to favourable social outcomes (see World of Work Report 200819, Chapter 6).
Importantly, there is a strong case for designing specific training programmes for job losers from the financial sector. As already noted, many of these job losers will have to find a job outside the sector, which may require acquiring new skills. Some countries are already taking these initiatives to address the damaging effects of the current crisis. The UK put in place subsidies (of up to £2,500) for employers who hire workers who have been unemployed for more than 6 months. Spain as well established this kind of subsidy (of up to €1,500 per job subsidy) for companies that hire unemployed workers having families to support.
There is no consensus yet as to whether government support specifically to the financial sector should be made conditional on job guarantees. This is a complex issue, which requires further scrutiny and should probably be addressed by taking into account national institutions and practices. However, in reflecting on the various policy options involved, it is important to keep in mind available evidence on whether it is easier for workers to move to new jobs before losing their current position. This suggests that supporting some of the existing jobs, at least for a limited period of time, may be an effective policy. This of course needs to be coordinated with the policy approach adopted for other sectors – where many workers are also becoming victims of the crisis and are losing their jobs. During the current crisis, some countries have opted for policies trying to prevent job losses, even though not based on conditionality. Korea, for example, opted for tax exemptions and an extension on tax submission periods for employers that maintain their workforce; and Mexico is giving subsidies (of up to 2 million pesos) to companies facing production cuts and layoffs. However, it is difficult to analyse the effectiveness of these policies in addressing the challenges of the financial sector given that they deal with the wider economy.
Encouraging social dialogue would help manage the effects of the crisis…
Social dialogue is instrumental to balance conflicting interests and generate consensus in crisis policy responses. The financial sector is in a position where these kinds of decisions are taken on an every day basis. Workers may be willing to accept the inevitability of downsizing and restructuring, and even layoffs. But workers also call for management to inform and consult their staff or their representatives before drastic decisions are taken. Moreover, social dialogue is a powerful tool to enhance greater transparency in reporting and decision making. Moreover, social dialogue can help design training and other programmes that support job losers and facilitate later recovery of the sector.
Many countries have used crises as opportunities to improve social dialogue, which in return contributed to solutions to resolve the crisis. In Korea, for example, the government engaged in social dialogue in an effort to stabilize industrial relations amidst the economic turmoil of the late 1997. A Tripartite Commission20 was launched as the legal institution of social dialogue. The Commission urged the major actors of the crisis to improve the effectiveness and accountability of corporate governance and introduce greater transparency of their management
19
INST (2008b)
20
and accounts. The Tripartite Commission is considered to have had an instrumental role in achieving agreement between the social partners and the government on the response to the crisis (OECD, 2000). Another example is Argentina, where social dialogue helped the 2003 government successfully overcome the crisis, by building consensus on priorities in employment and labour policy (Novick et al. 2007). The initiative included labour, business, NGOs, the newly poor, social movements, and political and religious groups. It allowed the government to maintain control over the crisis situation, while fostering a strategy of social inclusion and eventual expansion of social welfare programs21.
Avoiding counterproductive solutions: early retirement and outsourcing
In times of crisis, firms may choose job redundancies as a measure to contain costs in to allow them to stay in the market. Several alternatives (such as early retirement, outsourcing, flexible staffing and work methods, etc.) exist to outright lay-offs with more or less adverse consequences for the long-term performance of the labour market. In particular, early retirement programmes that have been widespread in the past proved to be damaging for both fiscal sustainability and employment prospects among older workers. Evidence suggests that gradual retirement policies and measures that help workers acquire a new career are to be preferred in this respect as they help employees to keep in touch with the labour market. Of course, governments may need to ensure that such measures do not substantially damage the capacity for these employees to find a more stable form of employment.
During the Asian crisis in Thailand, for example, KTB Securities Company initially retained all staff, including those from the acquired banks, but eventually restructured its combined operation, introducing incentives to encourage early retirement which resulted in the departure of 2,372 employees at the expense of tax payers and with long-term adverse consequences for the labour market. Spain gives another example of the dangers of forced early retirement. According to the financial sector trade union, jobs in the banking sector declined from 180,000 to 129,000 between 1980 and December 1999, mainly due to merger-linked forced early retirements, sometimes thinly disguised as voluntary22.
Under these circumstances, it is recommended that policy measures be put in place to make sure that banks and financial institutions are bearing the full costs of their activities and are not allowed to carry over more burden to tax payers. In particular, measures that cause long-term damage to the proper functioning of the labour market – such as forced early retirement – should be avoided.
3. Policies for a more effective financial sector at the service of the real
economy
Challenges also lie ahead for those employees who continue to work in the financial services industry. In addition to major restructuring efforts in the sector, there is a need for policies which encourage existing banks and financial institutions to concentrate on their core business and which give incentives to cut down on excessive risk taking decisions and activities. This calls for a new corporate governance of the banking sector, including a fresh look at remuneration packages of executive and trading staff. During the restructuring phase, in particular, compensation packages and earnings growth of these employees would need to better reflect their ability to fulfil the lending role of the institutions that employ them.
21
For more detail on these specific country policies, please see Discussion Paper No. (Megan and Naren)
22
Rationalizing executive pay and dividend policies
Rewarding risk-taking rather than sustainable growth in economic value is considered one of the factors behind the financial crisis. Indeed the reward system for executives and bank managers needs to be adapted to prevent excessive risk taking23. The existing remuneration model leads to misallocation of risk and places burden on those least capable of taking large gambles.
In defining good executive compensation, experts recommend that rewards must depend on high performance attained through the right mix between risk taking and risk management. As part of this approach, individual incentives would be realigned with the long-term performance of the bank. In this respect, some have argued that such a realignment of incentives would require abolishing shareholder value as an indicator of success for the compensation schemes of managers. Some countries like the UK have moved in this direction by requiring that capital injections come with restrictions on executive pay and dividend policies. This could be used as a possible reform avenue in other countries.
Another policy recommendation is to redirect executive payments away from short-term cash toward longer-term payments.24 Withholding a portion of a year’s compensation depending on performance goals would allow reimbursements to be controlled in case of adverse events. Such reform would also encourage a focus on creating real economic value and discourage short-termism. In addition, for the specific case of traders, this model will make it more difficult to leave after bonus season. An example of such program is the “bonus-malus” system adopted by UBS last year as a part of its new compensation model. According to this model, executive board members whose bonuses had depended on annual performance alone will now be paid according to the new system that tracks their performance and the bank’s share price over a three-year period. In addition, so-called variable compensation will no longer be available for the chairman of the bank.25
A mixture of these suggestions is what has been proposed in the US as part of the stimulus package to address the effects of the financial crisis. The provision would set a 500 thousand dollar limit on executive pay at US financial institutions that have received financial bailout funds. However, conditionalities would go beyond this cap on compensation by restricting bonuses for senior executives and the top-compensated employees in financial institutions that receive more than 500 million dollars from the Treasury Department’s TARP (Troubled Asset Relief Program). Limits on bonuses and other incentive pay at companies would be set on a sliding scale according to how much federal aid they receive. In addition, any bonuses would have to be in the form of long-term incentives, like restricted stock, which could not be cashed out until the TARP money was repaid in full.
On April 2, 2009 the G20 countries agreed on the implementation of a series of new principles on executive compensation, the so called FSF’s (Financial Stability Forum) Principles for Sound Compensation Practices. The FSF Principles for Sound Compensation Practices aim to ensure “effective governance of compensation, alignment of compensation with prudent risk taking and effective supervisory oversight and stakeholder engagement in compensation.”26
23
See Ebert, Papadakis and Torres (2008) for a more detailed analysis of executive pay.
24
Ben W. Heineman Jr. (2009)
25
Forbes, “UBS Goes Long Term On Bonuses”, November 17, 2008.
26
Employee involvement in corporate governance
Multi stakeholder27 coordination in financial institutions may be improved to ensure better coordination and implementation of agreed international corporate governance standards. Remuneration and incentive systems are supposed to align the interests of corporate officials with the long-term interest of the company and shareholders. In this regard, developments in corporate governance mechanisms have led to an increasing use of performance-related pay systems for executive managers and directors. Nevertheless, empirical studies show that such systems have only a very moderate effect, if any, on the performance of financial institutions. Moreover, wide variations exist, with some countries displaying virtually no relation between performance-related pay and company profits. On the contrary, evidence suggests that managers are in a dominant wage-bargaining position with respect to company owners, partly as a result of institutional flaws. Distortions in these structures are dangerous since they may lead to a short-term bias towards additional risk-taking, a particular concern for the financial industry. In this regard, employee involvement in corporate governance may contribute to realigning the interests of the different stakeholders. In this sense, policy makers may want to consider policies aimed at strengthening the role of the supervisory board and allowing other stakeholders to participate, since this may counterbalance managerial power and may limit excessive risk-taking. This measure is especially pertinent in the financial sector, given the problems discussed above regarding excessive management compensation in the sector.
Concluding Remarks
The financial sector is facing a deep and most likely permanent restructuring process, which started even before the onset of the financial crisis. In addition, the crisis has hit the sector unevenly, which may result in labour movements among financial sub-sectors. It is also likely that the sector as a whole will lose jobs on a permanent basis.
The restructuring process will have a substantial impact on both employment levels and earnings. In fact, the sector is already experiencing a major cut in overall activity after years of expansion, which is triggering significant job losses. The incidence of job losses in this sector is much larger than is the case for the economy as a whole. And earnings are stagnating or even falling in certain cases.
Measures to help workers cope with the crisis in the sector would serve social and economic goals. These include adequate, well-designed unemployment benefits and social protection, activation policies and effective public employment services. Such policies would not only support incomes of affected workers, but would also facilitate transitions to new jobs and reduce the risk of long-term unemployment and inactivity. There is also a strong case for launching re-training programmes targeted on the workers of the financial sector, given the likely permanent cut in total employment in the sector.
The paper also considers measures that help moving towards a more effective financial sector, focusing on the needs of the real economy. One of the suggested options is to build incentives that move the sector to less risky activities through a new corporate governance structure. This includes in particular rationalizing executive pay and dividend policies.
27
Bibliography
Deutsche Bank. 2008a. “The End of Recession and the Limits to Fiscal Policy,” Global Economic Perspectives, December 17, 2008.
Deutsche Bank. 2008b. “Searching for a New Source of Global Demand Growth,” World Outlook, December 5, 2008.
Ebert, F.C; Papadakis, K.; Torres, R. 2008. “Executive compensation: Trends and policy issues”, Discussion Paper No. 190 (International Institute for Labour Studies, Geneva).
Financial Stability Forum. 2009. FSF Principles for Sound Compensation Practices. Available at:
http://www.fsforum.org/publications/r_0904b.pdf
Heineman, B.W. 2009. “Principles for Reforming Executive Pay”, Business Week, Viewpoint, January 6, 2009.
International Institute for Labour Studies. 2008a. Policy Brief: A global policy package to address the global crisis. ILO, Geneva.
International Institute for Labour Studies. 2008b. World of Work Report 2008: Income Inequalities in the Age of Financial Globalization. ILO, Geneva.
International Labour Office. 2001. The employment impact of mergers and acquisitions in the banking and financial services sector, Report for discussion at the Tripartite Meeting on the Employment Impact of Mergers and Acquisitions in the Banking and Financial Services Sector. ILO, Geneva, February 2001.
International Monetary Fund. 2009. “World Economic Outlook: Update”, An update of key WEO projections. IMF, January 28, 2009.
Laeven, L.; Valencia, F. 2008. “Systemic Banking Crises: A New Database”, IMF Working Paper, No. 08/224 (Washington, DC).
Novick, Marta; Tomada, Carlos; Damill, Mario; Frenkel, Roberto; and Maurizio, Roxana. 2007. “In the wake of the crisis: Argentina’s new economic and labour policy directions and their impact”, IILS Research Series 114.
OECD Economic Outlook. 2008. Preliminary Edition, No. 84, November 2008. OECD. 2000. Pushing Ahead with Reform in Korea. Paris.
Quiggin, J. 2008. “Risk Shifs in Australia: Implications of the Financial Crisis”, University of Queensland, Australia.
Philippon, T.; Reshef, A. 2009. “Wages and Human Capital in the U.S. Financial Industry: 1909-2006”, NBER Working Paper No. 14644.
Reinhart, C. and Rogoff , K. 2008. “Banking Crises: An Equal Opportunity Menace”, NBER Working Paper No. 14587.
Reinhart, C. and Rogoff , K. 2009. “The Aftermath of Financial Crises”, paper presented at the American Economic Association Meeting in San Francisco, January 3, 2009.
Annex 1 – Evolution of total employment: United States and
United Kingdom
UNITED STATES
Employment in the US has declined sharply and the number of job losers is on the rise…
As the real economy entered a major recession, the adverse impact on employment in the US continued to worsen. The negative employment trend that started in Dec-2007/Jan-2008 with the onset of the recession has even accelerated during the past four months and there is no sign of a reversal in the months ahead (see figure A1).
The latest information on non-farm employment shows a sharp decline of more than 500,000 in December and an increase in the unemployment rate from 6.8 to 7.2 per cent, the highest level since 1992 (see figure A2). Since the start of the recession in December 2007, non-farm employment has fallen by 2.6 million or almost 2 per cent. Of this reduction, 75 per cent (1.9 million) occurred only during the last 4 months.
The number of unemployed persons increased by 632,000 to 11.1 million in December 2008. During the last year, the number of employed has grown by 3.6 million and the unemployment rate has risen by 2.3 percentage points. Among the unemployed, the number of job losers and persons who completed temporary jobs increased by 2.7 million.
Effects of the crisis on the labour force participation rate has become visible, but is not yet substantial. The labour force participation rate in December 2008 (65.7 per cent) fell by 0.3 percentage points since the beginning of the recession one year ago and by 0.1 percentage points compared to the previous month. The increase in the amount of discouraged workers28, on the other hand, has been more noticeable. In December, there were 642,000 discouraged workers, up by 279,000 from a year earlier.
28
Figure A1. Evolution of Total nonfarm employment, January 2006 - December 2008 (In thousands) 133,000 134,000 135,000 136,000 137,000 138,000 139,000 Fe b -0 6 A p r-0 6 Ju n -0 6 Au g -0 6 Oc t-0 6 De c -0 6 Fe b -0 7 A p r-0 7 Ju n -0 7 Au g -0 7 Oc t-0 7 De c -0 7 Fe b -0 8 A p r-0 8 Ju n -0 8 Au g -0 8 Oc t-0 8 De c -0 8 -0.50 -0.40 -0.30 -0.20 -0.10 0.00 0.10 0.20 0.30
In thoussands - left axis Monthly growht rate - right axis
Source: Author’s estimates based on the Establishment Survey Data of the US Bureau of Labor Statistics. Note: Data is seasonally adjusted
Figure A2. Evolution of the unemployment rate, January 2006 - December 2008 (Per cent) 4.0 4.5 5.0 5.5 6.0 6.5 7.0 7.5 De c -0 5 F eb-06 A p r-0 6 J un-06 A ug-06 Oc t-0 6 De c -0 6 F eb-07 A p r-0 7 J un-07 A ug-07 Oc t-0 7 De c -0 7 F eb-08 A p r-0 8 J un-08 A ug-08 Oc t-0 8 De c -0 8
Source: Author’s estimates based on the Labor Force Statistics from the Current Population Survey of the US Bureau of Labor Statistics.
[image:35.595.157.436.430.631.2]UNITED KINGDOM
Employment in the UK is also on the fall …
[image:36.595.154.443.277.501.2]In the UK, another country hard-hit by the financial crisis, the effects brought severe hardship on the real economy and the consequences are envisaged to be long-lasting. The impact on total employment, however, started to be evident only since the second half of 2008 (see figure A3). Total employment fell by 284,000 or 0.9 per cent to 31.3 million during the last year. The sharp decline occurred during the third and fourth quarters of 2008 when employment decreased by 343,000 or 1.1 per cent. These two are the largest quarterly falls since the end of 1992.
Figure A3. Evolution of total employment, 2006 Q1 – 2008 Q4 (In thousands)
31,000 31,100 31,200 31,300 31,400 31,500 31,600 31,700
2006-Q
1
2006-Q
2
2006-Q
3
2006-Q
4
2007-Q
1
2007-Q
2
2007-Q
3
2007-Q
4
2008-Q
1
2008-Q
2
2008-Q
3
2008-Q
4 -0.8
-0.6 -0.4 -0.2 0 0.2 0.4 0.6
In thousands - left axis
Quaterly grow th rate - right axis
Source: Author’s estimates based on the Workforce Jobs statistics of the UK Office for National Statistics.
Note: Data is seasonally adjusted; Workforce Jobs statistics are the ONS preferred source of statistics on jobs by industry, since it provides a more reliable industry breakdown than the Labour Force Statistics (LFS).
The number of unemployed people, the unemployment rate and the claimant count have all increased…
The unemployment rate increased by 0.2 percentage points to 6.5 per cent during the last month for which information is available (Dec-2008). Compared to the previous year, unemployment increased by 1.3 points, adding 421,000 people to dole queues and returning the country to a position not seen since the 1990s when one in 10 people who wanted a job could not find one. The claimant count was 1.2 million in December 2008 (the highest figure since January 2000). It is up 79,900 over the previous month and up 351,500 over the year.
Figure A4. Evolution of the unemployment rate, January 2006 - December 2008 (Per cent)
5.0 5.5 6.0 6.5
J
a
n-06
M
a
r-0
6
Ma
y
-0
6
Ju
l-0
6
S
ep-0
6
No
v
-0
6
J
a
n-07
M
a
r-0
7
Ma
y
-0
7
Ju
l-0
7
S
ep-0
7
No
v
-0
7
J
a
n-08
M
a
r-0
8
Ma
y
-0
8
Ju
l-0
8
S
ep-0
8
No
v
-0
8
Source: Author’s estimates based on the Labour Force Survey of the UK Office for National Statistics.