http://dx.doi.org/10.4236/ajcm.2013.34042
The Correlation and Linear Regression Analysis between
Annual GDP Growth Rate and Money Laundering in
Albania during the Period 2007-2011
*
Llambrini Sota1#, Fejzi Kolaneci2 1University “Pavaresia” in Vlora, Vlora, Albania 2University of New York in Tirana,Tirana, Albania
Email: #llambrini_kristi@yahoo.com
Received August 5, 2013; revised September 12, 2013; accepted September 18, 2013
Copyright © 2013 Llambrini Sota, Fejzi Kolaneci. This is an open access article distributed under the Creative Commons Attribution License, which permits unrestricted use, distribution, and reproduction in any medium, provided the original work is properly cited.
ABSTRACT
This study is the first attempt to investigate the relationship between the annual GDP growth rate and money laundering in the Republic of Albania during the period 2007-2011. The main result of the study: there is a negative correlation between money laundering process and economic growth rate in Albania during the specified period; there is a negative correlation between money laundering and import, but there is a positive correlation between money laundering and the government expenditure, as well a positive correlation between money laundering and export. More concretely: 1) The coefficient of correlation between cases referred in the prosecutor’s office for money laundering (X) and the annual GDP growth rate (Y) is r 0.74. The equation of the linear regression is y7.2827 0.0585 x
9
. 2) The coefficient of correlation between cases reported in the police for money laundering (X) and the annual GDP growth rate (Y) is
, while the equation of the linear regression is 0.81
r y7.3223 0.024 x
7.1411 0.01
. 3) The coefficient of correlation be- tween reported CAA (Cases for Alleged Activity) for money laundering (X) and the annual GDP growth rate (Y) is
, while the equation of the linear regression is 0.49
r y 07x. 4) The coefficient of correlation be-
tween government expenditures and the cases referred in the prosecutor’s office for money laundering is r0.72. 5) The coefficient of correlation between government expenditures and the cases reported in the police for money laun- dering is . 6) The coefficient of correlation between net export and the cases referred in the prosecutor’s office for money laundering is . 7) The coefficient of correlation between the cases referred in the prosecutor’s office for money laundering and unemployment rate is
0.79
r
0.89
r
0.64
r . 8) The coefficient of correlation between the cases reported in the police for money laundering and unemployment rate is r0.60. 9) The coefficient of correlation between the cases referred in the prosecutor’s office for money laundering and inflation rate is r0.22. 10) The coefficient of cor- relation between the cases reported in the police for money laundering and inflation rate is . 11) The coeffi- cient of correlation between the cases referred in the prosecutor’s office for money laundering and the investments in Albania is . 12) The coefficient of correlation between the cases reported in the police for money launder- ing and inflation rate is . 13) The coefficient of correlation between the cases referred in the prosecutor’s office for money laundering and the foreign direct investments in Albania is
0.13
r
0.95
r
6
0.979
r
0.973
r 6
. 14) The coefficient of correla- tion between the cases reported in the police for money laundering and the foreign direct investments in Albania is
. 0.8941
r
Keywords: Illicit Money; Money Laundering; GDP Growth Rate; Linear Regression; Pearson’s Coefficient of Correlation
1. Introduction
Nowadays one of the major issues in the world is anti-
money laundering. According to the IMF (International Monetary Funds), money laundering has become one of the most serious activities faced by the international fi- nancial community [1]. It became harmful because of its necessary coexistence with crime. The value of global
*There is an indecisive relationship between money laundering and GDP growth rate.
money laundering amounted to 2.5 trillion USD (see [2]). However, in 2011, it is estimated to be over 3.0 trillion USD. But before going further, it is necessary to clarify some of the concepts that will be used in this paper.
Definition 1. Illicit money refers to the money that is originated from illicit activities, especially from the criminal ones [2].
Definition 2. Money laundering is the process of ob- scuring the source, ownership or use of funds, usually cash, that are profits of illicit activity [3].
In other words, money laundering is the process of creating the appearance that large amounts of money ob- tained from serious crimes, such as drug trafficking, hu- man trafficking, weapons trafficking, corruption, coun- terfeiting of currency, or terrorist activity, originated from legitimate source (see [1,2]).
Definition 3. Guilty of money laundering is that a per-son hides or disguises the true origin, the source, move- ment or alienation of money, for which he (she) has knowledge that directly or indirectly derives from illegal activities, especially criminal (see [2,3]).
Remark.This definition is according to the EU’s leg- islation, as well as UN’s legislation. Furthermore, it is also used by the World Bank and Interpol.
Definition 4. GDP (Gross Domestic Product) is the market value of all finished goods and services within a country during a given period of time. The GDP is given by the formula: Y = C + I + G + NX, where C denotes private consumption, I denotes gross investments, G de- notes government spending and NX denotes Net Exports = Exports − Imports (see [1,4]).
According to some recent estimation, money launder- ing constitutes about 6% - 8% of GDP in USA, 7% - 9% of GDP in UK, Germany, France, Italy, etc. However, some scientists claim that the amount of official data is underestimated compared to the reality of money laun- dering process (see [2,3]). Actually, to fight money laun- dering in nations like America, where the relationship between the amount of money laundering and the annual GDP growth rate is positive, can be a double-edged sword. This happens because if illicit money is not turned into legal capital, they cannot be used into the economy, but only as a capital for illegal activities. While, in other countries of Europe such as France and Germany, the relationship between money laundering and GDP is negative (see [1,2,5]). Regarding the Republic of Albania there is not, yet, any study which analyses with a mathematical statistic method the relationship between money laundering and the annual GDP growth. Hence, our study is a first oriented toward this topic.
2. Mathematical Model
The linear regression analysis is used to estimate the im- pact that the process of money laundering has on the
economic growth, in the case of Albania over the period January 2007-December 2011. The random variable X denotes the annual number of cases of money laundering, while the random variable Y denotes the corresponding rate of annual real GDP growth. X represents the ex- planatory variable (input). Y represents the dependent variable (output). The sources of the data are INSTAT (Albanian Institute of Statistics), Bank of Albania (BoA), see [6-8] and General Directory for the Prevention of Money Laundering, Albanian Financial Intelligence Unit, AFIU 2011, see [9]. The Table 1 contains the data sets for the random variables X and Y.
3. Main Results
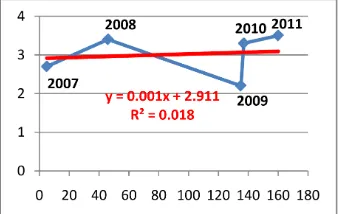
Coefficient of correlation r = −0.74 Coefficient of determination d = 0.55
Linear regression equation y = 7.2827 – 0.0585x
In Figure 1 using the linear correlation and regression analysis, as well as the given data set, we obtain the fol- lowing results:
The coefficient of correlation between cases referred in the prosecutor’s office for money laundering and the annual GDP growth rate is r = −0.74, which (according to Gelfand’s classification) indicates a moderate negative correlation between the two random variables. The coef- ficient of determination is d = r2 = 55%, which implies
that 55% of the total variation in annual GDP growth rate can be explained by the variation in the number of cases of money laundering, while 45% of the total variation in GDP growth rate must be explained by the impact of other factors. The linear regression equation is y = 7.2827
− 0.0585x, where x denotes the number of cases referred
in prosecutor’s office for money laundering and y de- notes the annual GDP growth rate for Albania during the period of January 2007-December 2011.
Coefficient of correlation r = −0.81 Coefficient of determination d = 0.66
Linear regression equation y = 7.3223 − 0.0249x
[image:2.595.340.508.593.700.2]In Figure 2 we have used the correlation analysis to measure the strength of the relationship between the cas- es referred in police for money laundry and annual GDP
Table
1. Annua
l numbe
r of c
as
es of mone
y lau
nde
ri
ng a
nd r
ate
of annual re
al GDP
gr
owth or
its
co
mpone
nts.
[image:3.595.219.384.92.732.2]
The pearson’s coefficient of correlation is r = −0.81, which (according to Gelfand’s classification) indicates a st
s the number of cases referred in police fo
termination d = 0.24
− 0.0107x
n r = −0.49 in-
di two
ra
orted CAA an
rong negative correlation between the two random va- riables. The coefficient of determination is d = r2 = 66%.
This result can be interpreted in this way: 66% of the total variation in GDP growth rate can be explained by the variation in the number of cases referred in police for money laundering. But, 34% of the total variation in GDP growth rate must be explained by the impact of other factors.
The linear regression equation is y = 7.27 − 0.024x,
where x denote
r money laundry, and y denotes the annual GDP growth rate for Albania during the period January 2007- December 2011.
Coefficient of correlation r = −0.49 Coefficient of de
Linear regression equation y = 7.1411
In Figure 3 the coefficient of correlatio
cates a moderate negative correlation between the ndom variables. While, the coefficient of determination d = r2 = 24%. This means that 24% of the total variation
in GDP growth rate is explained by the variation of re- ported CAA (Cases for Alleged Activity), whereas the other 66% is explained by the other factors.
The equation for the linear regression analysis is y =
7.1411 − 0.0107x, where x denotes the rep
[image:4.595.89.259.439.535.2]d y denotes the annual GDP growth rate for Albania
[image:4.595.339.510.564.707.2]Figure 2. Relationship between the cases reported in the police for money laundering and the annual GDP growth rate during 2007-2011.
Figure 3. Relationship between reported CAA and the an-nual GDP growth during 2008-2011.
growth rate.
during the period January 2008- December 2011.
.13%
ssion equation y = 5.7977 − 0.0195x
egres-
si is a relationship
be fo
ariation in GDP growth rate must be ex
8 + 216.92x
ve
co between govern-
m tor’s office and
re
d = 62%). Th
Coefficient of correlation r = −0.36 Coefficient of determination d = 0 Linear regre
In Figure 4 using the linear correlation and the r on analysis we have obtained that there
tween the CAA (Cases for Alleged Activity) referred r money laundry and the annual GDP growth rate.
The coefficient of correlation is r = −0.36, which indi- cates a moderate negative correlation between the two random variables. While the coefficient of determination is d = r2 = 13%.
We can interpret this result in this way: 13% of the to- tal variation in GDP growth rate can be explained by the variation in the referred CAA for money laundering. But 87% of the total v
plained by the impact of other factors.
The linear regression equation is y = 5.7977 − 0.0195x,
where x denotes the number of referred CAA, and y de- notes the annual GDP growth rate for Albania during the period January 2008-December 2011.
Coefficient of correlation r = 0.72 Coefficient of determination d = 0.52
Equation of linear regression y = 339877 + 499.83x
Coefficient of correlation r = 0.79 Coefficient of determination d = 0.62 Equation of linear regression y= 34170
Using the regression and correlation analysis we ha ncluded that there is a relationship
ent spending and cases referred prosecu ported in the police for money laundering.
In Figure 5 the coefficient of correlation is corre- spondingly r = 0.72, which indicate a strong positive cor-
relation between the variables. While, the coefficient of determination is respectively d = r2= 52% (or
is result is interpreted in this way: 52% (or 62%) of the total government spending can be explain by the cas- es referred in the prosecutor’s office (or the ones reported
[image:4.595.91.257.582.708.2]in the police) for money laundering. But, 48% (or 38%) of the total government spending is explain by other fac- tors.
The equation of the linear regression for the cases re- ferred in the prosecutor`s office is y = 339877 + 499.83x,
where x denotes the cases referred in prosecutor’s office, and y denotes the government spending in the Republic of Albania during the period of time January 2008-De- cember 2010.
In Figure 6 the equation of the linear regression for the cases reported in the police is y = 341708 + 216.92x,
where x denotes the cases reported in the police, and y
e variables. The denotes the government spending in the Republi of Al- bania during the period of time January 2008-December
c
2010.
Coefficient of correlation r = 0.17 Coefficient of determination d = 0.03
Equation of linear regression y = 912.45 + 2.9765x
Coefficient of correlation r = 0.50 Coefficient of determination d = 0.25
Equation of linear regression y = 720.8 + 2.8491x
Using the linear regression and correlation analysis we have concluded that there is a relationship between ex- port and cases referred in the prosecutor’s office and the ones reported in the police for money laundering.
The coefficient of correlation between cases referred in the prosecutor’s office and the export is r = 0.17, while
between cases reported in the police and export is r =
[image:5.595.89.257.457.569.2]0.50,which indicates, respectively, a weak and a moder- ate positive correlation between th
[image:5.595.339.509.473.567.2]Figure 5. Relation between government spending and cases referred in prosecutor’s office during 2008-2010.
Figure 6. Relationship between government spending and cases referred in the police during 2008-2010.
coefficient of determination is respectively d = r2 = 3%
or d = 25%. In Figure 7 the equation of the linear re- gression for the cases referred in the prosecutor’s office is y = 912.45 + 2.9765x, where x denotes the cases re-
ferred in the prosecutor’s office for money laundering, and y denotes the export in the Republic of Albania dur- ing the period of January 2008-December 2011. In Fig- ure 8 the equation of the linear regression for the cases reported in the police for money laundering is y = 720.8
oefficient of correlation r = −0.28 Coefficient of determination d = 0.08
Equation of linear regression y = 3778.1 − 4.5701x
Coefficient of correlation r = 0.17 Coefficient of determination d = 0.03
Equation of linear regression y = 3440.8 + 0.9103x
Using the linear regression and correlation analysis we have concluded that there is a relationship between im- port and cases referred in the prosecutor’s office, as well
+ 2.8491x, where x indicates the cases reported in the
police, and y indicates the export during the period of January 2008-December 2011.
C
as the ones reported in the police for the money launder- ing.
The coefficient of correlation is respectively r = −0.28
(or r = 0.17), which indicates, correspondingly, a weak
negative and positive correlation between the given val- ues. The coefficient of determination is respectively d =
r2 = 8% or d = 3%.
In Figure 9 the equation of the linear regression for the cases referred in the prosecutor’s office is y = 3778.1
− 4.5701x, where x denotes the cases referred in the
Fi n
prgure 7. Relation between export and cases referred iosecutor’s office for money laundering.
[image:5.595.339.510.607.707.2]prosecutor’s office for money laundering, and y denotes the import in the Republic of Albania during the period of January 2008-December 2011. In Figure 10, the equa-tion of the linear regression for the cases reported in the police for money laundering is y = 3440.8 + 0.9103x,
where x indicates the cases reported in the police, and y
indicates the import during the period of January 2008- December 2011.
Coefficient of correlation r = 0.89 Coefficient of determination d = 0.79
quation of linear regression
Using the regression and cor have
concluded that there is a relationship between net export and cases referred in the prosecutor’s office and reported in the police for money laundering.
In Figure 11, the coefficient of correlation is corre- spondingly r = 0.89, which indicate a strong and moder-
ate positive correlation between the variables. While, the coefficient of determination is respectively %
Equation of linear regression y = −2865.7 + 7.5 66x
Coefficient of correlation r = 0.68 oefficient of determination d = 0.46
4
C
E y-2720 + 1.9389x
relation analysis we
2 = r
d =79
(or d = 46%). This result is interpreted in this way: 79% (or 46%) of the total net export can be explained by the cases referred in prosecutor’s office (or the ones reported in the police) for money laundering. But, 21% (or 54%) of the total net export is explain by other factors.
The equation of the linear regression for the cases re-ferred in the prosecutor’s office isy = −2865.7 + 7.5446x,
[image:6.595.338.513.461.566.2]where x denotes the cases referred in prosecutor’s office, and y denotes the net export in the Republic of Albania
[image:6.595.87.260.462.563.2]Figure 9. Relationship between import and cases referred in prosecutor’s office for money laundering.
Figure 10. Relationship between import and cases reported
during the period of time January 2008-December 2011.
in the police for money laundering.
In Figure 12 the equation of the linear regression for the cases reported in the police is
where x denotes the cases reported in the police, and y
denotes the net export in the Republic of Albania during the period of time January 2008-December 2011.
Coefficient of correlation r = 0.22 Coefficient of determination d = 0.05 Equation of linear regression
Coefficient of correlation r = 0.136 Coefficient of determination d = 0.02
nalysis we have oncluded that there is a relationship between annual inflation rate and the cases referred in the prosecutor’s office and reported in the police for money laundering.
The coefficient of correlation is correspondingly r =
0.22 (or r = 0.136), which indicate a weak positive
cor-relation between the variables. While, the coefficient of determination is respectively % (or d = 2%).
This result is interpreted in th 2%) of the
total net export can be explained by the cases refe red in prosecutor’s office (or the ones reported in the police) for
-2720 1.9389
y x,
y0.0012x2.9712
Equation of linear regression y0.0011x2.9113
Using the regression and correlation a c
= r =2
d 5
is way: 5% (or
r
money laundering. But, 95% (or 98%) of the total net export is explain by other factors.
In Figure 13 the equation of the linear regression for the cases referred in the prosecutor’s office is
y0.0012x2.9712, where x denotes the cases
[image:6.595.86.263.604.708.2]re-ferred in prosecutor’s office, and y denotes the net export in the Republic of Albania during the period of time
Figure 11. Relationship between net export and cases re-ferred in prosecutor’s office for money laundering.
[image:6.595.337.513.604.701.2]January 2008- December 2011.
In Figure 14 the equation of the linear regression for the cases reported in the police is
where x denotes the cases reported in the police, and y
denotes the net export in the Republic of Albania during the period of time January 2008-December 2011.
Coefficient of correlation r = 0.64 Coefficient of determination d = 0.41
Equation of linear regression y = −710.73 + 56.307x
Coefficient of correlation r = 0.60 Coefficient of determination d = 0.36
e have oncluded that there is a relationship between unem-ployment and cases referred in the prosecutor’s office and reported in the police for money laundering.
The coefficient of correlation is correspondingly r =
0.64 (or r = 0.60), which indicate a moderate positive
correlation between the variables. While, the coefficient of determination is respectively d = r2 = 41% (or d =
36%). This result is interpreted in this way: 41% (or 36%) of the total unemployment can be explained the
total unemployment is explain by other factors, tion during this study.
utor’s office is y =
y0.0011x2.9113
Equation of linear regression y = 13.086 + 0.0026x
Using the regression and correlation analysis w c
by cases referred in prosecutor’s office (or the ones reported in the police) for money laundering. But, 59% (or 64%) of the
which were not taken in considera
In Figure 15 the equation of the linear regression for the cases referred in the prosec
[image:7.595.90.258.448.549.2]−710.73 + 56.307x, where x denotes the cases referred in
Figure 13. The relationship between the cases referred in the prosecutor’s office and the annual inflation rate ba
[image:7.595.338.510.468.570.2]in Al-nia.
Figure 14. Relation between cases reported in the police for money laundering and the annual inflation rate in Albania.
prosecutor’s office, and y denotes the unemployment in the Republic of Albania during the period of time Janu-ary 2008-December 2011.
In Figure 16 the equation of the linear regression for the cases reported in the police is y = 13.086 + 0.0026x,
where x denotes the cases reported in the police, and y
denotes the unemployment in the Republic of Albania during the period of time January 2008- December 2011.
Coefficient of correlation r = −0.979
Coefficient of determination d = 0.9584
ficient of determination d = 0.9479
Equation of linear regression y = 4651.4 − 30.281x
Using the regression and correlation analysis we have concluded that there is a relationship between invest-ments and cases referred in the prosecutor’s office and reported in the police for money laundering. The coeffi-cient of correlation between the cases reported in the prosecutor’s office and investments is r = −0.979,while
the relationship between the cases reported in the police and the investments is r = −0.9736, which indicate a
strong negative e correlation between the va ables.
the cases referred in prose-cu
Equation of linear regression y = 4909.2 − 78.788x
Coefficient of correlation r = −0.9736 Coef
ri While, the coefficient of determination is respectively d = r2 = 0.9584 or d = 0.9479.
In Figure 17 the equation of the linear regression for the cases referred in the prosecutor’s office is y = 4909.2
− 78.788x, where x denotes
[image:7.595.88.258.599.706.2]tor’s office, and y denotes the unemployment in the Republic of Albania during the period of time January 2008-December 2011.
Figure 15. Relationship between cases referred in prosecu-tor’s office and the annual unemployment rate in Albania.
[image:7.595.339.510.609.707.2]In Figure 18 the equation of the linear regression for the cases reported in the police is y = 4651.4 − 30.281x,
here x denotes the cases reported in the police, and y
denotes the unemployment in the Republic of Albania during the period of time January 2008- December 2011.
Coefficient of correlation r = 0.95 Coefficient of determination d = 0.9036
Equation of linear regression y = 501.81 + 4.4008x
Coefficient of correlation r = 0.8941 Coefficient of determination d = 0.7995 Equation of linear y = 525.14 + 1.5989x
Using the regression and correlation analysis we have
ffice and reported in the police for money laundering. The coefficient of correlation between the cases re-ported in the prosecutor’s office and the foreign direct investments is r = 0.9505,while the relationship between
the cases reported in the police and the foreign direct investments is r = 0.894, which indicate a strong positive
correlation between the variables. While, the coefficient of determination is respectively d = r2 = 0.9036 or d =
7995.
In Figure 19 the equation of the linear regression or w
concluded that there is a relationship between the foreign direct investments and cases referred in the prosecutor’s o
the cases referred in the prosecutor’s office is y = 501.81
+ 4.4008x, where x denotes the cases referred in
prose-cutor’s office, and y denotes the unemployment in the Republic of Albania during the period of time January 2008-December 2011.
[image:8.595.313.515.217.570.2]In Figure 20 the equation of the linear regression for the cases reported in the police is y = 525.14 + 1.5989x,
[image:8.595.89.259.465.564.2]Figure 17. Relation between the cases referred in the pros-ecutor’s office and the investments in Albania.
Figure 18. Relationship between the cases reported in the police and the investments in Albania.
w
uring the period of time January 2008-December 2011. The main difficulty (and restriction) of the study is missing of the official data regarding to the money laun-dering before 2007 in Albania.
Let us reconsider the relationship between the annual number of cases referred in prosecutor’s office for mon-ey laundering (denoted by x) and the rate of annual real GDP growth (denoted by y) during the period 1 January 2007-31 December 2011 in Albania.
Given the data set containing n = 5 observations: here x denotes the cases reported in the police, and y
denotes the unemployment in the Republic of Albania d
1 2
x , x226, x359, x464, x551 , 1 6
y , y28, y33.1, y43.9, y53.6,
Compute the following statistics: see Table 1.
5 2
1
2697.2
xx k
k
S x x
5
1
157.74
xy k k
k
S x x y y
.
5 2
1
16.748
yy k
k
S y y
.174.488
yy xy
SSE S S
2 58.163
3
SSE
S .
7.626 3
SSE
S
Fi es referred in the
prosecutor’s office and the fore direct investments. gure 19. The relationship between cas
ign
[image:8.595.89.258.606.707.2]The simple linear regression equation is
0 1 y x ,
here ε denotes the random error term, see Bolton and David (2002).
Assume that the mean w
0E and the variance
2V . An estimation of the unknown variance 2
hen is S2. If the ra
both 0 and ndom error 1 ε is normally distributed, t variable
are norm uted. Furtherm
is nt of both
ally distrib independe
ore,
the random S2
0
and
1
.
Compute: 5 2 10858,
k x
1 k 5 2 1k kx
00 5 0.805,
xx C S 11 1 0.00037, xx C S
and the critical value of t-distribution
A 95% confidence interval for
0.05 3 3.182. c
t t
0
is
0 t0.05 3 S C00.
A 95% confidence interval for 1
is
1 t0.05 3 S C11.
.
We obtain the following results: P (−14.49 < 0 < 29.05) = 95% ,
P (−0.5251 < 1 < 0.4081) = 95%.
Test the :
Given the significance level α = 0.05 hypothesis
H0 1 = 0 ,
Ha:1 ≠ 0. (two - tailed test)
The appropriate test statistics is “Student’s” istri- t-d bution 1 11 t S C
The observed value of e test statistics is th
0.0585 0.402
7.260.01923
t
and the critical value of the test statistics is tc 3.182.
Decision Rule:
0.402 c 3.182
t t
Accept the null hypothesis H0: = 0 at th
ence level. β1 e 95%
con-fid
A 95% confidence interval for the e ected value xp
0 1E y x*,
denotes a particular value of x, is given by the
formula:
where x*
*
2.
* 1 c
0
xx
1 x x
se
x t S
n S
e [5]. We obtain:
*
2*
7.2827 0.0585 24.066 0.2
2697.2
x
40.4x
A 95% prediction interval for y when x = x* is given
by the formula:
20 1 c
xx
*
* 1 1 x x .
x t S
n S
see [5].
We obtain the following results:
*
2* 40.4
7.2827 0.0585 24.266 1.2 .
2697.2
x
x
Let consider the relationsh p between the annual i
nu
un-dering (denoted by x) and the rate of annual real GDP growth (denoted by y) during the pe d 1 January 1997-
em
data set containing n = 5 observations: mber of cases reported in the police for money la
rio 31 Dec ber 2011 in Albania, see Table 1.
Given the
1 5
x , x246, x3135, x4137, x5160, 1 6
y , y28, y33.1, y43.9, y53.6,
Compute: Sxx 18077.2, Sxy 449.56,
, Syy 16.748
466.308
SSE ,
12.467
S , 5 2 64735,
k x
1 k 0 7.322335 , 1 0.02487,
00 0.7162
C , C00 0.8463,
11
C 0.0000553, C11 0.00744,
3.182
tc . A 95% confidence interval for 0 is : (−26.248; 40.892 ).
A 95% confidence interval for 1 is : (−0.320; 0.270 ).
Given the significance level α = 0.05. Test the hypothesis
Ha: β1≠ 0. (two - tailed test)
The observed value of the test statistics is
1 11 0.268 t S C
The critical va e of the test statistics is
Decision Ru lu 3.182 c t le
0.268 c 3.182
t t
Accept the null hypothesis H : β1 = 0 at the 95% level
of confidence
A 95% confidence interval for the expected value
0
.
0 1E y x*,
where x* denotes a particular value of x is
*
2* 6.6
7.322 0.02487 39.67
18077.2
1 0.2 x .
x
A 95% prediction interval for y
when x = x* is given by the formula
*
2*
7.322 0.02487 x 39.671 1.2 6.6
18077.2 .
x
e can develop the confidence intervals and
hypo eters β0 and β1 of simple
lin considered
in the paper.
Remark
Th efficient of
correlation r is difficult to obtain in the small sample case. For large random samples this di lty could be
over-co sher z - transformation, see [5].
4. Conclusions
it is
po ega-
tively correlated with the number of cases of money
la ases above
m a negative
number. However, further researches may be necessary to draw light on this topic, as we had no access to data regarding the exact amount of money laundering he
on s the number of cases
rmation at our dis- the percentage that illicit money occupies on the annual GDP growth rate over January 2007-December 2011. Actually, in other countries, these data are published and availabl or
sc
. Nevertheless, in our case, where the cor- relation between the two variables X and Y is negative, ndering policies discourage criminal ac-
cutor’s office for money laundering (r = 0.72);
rrelation between government ex-
ve
se surprising results, because officially data
e Economics of Crime and Money Laun-
Similarly, w
thesis testing for the param
ear regression equation in all relationships
e probability distribution for Pearson co
fficu me by using the Fi
By analyzing the official data available to us during the period of 2007-2011 for the Republic of Albania,
ssible to conclude that the economic growth is n
undering, because as we have seen in the c entioned the coefficient of correlation “r” is
. T ly information available to us wa
of money laundering. With this info posal, it is not possible to clearly state
e f
ientific studies, for instance, in America, Germany, and other 11 countries that have done similar researches. But, in Albania the amount of money laundering is not of public domain
anti-money lau tivities.
Some surprising results of this study are:
1) The positive correlation between government ex- penditure and the number of cases referred in the
prose-2) The positive co
penditure and the number of cases reported in police for money laundering (r = 0.79);
3) The positive correlation between export and the number of cases referred in the prosecutor’s office for money laundering (r = 0.17);
4) The positive correlation between export and the number of cases reported in police for money laundering (r = 0.50);
5) The positive correlation between the number of cases referred in the prosecutor’s office for money laun- dering and net export (r = 0.89);
6) The positive correlation between the number of cases reported in police for money laundering and net export (r = 0.68);
7) The positive correlation between the number of cases referred in the prosecutor’s office for money laun- dering and annual unemployment rate (r = 0.64);
8) The positive correlation between the number of cases reported in the police and the annual unemploy- ment rate (r = 0.60);
9) The positive correlation between the number of cases referred in the prosecutor’s office for money laun- dering and the inflation rate (r = 0.22);
10) The positive correlation between the number of cases reported in the police and the inflation rate (r = 0.136);
11) The positive correlation between the number of cases referred in the prosecutor’s office for money laun- dering and the foreign direct investments in Albania (r = 0.95);
12) The positive correlation between the number of cases reported in the police and the foreign direct in-
stments in Albania (r = 0.8941).
Actually, it is not possible to give a scientific argu- ment for the
for the exact amount of money laundering during the years 2007, 2008, 2009, 2010, and 2011 are not pub- lished in the Republic of Albania.
Statistics, Vol
Growth and Money Laundering: A Linear
Prevention of Money Laun- dering: Does Anti-Money Laundering Policy Reduce
Crime?” Review of Law & Economics, Vol. 5, No. 2, 2008. http://ideas.repec.org/p/use/tkiwps/0835.html [2] F. G. Schneider, “Turnover of Organized Crime and Mo-
ney Laundering: Some Preliminary Empirical Findings,” Public Choice, Vol. 144, No. 3, 2010, pp. 473-486. http://EconPapers.repec.org/RePEc:kap:pubcho:v:144:y:2 010:i:3:p:473-486
[3] R. J. Bolton and D. J. David, “Statistical Fraud Detection:
A Review,” Institute of Mathematical . 19, [8] Bank of Albania, “Imports of Goods According to Part- ners,” Bank of Albania, Republic of Albania, 2011. [9] General Directorate for the
No. 3, 2002, pp. 235-249.
[4] I. Stancu and D. Rece, “The Relationship between Eco-
nomic der
sion Model,” Theoretical and Applied Economics, Vol. 9, No. 9, 2009, pp. 3-8.
http://www.doaj.org/doaj?func=abstract&id=452320 [5] K. M. Ramachandran and C. P. Tsoksos, “Mathematical
Statistics with Applications,” Academic Press, London, 2009.
[6] Bank of Albania, “Eksport of Goods According to Part- ners,” Bank of Albania, Republic of Albania, 2011. [7] Bank of Albania, “Governments Expenditures,” Bank of
Albania, Republic of Albania, 2011.