Fish Assemblages in the Degraded Mangrove Ecosystems
of the Coastal Zone, Benin, West Africa: Implications for
Ecosystem Restoration and Resources Conservation
Alphonse Adite1*, Ibrahim ImorouToko2, Adam Gbankoto3
1PRECOB, Unité de Recherches sur les Zones Humides (URZH), Département de Zoologie, Faculté des Sciences et Techniques,
Université d’Abomey-Calavi, Cotonou, Bénin; 2Faculté d’Agronomie, Université de Parakou (UNIPAR), Parakou, Bénin; 3Dé-
partement de Physiologie Animale, Laboratoire de Pharmacologie, Faculté des Sciences et Techniques, Université d’Abomey-Calavi, Cotonou, Bénin.
Email: *alphonseadite@gmail.com
Received September 26th, 2013; revised October 27th, 2013; accepted November 26th, 2013
Copyright © 2013 Alphonse Adite et al. This is an open access article distributed under the Creative Commons Attribution License, which permits unrestricted use, distribution, and reproduction in any medium, provided the original work is properly cited. In accor- dance of the Creative Commons Attribution License all Copyrights © 2013 are reserved for SCIRP and the owner of the intellectual property Alphonse Adite et al. All Copyright © 2013 are guarded by law and by SCIRP as a guardian.
ABSTRACT
Mangrove forests are unique habitats in their function as potential food source and nurseries, and support an important fisheries resource. In the Benin coastal zone, the mangrove fishes have been surveyed to investigate fish species diversity, community structures and ecosystem degradation impacts in order to protect and to improve the mangrove fish resources. Results from wet, high-water and dry season samplings revealed that the two dominant mangrove species, Rizophora racemosa and Avicennia africana, are being intensively degraded for domestic use such as firewood and house building. Fifty one (51) fish species belonging to 25 families were recorded with Eleotridae (7 species), Cichlidae (5 species), and Mugilidae (5 species), the most speciose families. Dominant trophic guilds were detritivores (54.57%) and planktinovores/microcarnivores (30.41%). Six (6) species, Sarotherodon melanotheron, Dormitator lebretonis, Gerres melanopterus, Hemichromis fasciatus, Ethmalosa fimbriata, and Aplocheilichthys spilauchen, dominated the samples and accounted for about 80.27%. Sarotherodon melanotheron constituted the major dominant species and accounted numerically for about 29% of the total catches and 46.7% of the total biomass. The Margalef index of species richness ranged between 2.42 and 4.43, the Shannon-Weaver index of species diversity between 1.39 and 2.27, and the evenness between 0.50 and 0.62. Lower indices were observed for the highly degraded and the moderately degraded sites whereas higher indices were recorded for the less degraded and the restored sites. Species richness, species diversity and dominant species abundance were positively correlated with depth and transparency and negatively correlated with temperature. Multi-species fisheries dominate the coastal zone with Sarotherodon mel- anotheron, Dormitator lebretonis, Gerres melanopterus, Ethmalosa fimbriata, Liza falcipinus, Mugil sp. and Chry- sichthys nigrodigitatus,the major species in the commercial catches. In addition to the mangrove destruction, the hydro electrical dam have greatly modified the Mono River flooding regime, water quality and the fish composition of the Benin coastal lagoon system. An integrated approach of the mangrove resource management/conservation, including intensive mangrove restoration, management of key fish species, freshwater prawns (Macrobrachiun sp.), peneids shrimps, mangrove oysters (Crassostrea sp.), and crabs (Callinectes sp., Cardiosoma sp.), and habitat protection is required for ecosystem recovery and sustainable exploitation.
Keywords: Conservation; Detritivores; Diversity; Evolutionary Process; Fragmentized Habitats; Hydroelectrical Dam;
Mangrove Degradation; Multi-Species Fisheries
1. Introduction
Mangrove forests are prevalent in many West African
such as shrimps and most commercial fish species [6-8]. Fisheries success in many tropical coastal zones depends on mangrove health because they serve as spawning and nursery grounds for most species. However, mangroves are still being destroyed in many wetlands. In Benin, the coastal lagoons remain the only sites where mangroves are still well-structured. But these mangroves are being intensively destroyed for firewood, housing, salt proc- essing and to build the “Akadja” (park of branches in- stalled in the lagoons and utilized to attract fishes) [9-11]. Other major sources of degradation at the coastal lagoons, are the hydro electrical dam constructed on the Mono River and the invasion of the water hyacinth, Eichhornia crassipes [5]. Moreover, fishes, shrimps and shellfishes resources of the coastal lagoons are overexploited be- cause of the increasing fishermen population and the use of detrimental fishing gears.
These multiple uses and degradations factors of the coastal lagoons are profoundly affecting the density and health of the mangrove habitat, the physical environment and the structure of the fish community. However, knowledge on mangrove fish is not well documented and is limited to some poor information on commercial fishes such as cichlids, mullets and clupeids [10]. Especially, little is known about the mangroves fish community structure such as species abundance, richness, diversity and distribution in the degrading mangrove zone. These community structure indices are badly needed to design an appropriate framework of the mangrove fish conser- vation and the overall ecosystem restoration plan.
The present study was undertaken in the Benin coastal lagoons to obtain information related to physical envi- ronment, mangrove fish species distribution, population structure and degradation in order to improve mangrove
fish resource management and conservation in West Af- rica. Specific objectives were 1) to investigate fish as- semblages, distribution and structure of the fish commu- nity in the mangrove habitat; 2) to investigate relation- ships between environment features and fish community indices; 3) to evaluate mangrove degradation and status according to site, and impacts on fish population; 4) to survey socioeconomic aspects of resources exploitation and 5) to design an ecosystem restoration and resource conservation plan in participatory approaches with grass- roots.
2. Methods
2.1. Study Region
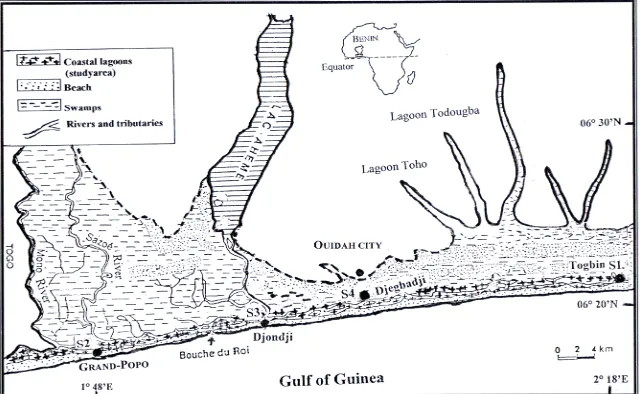
The study region is the mangrove ecosystem of the Benin coastal zone (Figure 1). This region covers about 3000
ha of mangrove and extended on about 130 km. The cli- mate is sub equatorial with two (2) wet seasons (April to July; mid-September to October) and two (2) dry seasons (December to March; mid-August to mid-September). Annual mean rainfall is about 1307.3 mm [12] and am- bient temperature varies between 25˚C and 27.7˚C. Swamps cover about 6000 ha and flooding at the coastal zones depends on the Mono River on which a dam is constructed for electrical power. This hydro electrical dam greatly affects the flooding regime of the coastal zone and the biological resources. Though very diverse, the plant communitiy at the coastal zone is dominated by
Rizophora racemosa and at some extent Avicennia afri- cana. Rizophora racemosa grows in the intertidal zone while Avicennia africana grows on the adjacent wetland at the back part of Rizophora racemosa. At some sites, a
[image:2.595.138.458.508.705.2]seagrass, Cyperus articulatus is well established in the water. Beside its nursery role, Cyperus articulatus is ex- ploited by women for mat processing. The habitats where mangroves were destroyed are mostly colonized by a grass, Paspalum vaginatum. Along the coastal zone, there was a vast plantation of Coco nucifera which is exploited for oil and food. Also, a palm-tree species,
Elaeis guineensis is common in the adjacent plant com- munity of the coastal zone. All these species are associ- ated with other plant species such as Drepanocarpus lunatus, Dalbergia ecastaphyllum, Laguncularia ra- cemoa, Thespesia populnea, Annona senegalensis, Bri- delia ferruginea, Imperata cylindrica, Sesuvium pos- tulacastrum, Phyloxesus vermicularias, Acrostichum aureum.
2.2. Sampling Sites
Four sites were selected at the Benin coastal zone for the sampling (Figure 1; Table 1). Sites were classified ac-
cording to the degree of mangrove degradation. Site 1 (“Highly degraded site”), located at Togbin village, was characterized by a daily cutting of mangrove for fire- wood. From this village, a huge volume of mangrove wood were transported to other villages and towns; Site 2 (“Moderately degraded site”) is located at Grand-Popo town where mangrove forest is moderately degraded; Site 3 (“Less degraded site”) is located at Djondji village where the destruction of mangrove forest is prohibited by traditional law; Site 4 (“Restored site”) is located at Djegbadji village where the mangrove forest have been once severely degraded, but have been restored through reforestation. At each site, samplings were made in four ecological habitats namely 1) mangroves fringe, 2) ad- jacent marginal vegetation (grass), 3) channel and 4) ad- jacent open water. At each sampling site, when available, an attempt was made to sample these four habitats.
2.3. Habitat Evaluation
Each sampling site was evaluated. Evaluation were made on habitat type, water type, dominant terrestrial habitat, utilization of adjacent land and wetland, aquatic vegeta-
tion, dominant mangrove species, mangrove cutting/de- gradation, substrate, pollution, atmospheric conditions and water physico-chemical conditions. Water samples were collected by a hydrobios sampler. Water depth was measured to the nearest millimeter using a graduated rope, turbidity was measured to the nearest millimeter with a secchi disk, temperature and dissolved oxygen were measured to the nearest 0.1˚C and 0.1 mg·l−1 re-
spectively with a digital oxythermometer, pH was meas- ured to the nearest 0.1 with a model 3150 waterproof pH meter and salinity was measured to the nearest 1‰ with a model VISTA refractometer. Habitat evaluation and fish collection were made twice during dry, wet and tran- sitional season (flooding period).
2.4. Fish Collection
[image:3.595.57.541.632.736.2]Fishes were captured at all sampling sites using appro- priate set of fishing gears so that common fish species would be well represented and samples reflect the rela- tive abundance of fish population. Also, the use of vari- ous collecting gears helped to increase the likelihood of rare species to occur in the fish sample. At the four habi- tats, fishes were sampled from March 2010 to February 2011 with seines (6.15 m × 2 m, 16 mm mesh; 2 m × 1.8 m, 5 mm mesh), cast nets (6 m diameter, 20 mm mesh), experimental gill net (200 m × 1.30 m, 50 mm mesh; 200 × 1.30 m, 40 mm mesh; 200 m × 1.30 m, 25 mm mesh). Samplings in marginal aquatic vegetation and channel were made with small seine by setting the seine station- ary, and kicking the vegetation to drive the fish in to the net before lifting it. At the mangrove fringe, seine hauls were made close to the intertidal roots system. Cast nets were used very close to the mangrove with the help of fishermen. The net, once casted cover a defined area and is maintained stationary. All trapped fishes were then removed by hands from the mud before the cast net was pulling out. This method increases the efficiency of the cast net. Gill nets were set very close to the mangrove, yet, contribute very little to the total sample. A cross- lake fish trap built by the fishermen was used for sam- pling. This gear possesses some final catching chamber and is set in open water in a sand mud or muddy envi-
Table 1. Geographic coordinates of the sampling sites.
Geographic coordinates
Sampling sites Site name Mangrove status Longitude Latitude
Site 1 Togbin village Highly degraded 06˚21'13.5"N 002˚18'25.4"E
Site 2 Grand-Popo town Moderately degraded 06˚17'11.4"N 001˚48'39.7"E
Site 3 Djondji village Less degraded 06˚18'13.8"N 001˚58'15.3"E
ronment. The use of various fishing gears at the man- grove sites helped to assess the whole mangrove fish species. Once caught, the fish samples were identified, measured, weighted and preserved in 10% formalin and latter in 70% ethanol for further laboratory observation. Species identification was based on references such as Lopez-Fernandez et al. (2003) [13], Leveque et al. (1990a, 1990b) [14,15], Holden and Reed (1972) [16], and Lowe McConnell (1975, 1987) [17,18].
2.5. Survey on Mangrove Utilization and Degradation
Artisanal fishermen were potential users and beneficiar- ies of the mangrove resource and know a lot about this ecosystem. A survey was implemented in fishing villages to investigate on degradation and mangrove resources utilization. A survey guide was used for this investigation.
2.6. Data Analysis
Species abundance and relative abundance were com- puted to indicate the numerical importance of each spe- cies in the sample. Species richness (d) was determined following Margalef, (1968) index [19]:
1
d S LnN
where S is the number of species and N the number of individuals in the sample. Species diversity (H') was de- termined following Shannon and Weaver (1963) index of diversity [20,21]:
log10
H
pi piwhere H' is the index of species diversity, pi = ni/N, the proportion of total sample belonging to ith species, ni the number of individuals of each species in the sample, N
the total number of individuals of all species in the sam- ple. The evenness measure of Shannon-Weaver (J’) func- tion was computed following the formula:
' ' log
J H S
where H’ is the Shannon and Weaver index of diversity, S is the number of species in the sample. For this study, these three indexes (richness, diversity, evenness) were computed for each habitat. I used the PC-ORD [22] com- puter program to generate species diversity indexes, spe- cies richness and evenness. The PC-ORD software is a multivariate analysis tool for ecological data.
To explore the trophic structure of the fish community, I categorized fishes in five trophic categories which were 1) detritivores, 2) planktinovores/microcarnivores, 3) her- bivores, 4) intermediate carnivores and 5) top-carni- vores [23-25]. Previous studies from Halliday & Young [25], Adite & Winemiller [26], Adite et al., [27] on diet
were used for this classification. The importance of each trophic category was appreciated using the relative abundance of fish species. The relationships between the fish community attributes and physico-chemical attrib- utes were evaluated through linear regression analysis and F-test using SPSS software package [28].
For dominant species (Dormitator lebretonis, Ap- locheilichthys spilauchen, Ethmalosa fimbriata, Gerres melanopterus, Hemichromis fasciatus, Sarotherodon melanotheron), frequency histograms of fish size inter- vals were constructed for samples according to habitat type using Excel software. With SPSS software [28], length-weight relationships were examined for different species by habitats type according to the model:
b
W a TL and its log-linear form
Log Log W a b Log TL
where TL is the total length, W is the individual weight, a
is a constant, and b is the allometry coefficient [29]. Univariate analysis of variance was used to test the sig- nificance of the regression equations using SPSS soft- ware package [28].
3. Results
3.1. Hydrology and Habitat Characteristics
The Benin mangrove ecosystem is a brackish water re- ceiving freshwater from the Mono River (South-Benin) and salty water from Atlantic Ocean. Significant varia- tions (P < 0.05) of the water quality features were re- corded among the different sites sampled. Depths varied from 5 to 447 cm (mean: 81.93 cm), transparencies from 3 and 150 cm (mean: 41 cm). Water temperatures ranged between 25.3˚C and 35.2˚C (mean: 30.8˚C), pH between 5.5 and 8.7 (mean: 6.7), dissolved oxygen between 0.1 and 8.5 mg/l (mean: 5.7), and salinities between 0‰ and 35‰ (mean: 20.1‰) (Table 2). Particularly, transitional
season (flood) salinities were relatively low and vary between 0‰ and 20‰ (mean: 14.4‰) because of the flooding from the Mono River during this period. Wet and dry season salinities were relatively high and ranged from 0‰ to 35‰ (mean: 23‰) and 10‰ to 35‰ (mean: 24‰), respectively. Salinities from sites close to the tidal pass were always high and oceanic (Djondji village: 31‰ - 33‰). Also, the water quality was predominantly freshwater at sites close to the Mono River mouth where salinities were always low (Grand-Popo village: 0‰ - 6‰).
3.2. Ichtyofaunal Composition, Abundance and Diversity Indices
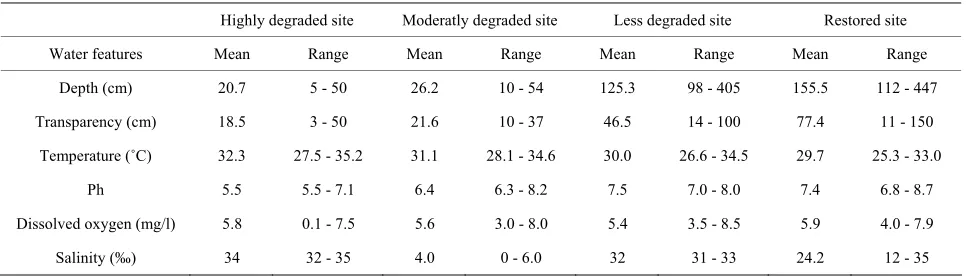
Table 2. Ranges and mean values of the water parameters measured in four habitat categories of the Benin mangrove ecosystem at the coastal zone.
Highly degraded site Moderatly degraded site Less degraded site Restored site
Water features Mean Range Mean Range Mean Range Mean Range
Depth (cm) 20.7 5 - 50 26.2 10 - 54 125.3 98 - 405 155.5 112 - 447
Transparency (cm) 18.5 3 - 50 21.6 10 - 37 46.5 14 - 100 77.4 11 - 150
Temperature (˚C) 32.3 27.5 - 35.2 31.1 28.1 - 34.6 30.0 26.6 - 34.5 29.7 25.3 - 33.0
Ph 5.5 5.5 - 7.1 6.4 6.3 - 8.2 7.5 7.0 - 8.0 7.4 6.8 - 8.7
Dissolved oxygen (mg/l) 5.8 0.1 - 7.5 5.6 3.0 - 8.0 5.4 3.5 - 8.5 5.9 4.0 - 7.9
Salinity (‰) 34 32 - 35 4.0 0 - 6.0 32 31 - 33 24.2 12 - 35
belonging to 33 genera and 25 families were collected from March 2010 to September 2011 (Table 3). The
number of species recorded in the “highly degraded site”, “moderately degraded site”, “less degraded site” and in the “restored site” were 16, 19, 29 and 38, respectively. The most speciose families were Eleotridae (7 species), Cichlidae (5 species) and Mugilidae (5 species). The families Eleotridae, Cichlidae, Mugilidae, Cyprinotonti- dae, Gerreidae and Clupeidae numerically dominated the sample and accounted together for 93.21%. Also, six species Dormitator lebretonis, Sarotherodon melan- otheron, Gerres melanopterus, Ethmalosa fimbriata,
Hemichromis fasciatus, and Aplocheilichthys spilauchen
dominated the sample and accounted together for 80.27%.
Sarotherodon melanotheron, alone, constituted 28.98% of the total sample followed by Dormitator lebretonis
(15.19%), Aplocheilichthys spilauchen (13.71%), Gerres melanopterus (12.90%), Ethmalosa fimbriata (4.84%)
and Hemichromis fasciatus (4.65%). The remaining (19.73%) was shared by 45 species and none of them had individually a relative abundance more than 2.65%. Fish relative numeric abundances in highly degraded and moderately degraded sites were lower and accounted for 6.17% (biomass: 2.12%) and 9.12% (biomass: 5.89%), respectively. In term of biomass, the 7894 fishes col- lected weighted 95106.7 g. Seven species S. melan- otheron, D. lebretonis, G. melanopterus, E. fimbriata, H. fasciatus, L. falcipinnisandC. nigrodigitatus constituted for about 84.41% of the total biomass. S. melanotheron, alone, constituted 46.66% of the total biomass. The re- maining (15.59%) is shared by 45 species and none of them had individually a biomass more than 3.62%.
Aggregated site samples used to generate community indices indicated that the Margalef index (D) [19] of spe- cies richness ranged between 2.42 and 4.43, the Shan- non-Weaver index of species diversity between 1.39 and 2.27, and the evenness between 0.50 and 0.62 (Table 4).
In general, lower indices were observed for the highly degraded and the moderately degraded sites whereas
higher indices were recorded for the less degraded and the restored sites.
3.3. Trophic Structure of Fish Composition
The mangrove fish community was numerically domi- nated by detritivores (54.57%) and planktinovores/mi- crocarnivores (30.41%). Though not numerically impor- tant, the intermediate carnivores (4.7%) and the top-car- nivores (6.6%) comprised an important number of spe- cies, 15 and 15, respectively (Table 5), and had a rela-
tively low biomass percentage of 5.6% and 10.5%, re- spectively. Herbivores species (Tilapia guinensis, Tilapia zillii) comprised 3.66%. In terms of biomass, detritivores dominated the sample (68.2% of the total biomass) due to the predominance of S. melanotheron, reaching 46.7% of the total biomass.
3.4. Size Structures
Overall, the fish size (total length) in the mangrove zone ranged from 7 mm (G. melanopterus) to 440 mm (Cla- rias gariepinus) and their corresponding weights were 0.1 g and 525 g, respectively. Larger fish were found in the less degraded site and in the restored site (Figures 2-8) whereas smaller fish (A. spilauchen, D. lebretonis,
Epyplatys sp., Pellonula sp.) were found in “highly de- graded site” and in the “moderately degraded site”. Lar- ger sizes were found among Cichlidae, Mugilidae, Cla- riidae, Elopidae, Belonidae, Bagridae and Cynoglossi- dae.
3.5. Environmental Correlates
Table 3. Fish species composition, abundance, size range and mean, weight range and mean, and total weight of the man- grove fishes in the Benin coastal zone. Data are combined samples from cast net, seine, gill net and cross-lake fish trap.
Species families Total Num. SL range (mm) SL mean (mm) Weight range (g) Weight mean (g) Total weight (g)
Belonidae
Strongylura senegalensis 6 242 - 275 257.3 25 - 33 28.5 171
Bothidae
Citharichthys stampflii 86 30 - 130 79.7 0.5 - 50 10.8 933
Carangidae
Caranx hippos 88 50 - 82 64.6 2 - 50 7.6 671
Cichlidae
Sarotherodon melanotheron 2288 8 - 189 72.1 0.1 - 220 19.3 44,375
Tilapia zillii 109 47 - 175 83.1 4 - 250 31.5 3440
Tilapia guineensis 180 13 - 220 56.6 0.25 - 455 12.1 2182
Hemichromis fasciatus 367 15 - 158 74.1 0.1 - 150 16.5 6088
Hemichromis bimaculatus 102 21 - 67 36.3 0.3 - 15 2.5 253
Clariidae
Clarias gariepinus 5 215 - 440 279 65 - 520 203.6 1018
Claroteidae
Chrysichthys nigrodigitatus 107 62 - 275 118.7 4 - 420 41.5 4446
Clupeidae
Ethmalosa fimbriata 382 49 - 130 76.8 2 - 48 10 3832
Pellonula sp. 209 29 - 95 71 0.15 - 10 5 1061
Cynoglossidae
Cynoglossus senegalensis 2 313 - 315 314 86 - 94 90 180
Cyprinotontidae
Aplocheilichthys spilauchen 1082 14 - 83 31.4 0.1 - 5 1 1068
Epiplatys sp. 2 19 - 26 22.5 0.1 - 0.1 0.1 0.2
Eleotridae
Dormitator lebretonis 1199 19 - 80 51.8 0.2 - 13 3.8 4650
Kriba nana 39 21 - 65 35 0.3 - 9 1.4 56
Dormitator pleurops 1 30 - 30 30 0.8 - 0.8 0.8 0.8
Eleotris daganensis 2 93 - 93 93 21 - 25 23 46
Eleotris vitatta 7 78 - 155 97.8 9 - 100 54.5 205
Eleotris senegalensis 6 29 - 105 48.6 0.3 - 34 7 42
Eleotris sp. 77 30 - 180 85.8 0.5 - 190 24.2 1867
Elopidae
Elops lacerta 36 100 - 190 136.7 10 - 90 30.5 1101
Continued
Gerreidae
Gerres melanopterus 1018 7 - 118 59.8 0.1 - 30 6.2 6388
Gerres nigri 2 74 - 89 81.5 9 - 17 13 26
Gobiidae
Oxyurichthys occidentalis 87 43 - 130 95.2 2 - 31 12.5 1091
Progobius schlegeli 25 40 - 99 72.5 1 - 22 9.1 228
Lutjanidae
Lutjanus goriensis 11 30 - 118 62.4 3 - 70 14.7 162
Lutjanus agennes 4 48 - 72 57.7 4 - 13 6.5 26
Lutjanus sp. 4 60 - 114 83.5 5 - 144 20.3 81
Mochokidae
Synodontis sp. 1 93 - 93 93 14 - 14 14 14
Monodactylidae
Psettia sebae 9 27 - 55 41.6 2 - 15 9 81
Mugilidae
Liza falcipinnis 179 23 - 195 100.1 0.4 - 135 27.8 4979
Mugil curema 62 52 - 160 101.8 3 - 92 24.5 1521
Mugil bananensis 2 102 - 255 178.5 21 - 240 130.5 261
Mugil cephalus 1 163 - 163 63 92 - 92 92 92
Mugil sp. 25 77 - 162 102.7 9 - 76 24.5 612.5
Liza sp. 22 15 - 29 22.4 0.2 - 0.4 0.28 6.2
Ophichthyidae
Myrophis plumbeus 1 395 - 395 395 46 - 46 46 46
Dalophis sp. 1 475 - 475 475 32 - 32 32 32
Ophiocephalidae
Parachana obscura 1 240 - 240 240 220 - 220 220 220
Polynemidae
Galeoides decadactylus 2 50 - 78 64 3 - 10 6.5 13
Pomadasydae
Pomadasys jubelini 4 84 - 145 116 12 - 80 50 200
Pomadasys peroteti 1 92 - 92 92 13 - 13 13 13
Pomadasys sp. 11 57 - 113 83.4 6 - 40 16.1 117
Protopteridae
Protopterus annectens 1 340 - 340 340 165 - 165 165 165
Scombridae
Cybium sp. 1 14 88 - 120 108.2 8 - 20 14.8 208
Continued
Serranidae
Epinephelus aeneus 2 145 - 250 197.5 68 - 340 204 408
Syngnathidae
Microphis brachyurus
Aculeatus 5 100 - 116 108.2 0.5 - 3 1 5
Total number of families 25
Total number of genera 33
Total number of species 51
[image:8.595.58.540.297.676.2]Total number of individuals 7894
Table 4. Fish relative abundances and diversity indices by habitat type in the mangrove ecosystem of the Benin coastal zone. Highly degraded site and moderately degraded site exhibited lower indices.
Community features Highly degraded site Moderately degraded site Less degraded site Restored site Total
Number of families 10 10 18 20 25
Number of species 16 19 29 38 51
Abundance (Sample size) 487 720 2485 4202 7894
Relative abundance (%) 6.17 9.12 31.48 53.23 100
Total weight (g) 2015 5604.7 42369.8 45117.2 95106.7
Percentage weight (%) 2.12 5.89 44.55 47.44 100
Margalef index (D) 2.42 2.74 3.58 4.43 5.57
Shannon & weaver index (H’) 1.39 1.57 1.93 2.27 2.36
Evenness (J’) 0.50 0.53 0.57 0.62 0.60
[image:8.595.350.492.622.708.2]Figure 2. Fish abundance by family according to mangrove status in the Benin coastal zone. Families comprised a total of 33 genera and 51 species.
Figure 3. Size structure of Sarotherodon melanotheron (n = 2288) in the Benin mangrove zone.
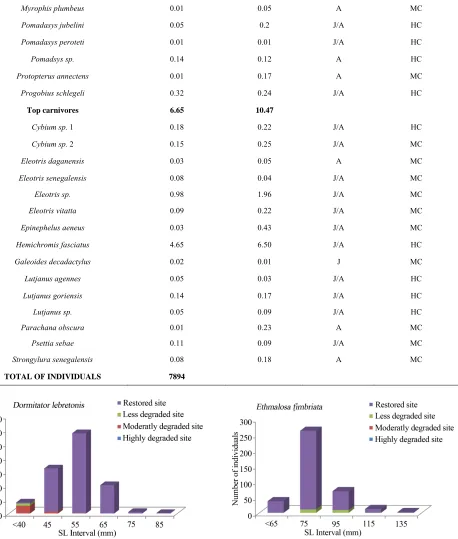
Table 5. Trophic categories, relative abundance and commercial importance of the fish caught in the mangrove ecosystem of the Benin coastal zone. J: juvenile; A: adult; HC: highly commercial; MC: moderately commercial; NV: no value.
Trophic category & Species Relative abundance (%) Total weight (%) Life history stage Fisheries importance
Detritivores 54.57 68.21
Chrysichthys nigrodigitatus 1.35 4.66 J/A HC
Dormitator lebretonis 15.19 4.89 J/A HC
Dormitator pleurops 0.01 0.0008 J MD
Kriba nana 0.49 0.06 J/A HC
Ethmalosa fimbriata 4.84 4.03 J/A HC
Liza falcipinnis 2.27 5.23 J/A HC
Liza sp. 0.29 0.007 J HC
Mugil curema 0.79 1.60 J/A HC
Mugil bananensis 0.02 0.27 J HC
Mugil cephalus 0.01 0.1 J HC
Mugil sp. 0.32 0.64 J/A HC
Sarotherodon melanotheron 28.98 46.66 J/A HC
Synodontis sp. 0.01 0.01 A MC
Planktinovores/microcarnivores 30.41 9.81
Aplocheilichthys spilauchen 13.71 1.22 J/A NV
Epiplatys sp. 0.02 0.0002 J ND
Gerres melanopterus 12.90 6.22 J/A HC
Gerres nigri 0.03 0.03 A HC
Oxyurichthys occidentalis 1.10 1.22 J/A HC
Pellonula sp. 2.65 1.12 J/A MC
Herbivores 3.66 5.91
Tilapia guineensis 2.28 2.29 J/A HC
Tilapia zillii 1.38 3.62 J/A HC
Intermediate carnivores 4.71 5.60
Caranx hippos 1.11 0.71 J/A HC
Citharichthys stampflii 1.09 0.98 J/A MD
Clarias gariepinus 0.06 1.17 A HC
Cynoglossus senegalensis 0.03 0.19 A MC
Dalophis sp. 0.01 0.03 A MC
Elops lacerta 0.46 1.66 A HC
Elops senegalensis 0.06 0.20 A HC
Hemichromis bimaculatus 1.29 0.27 J/A MC
Continued
Myrophis plumbeus 0.01 0.05 A MC
Pomadasys jubelini 0.05 0.2 J/A HC
Pomadasys peroteti 0.01 0.01 J/A HC
Pomadsys sp. 0.14 0.12 A HC
Protopterus annectens 0.01 0.17 A MC
Progobius schlegeli 0.32 0.24 J/A HC
Top carnivores 6.65 10.47
Cybium sp. 1 0.18 0.22 J/A HC
Cybium sp. 2 0.15 0.25 J/A MC
Eleotris daganensis 0.03 0.05 A MC
Eleotris senegalensis 0.08 0.04 J/A MC
Eleotris sp. 0.98 1.96 J/A MC
Eleotris vitatta 0.09 0.22 J/A MC
Epinephelus aeneus 0.03 0.43 J/A MC
Hemichromis fasciatus 4.65 6.50 J/A HC
Galeoides decadactylus 0.02 0.01 J MC
Lutjanus agennes 0.05 0.03 J/A HC
Lutjanus goriensis 0.14 0.17 J/A HC
Lutjanus sp. 0.05 0.09 J/A HC
Parachana obscura 0.01 0.23 A MC
Psettia sebae 0.11 0.09 J/A MC
Strongylura senegalensis 0.08 0.18 A MC
[image:10.595.80.538.110.649.2]TOTAL OF INDIVIDUALS 7894
Figure 5. Size structure of Dormitator lebretonis (n = 1199) in the Benin mangrove zone.
S. melanotheron was positively correlated with ph (r2 =
0.24) whereas the eleotrid D. lebretonis, abundant during the transitional season was negatively correlated with pH (r2 = 0.36) and dissolved oxygen (r2 = 0.10). H. fasciatus
Figure 6. Size structure of Ethmalosa fimbriata (n = 382) in the Benin mangrove zone.
was negatively correlated with temperature (r2 = 0.32).
The Gerreid, G. melanopterus was positively correlated with dissolved oxygen (r2 = 0.14), transparency (r2 = 0.15)
Figure 7. Size structure of Gerres melanopterus (n = 1018) in the Benin mangrove zone.
Figure 8. Size structure of Aplocheilichthys spilauchen (n = 1082) in the Benin mangrove zone.
tively correlated with dissolved oxygen (r2 = 0.16) and
salinity (r2 = 0.12).
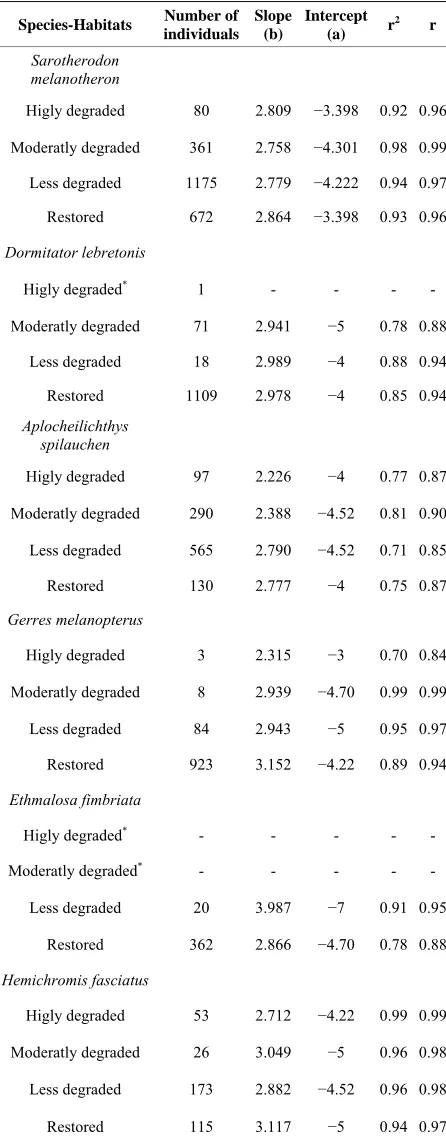
3.6. Length-Weight Relationships and Fish Condition
Total length-body weight regression equations were es- tablished to examine the conditions of the dominant fish species from different sites (Table 6). Overall, slopes
ranged between 2.23 for A. spilauchen at a highly de- graded site and 3.99 for E. fimbriata at a less degraded site with a significant (p < 0.05) “r” ranging between 0.84 and 0.99 indicating that the dominant species exhib- ited an allometric growth in the mangrove ecosystem. In general, the “highly degraded” and the “moderately de- graded” sites exhibited lower slopes whereas the “less degraded” and the “restored sites” had higher slopes.
3.7. Commercial Values of Fishes
[image:11.595.59.284.274.419.2]Relative to economic value of the fishes, I classified fishes in three categories according to their commercial value: 1) fishes of high commercial value (HC), 2) fishes of moderate commercial value (MC), and 3)
Table 6. Linear regressions (Log SL-Log W) by habitat type of the dominant fish species of the Benin mangrove ecosys- tem.
Species-Habitats Number of individuals
Slope (b)
Intercept (a) r
2 r
Sarotherodon melanotheron
Higly degraded 80 2.809 −3.398 0.92 0.96
Moderatly degraded 361 2.758 −4.301 0.98 0.99
Less degraded 1175 2.779 −4.222 0.94 0.97
Restored 672 2.864 −3.398 0.93 0.96
Dormitator lebretonis
Higly degraded* 1 - - - -
Moderatly degraded 71 2.941 −5 0.78 0.88
Less degraded 18 2.989 −4 0.88 0.94
Restored 1109 2.978 −4 0.85 0.94
Aplocheilichthys spilauchen
Higly degraded 97 2.226 −4 0.77 0.87
Moderatly degraded 290 2.388 −4.52 0.81 0.90
Less degraded 565 2.790 −4.52 0.71 0.85
Restored 130 2.777 −4 0.75 0.87
Gerres melanopterus
Higly degraded 3 2.315 −3 0.70 0.84
Moderatly degraded 8 2.939 −4.70 0.99 0.99
Less degraded 84 2.943 −5 0.95 0.97
Restored 923 3.152 −4.22 0.89 0.94
Ethmalosa fimbriata
Higly degraded* - - - - -
Moderatly degraded* - - - - -
Less degraded 20 3.987 −7 0.91 0.95
Restored 362 2.866 −4.70 0.78 0.88
Hemichromis fasciatus
Higly degraded 53 2.712 −4.22 0.99 0.99
Moderatly degraded 26 3.049 −5 0.96 0.98
Less degraded 173 2.882 −4.52 0.96 0.98
Restored 115 3.117 −5 0.94 0.97
*Linear regression equations have not been determined because there were
fishes with no commercial value (NC) and not utilized as food and were not sold in the fish market. From the fish sampled, about 74% had a high economic value, from which 74% were juveniles and adults (Table 5). Only
three species (A. spilauchen, Epyplatys sp., Mycrophis brachyurus aculeatus)of small sizes had no commercial value.
3.8. Mangrove Resource Utilization and Degradation Sources
Classic ecological role of mangrove are to provide nurs- ery ground, food, shelter etc. However, survey in grass- roots village at the coastal zone, revealed that mangroves are destroyed in many villages for firewood, building houses and to make space for local salt industries. In fisheries, mangrove was massively destroyed to build “Akadja”, a fisheries park of branches installed in the lagoon and utilized to attract fishes [9]. Though at small scale, some fish ponds have been built in the mangrove habitats for aquaculture. Also, adjacent wetlands colo- nized by Paspalum vaginatum, were intensively utilized to grow legumes, onions, carrots, red papers, tomatoes, etc. causing pesticides and fertilizers intrusion and habi- tat pollution. Organic pollution occurs nearby the fish- ermen village through a daily dumping of huge domestic wastes. The overexploitation of fish resources was caused by the increasing fishermen population and the use of various fishing gears. For example, the use of the cross-lake fish traps, less selective was very detrimental for species survival. Another major source of degradation was the hydro electrical dam constructed on the Mono River to provide the two countries, Togo and Benin, with electricity.
4. Discussions
4.1. Physical Conditions
Though the combined effects of the physical parameters determine aquatic habitat quality, the seasonal variability of the salinity (0‰ - 35‰) appears to be one of the ma- jor factor affecting the coastal lagoon conditions and ichtyofaunal structure and distribution [8]. This variabil- ity depends on factors such as seasons (wet, transitional, dry), distances of the sites from the Mouth River, flood intensity and tides [7]. Indeed, salinities from sites close to the tidal pass were always high and oceanic (Djondji village: 31‰ - 33‰). On the contrary, the water quality was predominantly freshwater (Grand-Popo village: 0‰ - 6‰) at sites close to the Mono River mouth. Laegds- gaard & Johnson [8], Williamson et al. [30], Yanez-Ar- ancibia et al. [31] and Vance et al. [3] have reported the same trends for the subtropical mangroves in eastern Australia, inshore habitats of Raby Bay, Queensland,
Terminos Lagoon in Mexico, and for the mangrove forest in northern Australia, respectively. Though recorded wa- ter features were globally favorable for the growth and survival of the fish resources, however, the low depths and transparencies, the acid pH, and the relatively high temperatures (Table 2) recorded at the “highly degraded
site” and at “moderately degraded site” were critical for optimal growth of the fish resources.
4.2. Fish Community Structures
The present study consistently showed that the computed community structure indices were lower for the “highly degraded site” and “moderately degraded site” and high- er indices were recorded in “less degraded site” and “re- stored site” (Tables 3 and 4). This result evidenced the
negative impact of the mangrove destruction on the fish community structure and, probably on the whole biodi- versity. Moreover, the fish composition of the man- grove ecosystem of Benin is greatly dominated by ma- rine-estuary species whereas the number of typically riv- ers fish species was reduced. Indeed, on a total of 51 fish species inventoried, only 11 species (20%) originated from the Mono River and the remaining (80%) originated from the marine/estuarine environment. This situation was probably due to the recent evolution of the coastal lagoon water quality, caused by the construction of a hydro electrical dam on the Mono River which has pro- foundly modified the hydrological system and flooding regime, with a probable modification of the fish commu- nity structure [12]. Nevertheless the results obtained fol- low the general pattern of the mangrove habitats charac- terized by relatively high species richness. For example, 87 species were inventoried in the bay of Martinique Island [32], 80 in Terminos Lagoon of the Gulf of Mex- ico [31], 53 in the Moreton Bay in eastern Australia [8], and 44 in the Raby Bay [29], including common families (Mugilidae, Clupeidae, Gerreidae, Carangidae, Gobiidae, Ludjanidae, Eleotridae, Elopidae, Belonidae, Serranidae Pomadasidae, Monodactylidae etc.) recorded in the Be- nin coastal fish community [7,25,27].
With regard to species, the cichlid, S. melanotheron
dominated the Benin mangrove fish assemblage with a numeric relative abundance of 29%. This trend is typical for the Benin brackish waters (Lake Nokoue, Lagoon of Porto-Novo, and Lake Aheme) where S. melanotheron
mostly in open water during flooding. Indeed, during wet season, this species reproduces and inhabits mangrove root systems and muddy vegetated habitats, and when the flooding occurs, they are flushed abundantly in the open water. A. spilauchen (13.71%), of small size, dominated the mangrove fringe to avoid high water current and predation, and G. melanopterus (12.90%) dominated the Adjacent open water. Like the other aquatic ecosystem, intensive multi-species fishery occurred at the Benin coastal lagoon where about 94% of the fish species was exploited.
The trophic guilds depicted in the fish community of the Benin coastal zone, partially reflected the fragmen- tized habitats of the degraded mangrove ecosystems which were consistently and numerically dominated by the detritivores (54.57%) and the planktinovores/micro- carnivores (30.41%) fish species. Laegdsgaard & John- son and Halliday & Young [8,25] reported similar trends of trophic structures in mangrove-lined estuaries where detritivores and planktinovores/microcarnivores were nu- merically among the major trophic categories in Moreton Bay and in the Tin Can Bay of Australia. Probably, there has been an evolutionary process of the mangrove fish communities in association with the major available food, namely detritus and planktons [26,34,35]. That is, fishes have evolved to better exploit the large mass of man- grove leaves which falls and decays in permanence in the coastal zone system generating a huge amount of sub- strate and planktons [36-38]. Such substrate harbors plenty of biotic and abiotic foods. In contrast, the abun- dance of top-carnivores tended to be reduced (6.65%) even though the number of species was relatively high, indicating a degree of predation in the mangrove zone (Table 5).
The study consistently revealed that the fish assem- blages of the Benin mangrove ecosystem were dominated by juvenile individuals. As reported by Laegdsgaard & Johnson [8], mangrove habitats are unique in their func- tion as nurseries and many fish species enter estuaries as post larvae and juveniles. In the Alligator Creek in Aus- tralia, Roberston & Duke [7] reported a high abundance of post-larvae, juveniles and small adults in the man- grove area. In addition to the role of nursery, small sizes fish prefer calm and shallow environment to avoid high current and predation. Nevertheless, the overfishing, combined with the destruction of the mangrove, could act to modify the fish community structure of the mangrove habitats with dominance of small sizes. In general, the dominant species exhibited variation in size according to habitats. Indeed, one-way ANOVA on the standard length (SL) of the dominant fish species from different study sites, indicated that the SL, across the four habitats (“highly degraded”, “moderately degraded”, “less de-
graded”, “restored”), were significantly different (p ≤ 0.0001). The calculted F-values, along with degrees of freedom and p-values were F3,2287 = 120.298, p = 0.0001
for S. melanotheron, F3,366 = 57.224, p = 0.0001 for H. fasciatus, F3,1198 = 324,361, p = 0.0001 for D. lebretonis, F3,1017 = 48.984, p = 0.0001 for G. melanopterus, and F1,1081 = 14.847, p = 0.0001 for A. spilauchen. Overall,
for the six dominant species, higher sizes were found in the less degraded and restored habitats (Figures 2-7).
However, no significant difference (F1,381 = 3.164, p =
0.08) was found in the size of E. fimbriata occurring only in the less degraded and restored sites (Figure 5).
4.3. Degradation Impacts
The multiple utilization of the mangrove may be quail- fied as an ecological disaster causing, a reduction and loss of nursery grounds and shelters, a modification of habitats conditions and changes in mangrove faunal composition [34]. Like trends reported for lagoon Toho in southern Benin [5], at some locations, the mangrove cutting has favored, low water depth, sediment loading, shallow and muddy bottom. Consequently, these chang- ing habitat conditions, coupled with the high tempera- tures, high turbidities and oxygen depletion have lead to a progressive colonization of some sites by a grass, P. vaginatum, precursor of terrestrial formation, thus re- ducing the coastal lagoon area with the loss of habitats and inhabiting biodiversity.
Also, the hydro electrical dam had greatly modified the Mono River flooding regime with a reduction of the water volume released in the coastal lagoon system. This situation has led to a reduction of inundated plains with changes in water quality, mainly salinity [12]. Conse- quently, the species composition is being modified: on a total of 51 species collected from the coastal zone, only 11 species (20%) originated from the Mono River and the remaining (80%), originated from the marine-estua- rine environment. As a result, fish composition tends to be greatly dominated by marine-estuary fishes whereas the number of rivers fish species was reduced. Also, the reduction of inundated plain may affect the nursery grounds and shelters, with a change in fish reproduction success, recruitment and a probable decrease of the fish abundance. During our collection, most fishermen com- plain about the impact of the hydro electrical dam on the fish production. According to them, some species such as
D. lebretonis (Eleotridae), which reproduce and grow in the mangrove and vegetation, required the flooding in their life cycle to be abundant and catchable in the open water. The absence of some freshwater species such as
drology of the Mono River, combined with mangrove degradation has profoundly modified the ecological status of the Benin coastal zone, including changes in fish community structure.
4.4. Management Implications and Conclusions
This investigation provide valuable information on man- grove fishes of the Benin coastal zone especially habitat conditions, species composition, distributional pattern of the fishes, disturbance and removing of major habitat for fishes, and overall degradation issues. Also, the research has revealed the great importance of the coastal zone when considering its multiple utilization and the fish resources inhabiting this ecosystem. In addition to the mangrove degradation, the most distinctive feature of the Benin mangrove-lined estuary was the modification of the Mono flooding regime which greatly affects the hy- drology of the coastal zone and the living aquatic re- sources.
To date, little is known about the diversity and rich- ness of the Mono River and the impacts of the hydro electrical dam built on this river [12]. Thus, there is a great need of biological and ecological research on the Mono River and ecosystem response from the construc- tion of hydro electrical dam. Nevertheless, based on the present investigation, an integrated approach of man- grove resource management is required for ecosystem restoration. This program should include 1) pursuing mangrove restoration (planting) program in a participa- tory approach with grassroots mainly fishermen, 2) sea- grass (Cyperus articulatus) plantation to increase the nursery grounds, 3) plantation of trees for firewood to lessen mangrove cutting for fuel and other domestic utilization, 4) making the mangrove zone as protected area or a reference selected site as a sanctuary /classified zone, 5) developing ecological sound ecotourism in- volving grassroots to reduce pressure on mangrove eco- system resources, 6) strengthening and re-enforcing regulation about fishery activities, 7) supporting the fish- eries and aquaculture of the mangrove oyster, Crass- ostrea sp., the freshwater prawn, Macrobrachium sp., peneids shrimps, crabs (Callinectes sp., Cardiosoma sp.), inhabiting the mangrove zone to increase grassroots re- venue and to reduce fishing pressure, 8) developing an integrated environmental education program and 9) de- veloping an environment monitoring program to peri- odically assess the health of the mangrove ecosystem.
5. Acknowledgements
Research funding was provided by the International Foundation for Science (IFS). We express our gratitude to the anonymous reviewers for reviewing the earlier
version of the manuscript. We especially thank Mrs. Ingella Taxell from IFS for her permanent assistance and Rene Djessou for helping during the survey.
REFERENCES
[1] F. K. E. Nunoo, E. Sossoukpe, A. Adite and E. D. Fiogbe, “Foods Habits of Two Species of Pseudotolithus (Sciani- dae) off (West Africa) near Shore Waters and Implica- tions for Management,” International Journal of Fisher- ies and Aquaculture, Vol. 5, No. 6, 2013, pp. 142-151. [2] R. L. Welcomme, “Fisheries Ecology of Floodplain Riv-
ers,” Longman, New York, 1979.
[3] D. J. Vance, M. D. Haywood, D. S. Heales, R. A. Kenyon and N. R. Loneragan, “How Far Prawns and Fish Move into Mangroves? Distribution of Juvenile Banana Prawns,
Penaeus merguiensis and Fish in a Tropical Mangrove Forest in Northern Australia,” Marine Ecological Pro- gress Series, Vol. 131, 1996, pp. 115-124.
[4] G. W. Thayer, D. R. Colby and W. F. Hettler Jr., “Utili- zation of the Red Mangrove Prop Root Habitat by Fishes in South Florida,” Marine Ecological Progress Series, Vol. 35, 1987, pp. 25-38.
[5] A. Adite, “Fishery Ecological Survey of Natural Coastal Lakes of Benin, West Africa,” Master of Sciences Thesis, Texas A&M University, College Station, 1995.
[6] A. Roberston and N. C. Duke, “Mangrove as a Nursery Sites: Comparisons of the Abundance and Species Com-position of Fish and Crustaceans in Mangroves and Other near Shore Habitats in Tropical Australia,” Marine Biol-ogy, Vol. 96, No. 2, 1987, pp. 193-206.
[7] W. N. Tzeng and Y. T. Wang, “Structure, Composition and Seasonal Dynamics of the Larval and Juvenile Fish Community in the Mangrove Estuary of Tanshui River, Taiwan,” Marine Biology, Vol. 113, No. 3, 1992, pp. 481-
[8] P. Laegdsgaard and C. R. Johnson, “Mangrove Habitats as Nurseries: Unique Assemblages of Juvenile Fish in Subtropical Mangroves in Eastern Australia,” Marine Ecological Progress Series, Vol. 126, No. 1-3, 1995, pp.
[9] R. L. Welcomme, “A Description of Certain Indigenous Fishing Methods from Southern Dahomey,” African Jour- nal of Tropical Hydrobiology and Fisheries, Vol. 1, No. 2, 1971, 129-140.
[10] A. Adite and R. Van Thielen, “Ecology and Fish Catches in Natural Lakes of Benin, West Africa,” Environmental Biology of Fishes, Vol. 43, No. 4, 1995, pp. 381-391.
[11] P. Lalèyè, C. Niyonkuru, J. Moreau and G. G. Teugels, “Spatial and Seasonal Distribution of the Ichthyofauna of Lake Nokoué, Benin, West Africa,” African Journal of Aquatic Science, Vol. 28, No. 2, 2003, pp. 151-161.
Oyster Farming in the Coastal Ecosystem of Southern Benin (West Africa): Environment, Growth and Contri-bution to Sustainable Coastal Fisheries Management,”
International Journal of Development Research,Vol. 3, No. 10, 2013, pp. 087-094.
[13] H. Lopez-Fernandez, K. O. Winemiller, A. Adite, D. A. Arrington and C. A. Layman, “Freshwater Fish Diversity in Benin, West Africa, and Challenge for Its Conserva- tion,” Proceedings University of Abomey-Calavi Confer- ence African Fish and Fisheries, Abomey-Calavi, 2003, pp. 85-86.
[14] C. Levêque, D. Paugy and G. G. Teugels, “The Fresh and Brackish Water Fishes of West Africa,” Tome 1, Editions ORSTOM/MRAC, Paris, 1990.
[15] C. Levêque, D. Paugy and G. G. Teugels, “The Fresh and Brackish Water Fishes of West Africa,” Tome 2, Editions ORSTOM/MRAC, Paris, 1990.
[16] M. Holden and W. Reed, “West African Freshwater Fish,” Longman Group Ltd. London, 1972.
[17] R. H. Lowe McConnell, “Fish Communities in Tropical Freshwaters,” Longman, London, 1975.
[18] R. H. Lowe McConnell, “Ecological Studies in Tropical Fish Communities,” Cambridge University Press, Cam- bridge, 1987.
[19] R. Margalef, “Perspective in Ecological Theory,” Univer- sity of Chicago Press, Chicago, 1968.
[20] C. Shannon and E. Weaver, “The Mathematical Theory of Communication,” University of Illinois Press, Urbana, 1963.
[21] C. J. Krebs, “Ecological Methodology,” Harper & Row Publishers, New York, 1989.
[22] B. McCune and M. J. Mefford, “Multivariate Analysis of Ecological Data. Version 2.0. MJM Software Design,” Gleneden Beach, Oregon, 1995.
[23] S. J. M. Blader and T. G. Blader, “Factors Affecting the Distribution of Juvenile Estuarine and Inshore Fish,”
Journal of Fish Biology, Vol. 17, No. 2, 1980. pp. 143- 162.
[24] R. M. Morton, “Community Structure, Density, and Stand- ing Crop of Fishes in a Subtropical Australian Mangrove Area,” Marine Biology, Vol. 105, No. 3, 1990, pp. 385-
394.
[25] I. A. Halliday and W. R. Young, “Density, Biomass and Species Composition of Fish in a Subtropical Rhizophora stylosa Mangrove Forest,” Marine Freshwater Resources, Vol. 47, No. 4, 1996, pp. 609-615.
[26] A. Adite and K. O. Winemiller, “Trophic Ecology and Ecomorphology of Fish Assemblages in Coastal Lakes of
Benin,” Ecoscience, Vol. 4, No. 1, 1997, pp. 6-23. [27] A. Adité, K. O. Winemiller and E. D. Fiogbe, “Ontoge-
netic, Seasonal; and Spatial Variation in the Diet of Het- erotis niloticus (Osteoglossiformes: Osteoglossidae) in the Sô River and Lake Hlan, Benin, West Africa,” Envi-ronmental Biology of Fishes, Vol. 73, No. 4, 2005, pp.
367-378.
[28] G. A. Morgan, O. V. Grieggo and G. W. Gloekner, “SPSS for Windows: An Introduction to Use and Inter- pretation in Research,” Lawrence Erlbaum Associates, Publishers, Mahwah, 2001.
[29] F. W. Tesh, “Age and Growth,” In: W. E. Ricker, Ed., Methods for Assessment of Fish Production in Fresh Wa- ters, Blackwell Scientific Publication, London, 1971. [30] I. Williamson and C. B. King Mather, “A Comparison of
Fish Communities in Unmodified and Modified Inshore Habitats of Raby Bay, Queensland,” Estuarine, Coastal and Shelf Sciences, Vol. 39, No. 4, 1994, pp. 401-411.
[31] A. Yanez-Arancibia, A. Lara-Dominguez and J. W. Day Jr., “Interactions between Mangrove and Sea Grass Habi- tats Mediated by Estuarine Nekton Assemblages: Cou- pling of Primary and Secondary Production,” Hydrobi-ologia, Vol. 264, No. 1, 1993, pp. 1-12.
[32] M. Louis, C. Bouchon and Y. Bouchon-Navaro, “Spatial and Temporal Variations of Mangrove Fish Assemblages in Martinique (French West Indies),” Hydrobiologia, Vol. 295, No. 1-3, 1995, pp. 275-284.
[33] GCLME, “Guinea Current Large Marine Ecosystem Re- port,” GEF/UNIDO/UNDP/UNEP/US-NOAA, 2006. http://Projects.csg.uwaterloo.ca/inweh/content/1188 [34] S. H. Bowen and B. R. Allanson, “Behavioral and Tro-
phic Plasticity of Juvenile Tilapia mossambica in Utiliza- tion of the Unstable Littoral Habitat,” Environmental Bi- ology of Fishes, Vol. 7, No. 4, 1982, pp. 357-362. [35] K. O. Winemiller, “Spatial and Temporal Variation in
Tropical Fish Trophic Network,” Ecological Monographs, Vol. 60, No. 3, 1990, pp. 331-367.
[36] S. H. Bowen, “Detrivory in Neotropical Fish Communi- ties,” Environmental Biology of Fishes, Vol. 9, No. 2, 1983, pp. 137-144.
[37] K. O. Winemiller, “Ecomorphological Diversification in Lowland Freshwater Fishes,” National Geographic Re- search & Exploration, Vol. 8, No. 3, 1992a, pp. 308-327. [38] K. O. Winemiller, “Fish Assemblages across a Complex,