Pursuing Inflation Targeting Policy
Framework in the Midst of Inflationary
Pressures and Fiscal Constraint in
Indonesia
Siregar, Reza
IMF-Singapore Regional Training Institute
30 January 2009
Online at
https://mpra.ub.uni-muenchen.de/18791/
Pursuing Inflation Targeting Policy Framework in the Midst of
Inflationary Pressures and Fiscal Constraint in Indonesia
Reza Siregar*
International Monetary Fund – Singapore Regional Training Institute
January 2009
Abstract:
Pushing for a higher and a more robust growth while maintaining price stability within a target range of inflation continue to be core tasks for the macroeconomic policy management in Indonesia in recent years. Whilst inflation was successfully kept below the target of 7 percent at the end of 2007, the monthly year on year inflation has already gone above 10 percent by May 2008 and is expected to reach 11 percent by end of 2008. Fiscal policy continues to be relatively marginalized and lacks of stimulus, with a significant share of the current expenditure of the 2008 budget has to be allocated to finance subsidy and debt service. Our study investigates the commitment of the country to its inflation targeting (IT) policy in the midst of fiscal constraint and the urgent need to push for higher growth rate. It examines preliminary outcomes of the IT policy and highlights dilemmas and potential policy trade-offs.
JEL Classification: E31, E52, E62 and E63
Key Words: Inflation Targeting Policy; Expenditure Policy; Inflation; and Fiscal
Constraint
---
1. Motivation
The 10th aniversary of Soeharto’s resignation saw the Indonesian economy retuned to
a more robust growth rate. Speaking to lawmakers ahead of the country’s Independence day,
President Susilo Bambang Yudhoyono delivers its administration’s growth target for 2009 at
around 6.2 percent.1 International reserve holding of the country was reported to be closed to
US$60 billion in July 2008 or around 14 percent of GDP.
One of the key recent challenges to achieve these goals has been the volatilities of the
commodity prices in the global market. Persistent inflationary pressure has continued to loom
and shadow sound economic performance in the country, particularly between the last
quarter of 2007 and the third quarter of 2008 (Figure 1). Largely driven by the rapid
increases in food and energy prices, the rise in inflation has had a wide range of ramifications
on the domestic economy. Last quarter of 2008, however, saw the softening of the
commodity prices in the world market with the eventual full impacts should only be felt in
the domestic economy by early 2009.
In this study, we are mainly interested in investigating potential havocs that the
volatile domestic price level has on the management of key macroeconomic policies, namely
fiscal and monetary policy in Indonesia. In particular, our study examines the challenges
facing the implementation of the inflation targeting policy in the midst of inflationary
pressure and fiscal constraint confronting the domestic economy.
This paper proceeds as follows. Next section discusses the implementation of the
inflation targeting (IT) policy in the country. In this section, an empirical testing on the
1
monetary policy reaction function will be carried out to probe the nature and commitment of
Bank Indonesia in pursuing its IT policy. A review of a number of preliminary performance
indicators on the IT policy will be presented in Section three. In Section four, we turn our
attention to what has arguably been considered as the most urgent challenges facing the
emerging markets in Asia since 2007, including Indonesia, namely the unstable prices of key
commodities at the world market and their impacts on the local inflation rate. We will
analyze the consequence of the inflationary pressure on the implementation of the IT policy
both from its direct or first round effect and also from the indirect or second round effect via
the fiscal/budget front. A number of potential concerns and dilemmas facing the coordination
of monetary and fiscal objectives in the near future will be discussed as well in this section.
The conclusion section ends the paper.
2. Inflation Targeting (IT) Policy in Indonesia: Basic Features and Commitment
2.1 Brief Motivation and Basic Features of IT policy in Indonesia2
Following the new Central Bank Act, the UU No.23/1999 enacted on May 17, 1999
and as amended by Act No.3 of 2004, the ultimate goal of Bank Indonesia (BI) is to achieve
and maintain the stability of rupiah (Article 7), which is reflected in the inflation rate and
exchange rate. Nonetheless, BI had only officially launched its IT policy as its new monetary
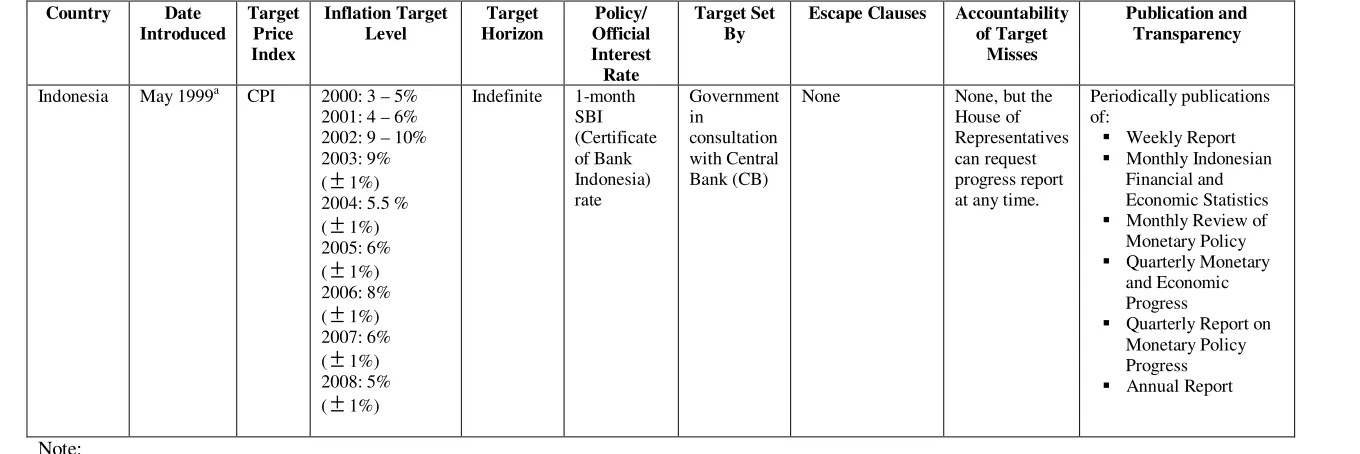
policy framework in July 2005 (Table 1). With the Central Bank Act of 1999, Bank
Indonesia gained its independence, and with that Act it is answerable to the parliament.
Furthermore, to enhance the transparency of its policy, a number of official publications and
2
press reports are released on a regular basis to update various key economic indicators and
most importantly to offer reviews and analyses on the latest inflation trends.
Among the reasons that prompt BI to move away from the past base money targeting
framework to the current IT framework are:
i. the unstable relationships between base money, output, and as well as price
level, especially due to the structural changes in the post-crisis period,
ii. the growing difficulties in controlling base money,
iii. the growing success of other IT countries in reining in inflation without
increasing output volatility, and
iv. the need to strengthen the credibility of BI as the monetary authority.
Under the IT framework, the inflation target represents the overriding monetary
objective set by the Indonesian government after the coordination with BI. The government
has gradually increased the headline inflation target from 3-5% in 2000 to 9±1% in 2003
before revising the headline inflation target downward to 5±1% for 2008 (Table 1). The
setting of these intermediate targets is consistent with the desire to achieve a medium to
long-term inflation rate of 3% such that the country can remain competitive with its Asian
neighbors.
In order to increase the effectiveness of monetary policy signals as well as to provide
greater certainty to market players and the public, the BI rate is initially chosen as the
signaling interest rate instrument for Bank Indonesia. The BI rate is determined during the
quarterly or monthly Board of Governors’ meeting in respond to the outlook for the
operations3 to ensure that the weighted average of 1-month Certificate of Bank Indonesia
(SBI) rate formed in the Open Market Operations (OMOs) auctions remains at around the
level of the BI rate. The 1-month SBI rate is then expected to influence interest rates on the
interbank money market and longer-term interest rates. BI began issuing its own debt in the
form of SBI to manage the money supply since 1984.
2.2 Monetary Policy Rule and Commitment to IT Framework
2.2.1 Monetary Policy Reaction Function
How committed has Bank Indonesia been in pursuing its IT policy? One way to
address this question is by examining the monetary policy rule of the central bank during the
pre- and the post-IT period. Taylor in his seminal 1993 paper proposes a very specific and
simple monetary policy rule, where the central bank adjusts its key interest rate in a smooth
manner responding to the changes in the expected inflation and output gap. His study and
many others have argued that the domestic monetary policy does not systematically respond
to external shocks.4 Others however challenge the exclusion of the exchange rate in the
optimal monetary policy rule. Svensson (2000) for instance argues the need to allow for the
3
The monetary control operations take place through the use of the following instruments: (i) Open Market Operations (OMOs), (ii) standing facilities; (iii) foreign exchange market intervention, (iv) establishment of the minimum statutory reserve requirement, and (v) moral suasion. The most important monetary control instrument is the OMOs.
4
indirect and direct exchange rate transmission channel in the optimal monetary policy
reaction function.
For our study, there are a number of compelling reasons to explicitly account for the
role of the exchange rate variable in the monetary policy reaction function. To start with,
external shocks are transmitted largely through exchange rate movements in small open
economies, such as Indonesia. More importantly, Bank Indonesia had officially and
unofficially adopted rigid exchange rate policy regimes in the past. Hence, by including the
exchange rate variable, we can examine whether the monetary authority in Indonesia
continued to place a significant weight on the exchange rate variable during the IT-period.
To test the monetary policy reaction function of Bank Indonesia, we modified an
approach introduced by Clarida, Gali and Gertler (1998), henceforth refer to as the CGG
approach that can be generally defined as:5
t n i i t i n i i t i t i n i i t i t i n i i t i
t r E E y y q
r =ω+ ρ ∆ + δ π + φ − + ζ ∆ +ε
∆
∑
−1−∑
− +1−∑
( − +1− *)∑
−1− (1)Where: ∆rt is the interest rate adjustment or change; Etπt+1 and Etyt+1 are expected
inflation and output for period (t+1), respectively, conditioned on information set available
at time )(t ; ( *)
y is the potential output;
(
qt−i)
denotes the lagged real effective exchange rate.)
(∆ is a measure of monthly periodical change or fluctuation. The rise in(∆q)implies a
depreciation of the local currency. ,δ φand ζ are the parameters determining the central
5
bank’s response to expected inflation, expected output gap and exchange rate volatility,
respectively.
Equation 1 indicates that key central bank interest rate will be determined by the past
levels of interest rate adjustment and exchange rate volatility, and the past and present level
of expected inflation rate and expected output gap. Based on the significance and the size of
the estimate coefficients of ρ,δ,φ and ,ζ we can analyze the relative weights of these key
economic indicators on the monetary policy rule of the country. Theoretically, we would
expectδ, andφ ζ to be all positive. The rise in the inflation expectation should lead to the
tightening of the monetary policy. Similarly, rising expected output gap
*)
(Et−iyt+1−i − y should result in stronger inflationary pressure, and therefore requires tighter
monetary policy stance. Lastly, the rise in (∆q)should trigger stronger imported inflation and
warrants an upward adjustment in the key interest rate.
2.2.2 Markov-Switching Approach
To compare and contrast the experiences and the shifts in the policy rules under the
pre- and post-IT periods, past studies, in general, separated the sample observations into two
sets, the pre- and the post-IT periods based on the pre-determined starting dates of the IT
policy. This approach however would lead to potential problem with the degree of freedom.
For the case of Indonesia in particular, we will have only a very small number of
observations to carry out any testing for the post-crisis period as the country only officially
adopted the IT policy in July 2005.
To avoid the above shortcomings, we will employ the Markov-Switching (MS)
observations into two sample sets as it is designed to pick out changes in the generating
mechanism of a series. In our case, the changes in the central banks’ operating rule will
almost for sure affect the stochastic process of the short-term interest rate in Equation 1.
Furthermore, the dynamic of the interest rate may change from the period of stability to that
of volatility.6
In short, there are several advantages of adopting the MS-VAR approach to test
Equation 1.
• The MS approach allows the coefficient estimates to change over time (time variant) in response to possible switches in the policy. Thus, the shifts in the parameter estimates of the key variables should reveal any changes in the policy commitments and the priorities of the monetary authority during the pre-IT and the post-IT periods.
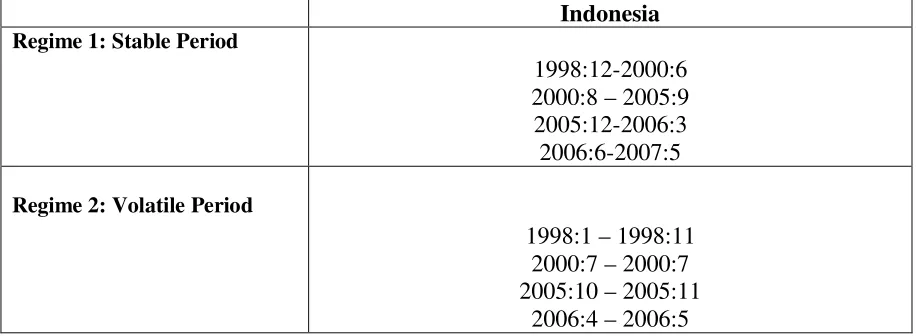
• The test results disclose the type of regimes (low (stable) and high (volatile) regimes) that the IT period falls under, and allow us to analyze whether the implementation of the IT only occurs under one particular regime. The period of stable regime is the one with smaller standard error.
• The IT policy is credible if and only if the role of expected inflation is significant under both stable and volatile regimes. That is to say for the policy to be credible, the central bank must be committed to address expected inflationary pressure under both
stable and less conducive economic environment.7
Prior to conducting the MS-VAR testing, the expected output gap (Etyt+1 −y*) and
6
The switching VAR framework is essentially extending Hamilton's (1989) Markov-switching regime framework to the Vector Autoregressive (VAR) systems (see Krolzig, 1997; Valente, 2003). Our study considers three types of MS-VAR models that allows for either regime shifts in intercept term, variance-covariance matrix or autoregressive terms.
7
the expected inflation (Etπt+1)variables in Equation 1 have to be estimated. Following
Valente (2003), the expected rate of inflation can be obtained using a preliminary signal
extraction procedure. This process would extract the unobservable expected rate of inflation
from the observed rate of inflation by applying the law of iterated projections following the
Kalman filter technique.
To estimate the expected output gap variable, we adopt two stages of estimation:
• The Hodrick and Prescott (1997) filtering approach is employed to obtain a smooth estimate of the long-run trend component of the industrial production (IP) index as proxy for output. The gap between the actual IP index and its long-run trend component would give us the proxy of the actual output gap at time ).(t
• Next, we employ the Kalman filtering technique, as described earlier, to estimate the expected output gap (Etyt+1 −y*).
For the sake of brevity, the estimates for the expected inflation and the output gap will not be
reported.
2.2.3 Commitment to Inflation Targeting Framework in Indonesia
In its various official reports, Bank Indonesia has indicated its commitment to
implement flexible IT, rather than strict IT policy approach. We consider the implementation
of the IT policy to be strict, if the following conditions are satisfied:
a) Following Svensson (2000), the coefficient estimates of all key factors (inflationary expectation, exchange rate volatility and output gap) must be significant and theoretically consistent during both stable and volatile periods.
b) The coefficient estimate for the expected inflation is relatively larger than the coefficient estimates for the other two economic variables (exchange rate volatility and output gap) and should have the most significant t-statistics.
If however only condition (a) is met, then we have the case of flexible IT regime.
discretionary space for the monetary authority to place the largest and most significant
weight to other factors, such as output stability, rather than to price stability. In an extreme
case where an IT country places a significant weight only on inflation variable, then this
country, according to literature, is following IT rule rather than framework. Lastly, if none
of the above conditions is met, then IT policy has not been enforced.
Applying the markov-switching approach to the monetary policy reaction function
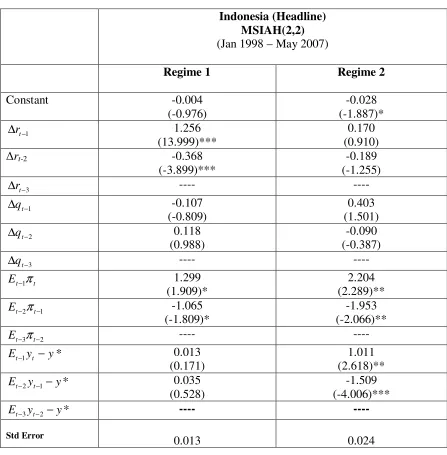
(Equation 1) discussed earlier, the test results demonstrate that a mixed strategy has actually
been adopted by the monetary authority in Indonesia (Tables 2 and 3).8 During the stable
period of the IT era, Bank Indonesia adopted an IT rule where the adjustments in the Bank
Indonesia’s policy were directed solely to keep inflation expectation in check. During the
turbulent period however, Bank Indonesia shifted its policy course to a framework, where in
addition to expected inflation, output gap has also been considered as a target of its policy
rate adjustments.
In short, the test results posted in Tables 2 and 3 confirm that Bank Indonesia has
been committed to the IT policy. Next, we turn to review a number of preliminary
performance indicators of the IT policy in the country.
3 Preliminary Performance Indicator
3.1 Pre and Post-IT Headline Inflation
8
Containing the headline inflation within the target range continues to be a taxing task
for Bank Indonesia (Table 1 and Figure 1). From July 2005 (the official date of the IT
policy) to May 2008, the monthly year on year headline rates were less than the maximum IT
target ranges only from October 2006 to December 2007 (Figure 2). The much-needed move
by the government to reduce subsidy on different gasoline products in March 2005
contributed significantly to the jump in the inflation rate starting August 2005.9 A period of
stern tightening of the monetary policy, with one month certificate bank Indonesia (SBI)
hovering well above 12 percent for about 8 consecutive months, had successfully brought
back the headline rate below the target range only in October 2006.
However, it remains to be seen whether Bank Indonesia will have a higher success
rate in achieving its inflation target in the future. Comparing the average monthly year on
year inflation during three years before (t−3) the adoption of the IT policy to the average
inflation rate for three years post-IT period (t+3), we find the rate for the pre-IT period at
around 7.4 percent is clearly well below the post-IT number of 10.2 percent. During the five
months of 2008, the monthly year on year headline inflation rates were averaging around to
2.5 percent above the IT maximum target range.
3.2 Pass-through Effects
Another commonly used indicator to assess the performance of the IT policy is the
pass-through rate ---measuring the impact of exchange rate fluctuation on local inflation.
9
Taylor (2000) argues that the extent of a pass-through decline is highly influenced by the
strong commitment of the monetary authority toward price stability. Supporting Taylor’s
claim, Gagnon and Ihrig (2004) tested a sample of advanced nations and found that the
decline in the pass-through has been related to the changes in the monetary policy
procedures, and in particular, to the adoption of inflation targeting. To test the impact of the
IT policy on the pass-through effects, we adopt the following empirical model introduced by
Edwards (2006) 10:
(
∆)
+ + ∆ + ∆ + ∆ + = ∆∑
∑
∑
∑
= − = − = − = − n i i t i n i i t i n i i t i n i i t it E P P E DIT
P 1 4 1 3 1 * 2 1 1
0 log log log log *
log β β β β β
(
t i)
ti P DIT ε
β ∆ +
∑
5 log − * (2)Where:
• Pt is a domestic price index. The rate of change of the CPI is a proxy for the inflation rate.
• Etis the nominal effective exchange rate (an increase implies a nominal depreciation of the local currency).
• *
t
P is a world price index. The change of this index captures the rate of world inflation. The US consumer price index is going to be adopted here as a proxy.
• DITis a dummy variable for Inflation Targeting regime. It is equal to zero before the adoption of the inflation target in the country, and equals to one otherwise.
Several fundamental assessments can be derived from the regression outcomes on
Equation 2:
10
• The first one is the pre-IT short-run pass through, captured by
∑
β1. We wouldexpect
∑
β1 to be equal or greater than zero, i.e. a depreciation of the nominal effective exchange rate(
∆logE >0)
would lead to a rise in the inflation(
∆logP>0)
, and vice versa.• The second one is the post-IT short run pass-through
(
∑
β1+∑
β4)
. If(
∑
β4 <0)
, the pass through effect for the post-IT period is lower than that of the pre-IT. Hence, we find evidence to support Taylor (2000) that a more inflationary-focused policy such as IT should reduce pass through.• The third one is the pre-IT long-run pass through, estimated as .
1 3 1 −
∑
∑
β β Similarto the short-run pre-IT pass through, we would expect the long-run pre-IT pass through to be positive.
• The next one is the long-run pass through estimates for the post-IT period,
(
)
+ − +∑
∑
∑
∑
5 3 4 11 β β
β β
.
• >
−
∑
∑
3 1 1 β β(
)
+ − +∑
∑
∑
∑
5 3 4 11 β β
β β
implies that the adoption of the IT policy has
reduced the long-run pass through effects.
•
∑
β5 >0 suggests that inflation inertia has risen in the local economy. The rise (fall) in inflation inertia may contribute as well to the rise (fall) in the long-run passthrough during the post-IT as compared to the pre-IT period.
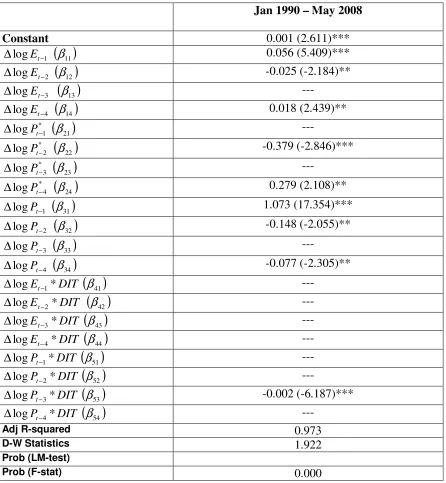
We apply the Autoregressive Distributed Lags (ARDL) testing on Equation 2, with
the general to specific approach of Hendry (1976). Our data sets cover the period from
January 1990 to May 2008, extending the observation set of Siregar and Goo (2008) which
stops only up to June 2007. In contrast to the result of Siregar and Goo (2008), our test result
(Table 4).11 The estimate coefficient for
(
∑
β4)
is found to be insignificant. This findingseems to support the general trend of the headline inflation discussed before. Headline
inflation has not been abating in the post-IT period and the IT policy has not been able to
reduce the pass-through impacts in the local economy.
The test result however shows that the adoption of IT policy in the country has
suppressed inflation inertia, albeit on very moderately. The estimate coefficient of
(
∑
β5)
isreported to be -0.002, suggesting a drop in the inflation inertia due to IT policy, albeit only
mildly compare to the coefficient estimate of inflation inertia, as captured by
∑
β3 , ataround 0.848 (=1.073-0.148-0.077). In summary, the preliminary outcomes of the IT policy
in Indonesia have not been encouraging. However future testing, with significantly more
observation sets, is clearly warranted to generate more conclusive and robust results.
4. Present Challenges to the Implementation of the IT policy
4.1 Inflationary Pressure: Is it purely a supply side?
The conventional wisdom advocates that the effectiveness of the monetary policy
depends to some extent on the source and nature of the economic shocks that the economy is
facing. In particular, many argue that monetary policy is a demand management tool, and
therefore it is less suitable in dealing with supply shocks. This entails further investigation on
the sources of the recent rise of inflation in Indonesia. If indeed, the driver of the rising
11
inflationary pressure has largely been from the supply side, then we could argue that the less
than encouraging outcomes of the IT policy discussed earlier should be largely expected.
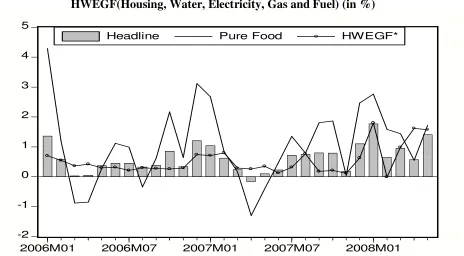
Looking at its composition, there are evidences of both dominant demand and supply
shocks contributing to the recent surge of the headline inflation in the country. Figure 3
compares and contrasts the headline inflation against its two dominant drivers during its
recent surges. The monthly headline inflation from January 2006 to May 2008 has in average
been at around 0.6 percent, significantly lower than the average monthly increase in the food
price at around 1.1 percent, and was closely matched by monthly rise in the HWEGF
(housing, water, electricity, gas and fuel) price indices at 0.5 percent for the same period.12
The strong inflationary pressures for both components of the headline inflation have largely
been blamed on the supply shortages of the food and energy commodities in the world
market, starting in 2005 and picking up a much more rapid phase in 2007. This phenomena
provides grounds to claim that monetary policy will not be the appropriate tool to address the
recent inflationary pressures.
However, we would argue that the supply side shocks do not fully explain the
double-digit inflation in recent months in Indonesia. The rapid growth of commercial bank credits,
especially during the first half of 2008, substantiates the contribution of the demand side
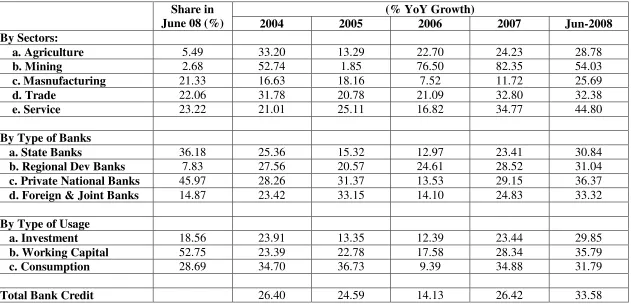
factor on the overall price increase (Table 5). It is also important to note that the relatively
high share of the consumption usage of the credits, both in 2007 and 2008 ---confirming a
robust demand side of the economy. The role of the demand shock in recent months has also
12
been captured by the gap between the core and headline inflations (Figure 4). During the first
three quarters of 2006, the monthly year-on-year headline inflation was averaging at least 6
percent higher than that of the core inflation, reflecting the supply shock due to oil price and
the cut in the fuel subsidy in March and October 2005.13 This is not true however since 2007,
where the annualized monthly core inflation moved closely with the headline and narrowed
the gap between them to around 0.5 percent.
4.2 Falling Behind the Curve
There have also been debates over the tendency for many central banks in this region,
including Bank Indonesia, to fall behind the curve in its policy decisions to rein in
inflationary expectation in recent years. As discussed earlier, one of the key features of the IT
policy is the forward looking strategy of the central bank. An increase in the policy rate of
Bank Indonesia is highly recommended under the presence of rising expected inflation, and
thus avoiding the negative real interest rate (nominal – expected inflation). The negative real
interest rates are therefore often considered as evidence of monetary policy “falling behind
the curve” (ADB (2008a)).
Figures 1 and 2 demonstrate that the headline inflation rates were successfully kept
under the IT maximum target when the policy rates (the one month central bank certificate
(SBI)) were held well above the headline inflation. In contrast, the inflation rate was higher
than the target range when the SBI rate was kept significantly below the headline inflation
rate (contributing to the negative real rate). In fact, Bank Indonesia continued to lower the
13
policy rate in 2007, and the last cut of 25 basis point was in December 2007 when the
headline inflation had started to increase (Figure 2).
One plausible explanation for the strategy of keeping low real interest rate can be
extracted by extending the markov-switching test results of the monetary policy reaction
function posted in Tables 2 and 3. As discussed, balancing the need to support economic
growth (the output gap variable) and addressing inflationary pressure (the expected inflation
variable) has been the stragety of Bank Indonesia during relatively more volatile period in
both global and domestic economies up to mid-2007. We assume that this IT framework
strategy is being continously pursued during the recent episode of sub-prime crisis in
2007-2008. Raising the policy rate at a modest phase should help keep the cost of investment
moderate, but in the presence of strong inflationary pressure a modest hike in the policy rate
may not be sufficient to keep real interest rate in a positive range, and thus is unlikely to be
adequate to dampen the price surge. Consequently, the local currency may experience
depreciating pressure, and thus resulting in higher imported inflation (higher pass-throughs).
This balancing task to support growth and contain inflation unfortunately will likely
to be a more challenging one in the near future. In September 2008, Bank Indonesia raised its
key policy rate by 25 basis point to 9.25 percent. This policy move is taken in response to
persistent inflationary pressure domestically. From January to August 2008, the headline
inflation reached 9.5 percent, significantly higher than 6.5 percent for the same period in
2007. However, this policy faced numerous criticisms, questioning its appropriateness in the
midst of the forecasted softening of the economic growth due to the global economic
4.3 Potential Fiscal Dominance Concern
The experience of Brazil in 2002-2003 demonstrates the importance of sound fiscal
position for the effective implementation of the inflation targeting policy in a country.
Givazzi (2003) reviews the events taken place in Brazil in early 2000s and shows that the rise
in the credit risk was the center of the mechanism through which the local central bank
temporarily lost its control of the inflation. The high risk premium was driven by the high
public debt level at around 60 percent of GDP, and predominantly short-term and US-dollar
denominated.14 Under this poor fiscal condition, a rise in the interest rate to deal with
inflation could instead lead to the weakening of the local currency, and thus trigerring an
even stronger inflationary pressure. In short, monetary policy becomes an ineffective policy
tool.
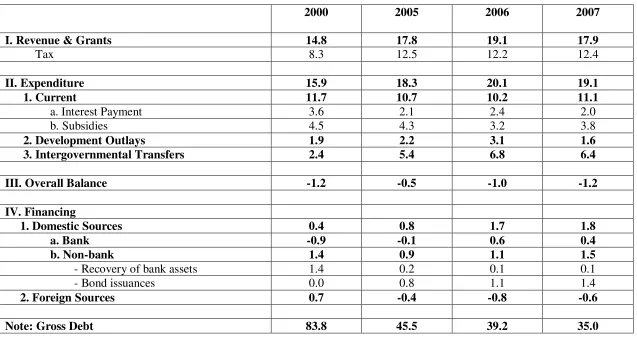
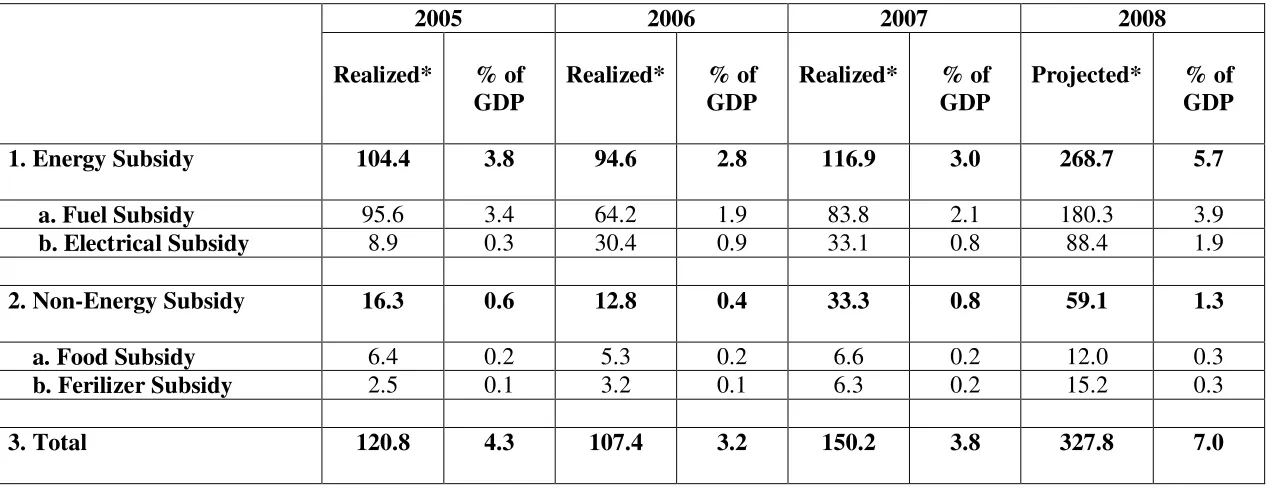
Turning to the case of Indonesia, the primary fiscal concern in this country during the
past one year has been with the cost of subsidy in the central government’s budget, in
particular with the energy subsidy (Tables 6 and 7). The rise of crude oil price in the global
market is expected to balloon the fiscal cost of subsidy from less than 4 percent of GDP in
2007 to around 7 percent of GDP in 2008. Already more than 50 percent of the current
expenditure of the central government budget has been allocated for mandatory spending, i.e.
for debt service (or interest payment) and subsidy in 2007, this number is expected to rise by
another 50 percent in 2008. Even more alarming, the funding allocated to subsidy alone has
14
more than tripled the spending on much needed development outlays/ capital spending by the
end of 2007 (Table 6).
Despite a number of pragmatic policy moves to reduce energy subsidies since 2005,
the levels of subsidies in Indonesia remain among the highest in the region.15 The prices of
key fuel commodities in Indonesia, such as gasoline and diesel, were the lowest in the region
(Figures 5 and 6). It has been estimated that the average price of diesel and gasoline in
Indonesia was hovering around 60 cents per liter in June 2008, compared to over 80 cents in
China and Malaysia, $1 in India, $1.2 in Thailand, $1.5 in Singapore and $1.8 in Korea
during the same period.
Facing the likelihood that the fiscal cost of subsidy continue to be high in the near
future, it is likely, as officially projected by the Ministry of Finance for 2008 and 2009
budget, that the overall budget deficit for these two years would likely to remain at above 1.0
percent of GDP, meeting the commitment to maintain an overall fiscal deficit at less than 2
percent of GDP. If we go by the experiences of the past few years, one of the primary sources
of funding for the central government budget has been the issuance of government bonds
(Table 6). The reliance on the bond financing further emphasizes the urgency to manage
domestic price stability in Indonesia. Failure to anchor inflation leads to a higher credit risk
premium, and therefore a rise in the expected yield for future bonds issued by the
government and private firms in the country. In short, this implies more costly financing of
the fiscal deficit, as recent events have shown.
15
In early September 2008, the Ministry of Finance (MOF) had to scrap its rupiah bond
auction due to the high yield that investors asked. The MOF had hoped to raise around Rp3
trillion (or around US$321 million at that time) from the auction of zero coupon and fixed
rate bonds. The government offered around 9.5 – 10.5 percent yields, but investors were
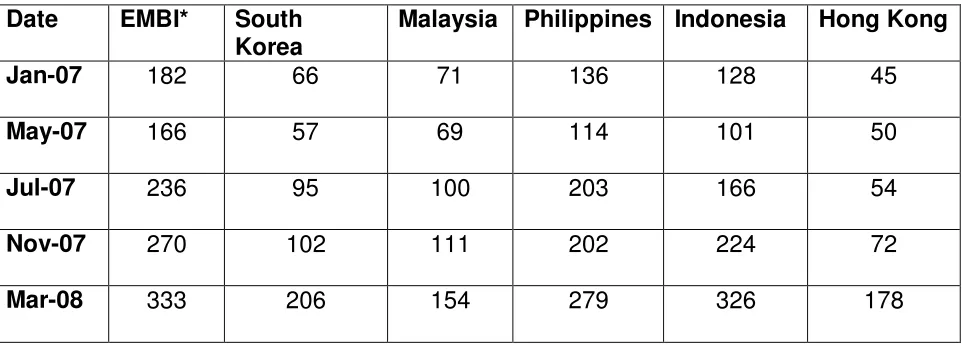
asking for 13.5 percent. The high asking bond yield reflects the rising credit risk as shown by
the Emerging Market Bond Index (EMBI) (Table 8).16 A failure to raise money from the
domestic bond may force the government to sell foreign currency debt, which they did twice
already during the first half of 2008. This however would expose the budget to volatile
foreign exchange market, and thus possibly to an even more costly of deficit financing. In
turn, the weaker budget could lead to a depreciation pressure in rupiah and thus a further
climb in inflationary pressure.
5. Concluding Remarks
As with the implementation of the inflation targeting policy in the other parts of the
world, Bank Indonesia sees the IT policy as an integral part of its effort to strengthen its
policy credibility. Borrowing the test results of Siregar and Goo (2008) on the monetary
policy reaction function (Equation 1), there are evidences of the IT policy being fully
pursued in the country. However, our study demonstrates that the outcomes of the IT policy
remain marginal to say the least.
16
Furthermore, we also highlighted potential challenges facing the effectiveness of the
IT policy in the near future. The volatile prices of key commodities, such as fuel and food,
remain one of the key challenges for the policy makers in the world, including in Indonesia.
It poses challenges for Bank Indonesia as the swings in the prices of these commodities will
adversely impact domestic economy directly, or known as the first round effect, through the
uncertainty in the general price level. In addition, it will have secondary effects as well, such
as through the expenditure side of the central government budget.
As much as the macroeconomic policies can help stabilize and promote economic
growth in the domestic economy, the recent experiences of the Indonesian economy
illustrates the need to go beyond the management of the macroeconomic policy. Balancing
the objective of keeping inflation moderate and generating quality economic growth requires
structural reforms in many sectors of the economy to accompany adjustments in both
monetary and fiscal policies. One of the primary objectives of these reforms is to boost
investment by improving the overall investment climate in the local economy. This is an
issue that is not covered in this paper, but it has been highlighted by a number of recent
Reference:
Asian Development Bank (ADB) (2008a), Asia Economic Monitoring, July (www.aric.adb.org).
Asian Development Bank (ADB) (2008b), “Reasons to be Nervous: Commodity Prices and Inflation”, the Asian Development Outlook, March.
Aglionbay, J. and Oakley, D. (2008), “Jakarta Bond Sale Failure Reflects Fears About Emerging Markets”, Financial Times, September 10.
Bernanke, B. and Mishkin, F.S. (2007), “Inflation Targeting: A New Framework for Monetary Policy?” in Mishkin (ed), Monetary Policy Strategy, The MIT Press, Cambridge, Massachusetts, USA.
Campa, J.M. and Goldberg, L.S. (2002), “Exchange Rate Pass-Through into Import Prices: A Macro or Micro Phenomenon?,” NBER Working Paper, No. 8934, May.
Clarida, R. (2001), “The Empirics of Monetary Policy Rules in Open Economies”,
International Journal of Finance and Economics, 6(4), pp. 315-323.
Clarida R., Gali, J., and Gertler, M. (1998), “Monetary Policy Rules in Practice: Some International Evidence”, European Economic Review, 42(6), pp. 315-323.
Chadha, J.S., Sarno, L., and Valente, G. (2004), “Monetary Policy Rules, Asset Prices, and Exchange Rates”, IMF Staff Papers, Vol.51, No. 3.
Corbo, V., Landerretche, O., and Schmidt-Hebbel, K. (2001), “Assessing Inflation Targeting After a Decade of World Experience”, International Journal of Finance and
Economics, 6, pp.343-368.
Edwards, S. (2006). “The Relationship Between Exchange Rates and Inflation Targeting Revisited,” NBER Working Paper, No.12163, April.
Gagnon, Joseph E. and Jane Ihrig (2004). “Monetary Policy and Exchange Rate Pass- Through,” International Journal of Finance and Economics, 9(4), pp. 315-338. Giavazzi, F. (2003). “Inflation Targeting and the Fiscal Policy Regime: The Experience in
Brazil”, Bank of England Quarterly Bulletin, Autumn.
Hamilton, J.D. (1989), “A New Approach to the Economic Analysis of Nonstationary Time Series and the Business Cycle”, Econometrica, 57(2), pp.357-384.
Hamilton, J. and Susmel, R. 1994, ‘Autoregressive Conditional Heteroscedasticity and Changes in Regime’, Journal of Econometrics, vol. 64, pp. 307-333.
Hendry, D.F. (1976). The structure of simultaneous equations estimators. Journal of Econometrics, 4, 51-88.
Hodrick, R.J. and Prescott, E.C. (1997), “Postwar U.S. Business Cycles: An Empirical Investigation”, Journal of Money, Credit and Banking, Vol. 29, No. 1 (February) , pp. 1-16.
Jha, S. (2008), “Indonesia: Inflation Up, Rally in Bonds Over!”, Emerging Market Research, Barclay Capital, 30 July.
Krolzig, H.-M. (1997). Markov Switching Vector Autoregression. Berlin: Springer-Verlag. OECD(2008), Indonesia Economic Assessment, July.
Siregar, R. and Goo, S. (2008), “Inflation Targeting Policy: The Experience of Indonesia and Thailand”, CAMA Working Paper, No.23, the Australian National University, July (http://cama.anu.edu).
Inward Investment: Perspectives from the Indonesian Experience during the Post-1997 Financial Crisis”, in R. Kumar and R. Rajan (eds), Intra-Asian FDI Flows: Magnitudes, Trends, Prospects and Policy Implications. World Scientific Press (forthcoming).
Svensson, L.E.O. (2000), “Open Economy Inflation Targeting”, Journal of International Economics, 50(1), pp. 155-183.
Taylor, J. B. (2000), “Low Inflation, Pass-Through, and the Pricing Power of Firms,”
European Economic Review, 44(7), pp. 1389-1408.
Taylor, J.B. (2001), “The Role of the Exchange Rate in Monetary-Policy Rules”, American Economic Review, Vol. 91, No.2, Papers and Proceeding of the Hundred Thirteenth Trehan, B. and Wu, T. (2007), “Time-Varying Equilibrium Real Rates and Monetary Policy
Analysis”, Journal of Economic Dynamic & Control, 31, pp. 1584-1609. Valente, G. (2003), “Monetary Policy Rules and Regime Shifts”, Applied Financial
Table 1:
Implementation and Design of Inflation Targeting Framework
Country Date Introduced Target Price Index Inflation Target Level Target Horizon Policy/ Official Interest Rate Target Set By
Escape Clauses Accountability of Target
Misses
Publication and Transparency
Indonesia May 1999a CPI 2000: 3 – 5% 2001: 4 – 6% 2002: 9 – 10% 2003: 9% (±1%) 2004: 5.5 % (±1%) 2005: 6% (±1%) 2006: 8% (±1%) 2007: 6% (±1%) 2008: 5% (±1%)
Indefinite 1-month SBI (Certificate of Bank Indonesia) rate Government in consultation with Central Bank (CB)
None None, but the House of Representatives can request progress report at any time.
Periodically publications of: Weekly Report Monthly Indonesian Financial and Economic Statistics Monthly Review of Monetary Policy Quarterly Monetary and Economic Progress
Quarterly Report on Monetary Policy Progress Annual Report
Note:
a) Indonesia adopted inflation targeting policy formally in July 2005.
Indonesia (Headline) MSIAH(2,2)
(Jan 1998 – May 2007)
Regime 1 Regime 2
Constant -0.004
(-0.976)
[image:26.612.66.513.91.546.2]-0.028 (-1.887)*
1
−
∆rt 1.256
(13.999)***
0.170 (0.910)
rt-2 -0.368
(-3.899)***
-0.189 (-1.255)
3
−
∆rt ---- ----
1
−
∆qt -0.107
(-0.809)
0.403 (1.501)
2
−
∆qt 0.118
(0.988)
-0.090 (-0.387)
3
−
∆qt ---- ----
t t
E−1π 1.299
(1.909)* 2.204 (2.289)** 1 2 − − t t
E π -1.065
(-1.809)* -1.953 (-2.066)** 2 3 − − t t
E π ---- ----
*
1y y
Et− t − 0.013
(0.171)
1.011 (2.618)** *
1
2y y
Et− t− − 0.035
(0.528)
-1.509 (-4.006)*** *
2
3y y
Et− t− − ---- ----
Std Error
0.013 0.024
Note:
The numbers inside ( ) are the t-statistics. ***, **, and * denote significance at 1%, 5% and 10% respectively. T-test critical values: at 1% = 2.66; at 5%=2.00 and at 10% =1.67.
Indonesia
Regime 1: Stable Period
1998:12-2000:6 2000:8 – 2005:9 2005:12-2006:3
2006:6-2007:5
Regime 2: Volatile Period
1998:1 – 1998:11 2000:7 – 2000:7 2005:10 – 2005:11
2006:4 – 2006:5
[image:27.612.66.524.112.280.2]Jan 1990 – May 2008
Constant 0.001 (2.611)***
1
log −
∆ Et
( )
β11 0.056 (5.409)***2
log −
∆ Et
(
β12)
-0.025 (-2.184)**3
log −
∆ Et
(
β13)
---4
log −
∆ Et
(
β14)
0.018 (2.439)*** 1
log −
∆ Pt
(
β21)
---* 2
log −
∆ Pt
(
β22)
-0.379 (-2.846)**** 3
log −
∆ Pt
(
β23)
---* 4
log −
∆ Pt
(
β24)
0.279 (2.108)**1
log −
∆ Pt
(
β31)
1.073 (17.354)***2
log −
∆ Pt
(
β32)
-0.148 (-2.055)**3
log −
∆ Pt
(
β33)
---4
log −
∆ Pt
(
β34)
-0.077 (-2.305)**DIT Et * log −1
∆
(
β41)
---DIT Et * log −2
∆
(
β42)
---DIT Et * log −3
∆
(
β43)
---DIT Et * log −4
∆
(
β44)
---DIT Pt * log −1
∆
(
β51)
---DIT Pt * log −2
∆
(
β52)
---DIT Pt * log −3
∆
(
β53)
-0.002 (-6.187)***DIT Pt * log −4
∆
(
β54)
---Adj R-squared 0.973
D-W Statistics 1.922
Prob (LM-test)
Prob (F-stat) 0.000
[image:28.612.70.516.97.580.2]Table 5: Commercial Bank Credits and Allocations, 2004-2008
Share in June 08 (%)
(% YoY Growth)
2004 2005 2006 2007 Jun-2008
By Sectors:
a. Agriculture 5.49 33.20 13.29 22.70 24.23 28.78
b. Mining 2.68 52.74 1.85 76.50 82.35 54.03
c. Masnufacturing 21.33 16.63 18.16 7.52 11.72 25.69
d. Trade 22.06 31.78 20.78 21.09 32.80 32.38
e. Service 23.22 21.01 25.11 16.82 34.77 44.80
By Type of Banks
a. State Banks 36.18 25.36 15.32 12.97 23.41 30.84
b. Regional Dev Banks 7.83 27.56 20.57 24.61 28.52 31.04
c. Private National Banks 45.97 28.26 31.37 13.53 29.15 36.37
d. Foreign & Joint Banks 14.87 23.42 33.15 14.10 24.83 33.32
By Type of Usage
a. Investment 18.56 23.91 13.35 12.39 23.44 29.85
b. Working Capital 52.75 23.39 22.78 17.58 28.34 35.79
c. Consumption 28.69 34.70 36.73 9.39 34.88 31.79
Total Bank Credit 26.40 24.59 14.13 26.42 33.58
Table 6: Budget Operations of Central Government, 2000-2007
(in % of GDP)
2000 2005 2006 2007
I. Revenue & Grants 14.8 17.8 19.1 17.9
Tax 8.3 12.5 12.2 12.4
II. Expenditure 15.9 18.3 20.1 19.1
1. Current 11.7 10.7 10.2 11.1
a. Interest Payment 3.6 2.1 2.4 2.0
b. Subsidies 4.5 4.3 3.2 3.8
2. Development Outlays 1.9 2.2 3.1 1.6
3. Intergovernmental Transfers 2.4 5.4 6.8 6.4
III. Overall Balance -1.2 -0.5 -1.0 -1.2
IV. Financing
1. Domestic Sources 0.4 0.8 1.7 1.8
a. Bank -0.9 -0.1 0.6 0.4
b. Non-bank 1.4 0.9 1.1 1.5
- Recovery of bank assets 1.4 0.2 0.1 0.1
- Bond issuances 0.0 0.8 1.1 1.4
2. Foreign Sources 0.7 -0.4 -0.8 -0.6
Note: Gross Debt 83.8 45.5 39.2 35.0
Table 7: Subsidy
2005 2006 2007 2008
Realized* % of
GDP
Realized* % of
GDP
Realized* % of
GDP
Projected* % of
GDP
1. Energy Subsidy 104.4 3.8 94.6 2.8 116.9 3.0 268.7 5.7
a. Fuel Subsidy 95.6 3.4 64.2 1.9 83.8 2.1 180.3 3.9
b. Electrical Subsidy 8.9 0.3 30.4 0.9 33.1 0.8 88.4 1.9
2. Non-Energy Subsidy 16.3 0.6 12.8 0.4 33.3 0.8 59.1 1.3
a. Food Subsidy 6.4 0.2 5.3 0.2 6.6 0.2 12.0 0.3
b. Ferilizer Subsidy 2.5 0.1 3.2 0.1 6.3 0.2 15.2 0.3
3. Total 120.8 4.3 107.4 3.2 150.2 3.8 327.8 7.0
Table 8: Emerging Market Bond Index (EMBI)
Date EMBI* South Korea
Malaysia Philippines Indonesia Hong Kong
Jan-07 182 66 71 136 128 45
May-07 166 57 69 114 101 50
Jul-07 236 95 100 203 166 54
Nov-07 270 102 111 202 224 72
Mar-08 333 206 154 279 326 178
Note: *The Emerging Market Bond Index (EMBI) captures the spread between the yield of the emerging market bond and that of the US treasury bond.
4 6 8 10 12 14 16 18 20
2005M01 2005M07 2006M01 2006M07 2007M01 2007M07 2008M01
HEADLINE IT MAX-TARGET
[image:33.612.77.554.88.335.2]Source: Bank Indonesia Data Base
Figure 2: Monthly Year-on-Year Headline Inflation and 1-month SBI rate (in %)
4 6 8 10 12 14 16 18 20
2005M01 2005M07 2006M01 2006M07 2007M01 2007M07 2008M01
HEA DLINE SBI1MTH
[image:33.612.81.518.414.651.2]4 6 8 10 12 14 16 18
2006Q1 2006Q3 2007Q1 2007Q3 2008Q1
9.7 9.8 9.6
9.5
6.3
6.0
5.6 5.8
6.2
7.5
8.4
CORE HEADLINE
[image:34.612.74.548.77.335.2]Source: Bank Indonesia website
Figure 4: Monthly Inflation for Headline, Food, and HWEGF(Housing, Water, Electricity, Gas and Fuel) (in %)
-2 -1 0 1 2 3 4 5
2006M01 2006M07 2007M01 2007M07 2008M01
Headline Pure Food HWEGF*
[image:34.612.74.538.395.651.2](as end of June-2008; in USD/litre; including tax and refining margin) 0 0.2 0.4 0.6 0.8 1 1.2 1.4 1.6 1.8 2 Chi na Indi a Indo nes ia Kor ea Mal aysi a Phili ppin es Sin gapo re Taiw an Thai land
[image:35.612.76.527.105.332.2]Source: Jha (2008).
Figure 6: Diesel Prices Across Asia
(as end of June-2008; in USD/litre; including tax and refining margin)
0 0.2 0.4 0.6 0.8 1 1.2 1.4 1.6 1.8 2 Chi na Indi a Indo nesi a Kore a Mal aysi a Phili ppin es Sing apor e Taiw an Thai land
[image:35.612.77.546.420.641.2]