PARAMETRIC STUDY ON THE DESIGN OF BAFFLE FOR THREE-DIMENSIONAL TURNING DIFFUSER
NUR HAZIRAH BINTI NOH @ SETH
A thesis submitted in
fulfillment of the requirement for the award of the Doctor of Philosophy
Faculty of Mechanical and Manufacturing Engineering University Tun Hussein Onn Malaysia
iii
To my husband Mohd. Salehin Hj. Mazelan, My better half,
Who helped me through thick and thin in this entire adventure
To my son Muhammad Nur Uwais Mohd Salehin, My heaven and earth,
Who gave me strength to complete this thesis
To my heartbeat,
Zaiton Hj. Hashim, Hjh. Saleha Hj. Jaman and Hj. Mazelan Hj. Yusoff Who always pray for my success
Last and foremost,
iv
ACKNOWLEDGEMENT
I would like to express my sincere appreciation to my supervisor, Dr. Norasikin Mat Isa for all the guidance and support throughout the entire duration in completing this thesis. Thank you so much.
Credit should also be given to UTHM Aerodynamic Lab technician, Mr. Zainal for his cooperation and Dr. Normayati who taught me on hands on practical of PIV before running the experiment myself. Appreciation also goes to other PhD candidatures who keep on inspiring me; Zila, Najwa, Rasidi, Kak Syikin, Fatimah, Mun and many others. Thanks for the advices and help along the journey. May success be with all of us, all the time, Amiin.
v
ABSTRACT
vi
ABSTRAK
Aliran menengah yang terbentuk di rantau dinding dalam penyerap getaran akan menyebabkan prestasi menurun dari segi liputan tekanan (Cp) dan keseragaman
aliran (σu). Pengenalan sesekat dapat membantu dalam mengurangkan aliran
menengah dan memperbaiki prestasi penyerap getaran. Oleh itu, struktur aliran dalam penyerap getaran 3 dimensi dengan sesekat dikaji dan kesannya terhadap prestasi penyerap getaran dsiasat. Eksperimen ke atas sesekat bentuk aerofoil permulaan yang diuji dengan nombor alir masuk Reynolds (Rein) di antara
4.527E+04 – 1.263E+05 telah dijalankan, menghasilkan liputan tekanan Cp=0.341,
dimana ianya diukur dengan menggunakan tekanan menoreh yang disambung ke Manometer digital, dicatatkan apabila sistem beroperasi dengan nombor Reynolds paling tinggi yang iaitu Rein=1.263E+05. Keputusan ini menunjukkan peningkatan
sehingga 43% daripada kajian lepas iaitu Cp=0.194 pada nombor Reynolds yang
sama. Keseragaman aliran, yang diukur menggunakan Particle Image Velocimetry (PIV) juga menunjukkan peningkatan sebanyak 33% daripada kajian lepas pada Rein=9.950E+04 iaitu σu=3.09 jika dibandingkan dengan kajian lepas iaitu σu=4.64.
vii
CONTENTS
TITLE i
DECLARATION ii
DEDICATION iii
ACKNOWLEDGEMENT iv
ABSTRACT v
ABSTRAK vi
CONTENTS vii
LIST OF TABLES xi
LIST OF FIGURES xiv
LIST OF SYMBOLS xxii
LIST OF ABBREVIATIONS xxiv
LIST OF APPENDICES xxvi
CHAPTER 1 INTRODUCTION 1
1.1 Research background 4
1.2 Problem Statement 6
1.3 Objectives of study 7
1.4 Scope of study 7
1.5 Significance of study 8
viii
CHAPTER 2 LITERATURE REVIEW 11
2.1 Diffuser applications and turning diffuser theoretical
background 12
2.2 Experimental rig development on low subsonic wind tunnel
feature 16
2.3 Various baffles design 25
2.4 PIV instrumentations 33
2.5 Numerical analysis solutions 35
CHAPTER 3 METHODOLOGY: EXPERIMENTAL APPROACH 41
3.1 Experimental method 42
3.1.1 Experimental setup 42
3.1.2 Centrifugal blower 43
3.1.3 Settling chamber and screens 45
3.1.4 Contraction cone 46
3.1.5 Rectangular duct 47
3.1.6 Turning diffuser with airfoil baffle 48
3.1.7 Initial condition measurement 50
3.1.8 Pressure recovery and efficiency measurement 54
3.2 PIV measurement and instrumentation 57
3.2.1 2D PIV setup 59
3.2.2 3D PIV setup 60
3.2.3 Tracer particle seeding 62
3.2.4 Illumination 64
3.2.5 Photographing 66
3.2.6 Image processing 70
CHAPTER 4 METHODOLOGY: NUMERICAL METHOD 73
4.1 Description of the whole system 74
4.2 Mathematical model 74
4.3 Computational domain 76
4.4 Domain discretization 77
ix
4.6 Solver and solution algorithm 82
4.7 Convergence criteria 84
CHAPTER 5 EXPERIMENTAL DATA ANALYSIS 89
5.1 Design of baffles 90
5.2 Measurement of initial condition 92
5.3 Measurement of static pressure recovery 93 5.4 Flow structure in three-dimensional turning diffuser 95 5.5 Outlet flow uniformity, σout measurement 111
5.6 Turning diffuser efficiency 120
CHAPTER 6 NUMERICAL DATA ANALYSIS 123
6.1 Numerical work on 2D turning diffuser with baffles 123
6.1.1 Computational domain 124
6.1.2 Domain discretization 124
6.1.3 Flow structure in two-dimensional turning diffuser with baffles 126 6.2 Numerical work on 3D turning diffuser with baffle 130
6.2.1 Computational domain 130
6.2.2 Domain discretization 131
6.2.3 Flow structure in the three-dimensional turning diffuser with
baffle 132
6.2.4 Outlet plane velocity contour 141
CHAPTER 7 VERIFICATION AND VALIDATION 143
7.1 Verification of the two-dimensional turning diffuser solutions 144 7.1.1 Grid independence study on two-dimensional turning diffuser
with baffles 144
7.1.2 Turbulence model test on two-dimensional turning diffuser
with baffles 147
7.1.3 Numerical scheme test on two-dimensional turning diffuser
with baffles 149
7.1.4 Convergence criteria test on two-dimensional turning diffuser
with baffles 150
x
7.3.1 Grid independence study on three-dimensional turning diffuser
with baffle 156
7.3.2 Turbulence model test on three-dimensional turning diffuser
with baffle 159
7.3.3 Numerical scheme test on three-dimensional turning diffuser
with baffle 160
7.3.4 Convergence criteria test on three-dimensional turning diffuser
with baffle 161
7.4 Validation on three-dimensional turning diffuser with baffle
solutions 163
CHAPTER 8 CFD STUDY ON VARIOUS BAFFLE DESIGNS 167
8.1 Parametric study on the design of baffle 169 8.2 Parametric study on airfoil angle of attack (AOA) 184 8.3 Parametric study on thickness to chord ratio, t/c (%) 198 8.4 Parametric study on camber to chord ratio, f/c (%) 203 8.5 Parametric study in chord length, c (cm) 209
CHAPTER 9 CONCLUSIONS AND FUTURE WORK 215
9.1 Conclusions 215
9.2 Contributions 217
9.3 Recommendations on future work 218
REFERENCES 219
LIST OF PUBLICATIONS 230
xi
LIST OF TABLES
2.1 Pressure loss coefficient (K) (Nordin et al., 2011) 18 2.2 Cp measured for each Rein tested and verification of PIV
results for two-dimensional turning diffuser (Nordin et al.,
2014a) 20
2.3 Result comparison between Noh@Seth et al. (2013) and
Nordin et al. (2014a) for both Cp and σout 22 2.4 Mean outlet velocity, Vout and flow uniformity comparison, σout
(Nordin et al., 2014a) 24
2.5 Pressure recovery, Cp comparison (Nordin et al., 2014a) 24 3.1 Input parameters for centrifugal blower 45
4.1 ANSYS Fluent input parameters 86
5.1 Preliminary airfoil parameters 91
5.2 Measurement of inlet conditions 93
5.3 Measurement of static Pi and Po 93
5.4 Comparison of Cp 94
5.5 Selection ofΔt 96
5.6 Umax comparison for validation of Δt. Optimum Δt is marked
with (*) 97
5.7 Uo extracted along Line 1 for the selected Δt 98
5.8 Comparison of Uin measurement 102
5.9 Vo comparison for validation of Δt. Optimum Δt were marked
with (*) 113
5.10 Vo extracted at outlet plane for selected Δt 114 5.11 Vout (m/s) comparison with previous study 116 5.12 Calculated value of diffuser efficiency, η for the present study 121 5.13 Calculated value of diffuser efficiency, η for Nordin et al.
xii
6.1 Calculation of first layer thickness for 2-dimesional turning
diffuser with baffle 125
6.2 Turbulence intensity measurement at both inlet and outlet 126 6.3 Calculation of first layer thickness for three-dimensional
turning diffuser with baffle 131
7.1 Three types of meshes tested for grid independence study 146 7.2 Numerical scheme CPU hours needed to reach convergence 149 7.3 Convergence criteria CPU hours needed to reach convergence 151
7.4 Comparison of Pi 152
7.5 Comparison of Po 152
7.6 Comparison of Cp 153
7.7 Comparison of Vout 153
7.8 Experimental value of the two-dimensional turning diffuser
with baffle efficiency, η 154
7.9 CFD value of the two-dimensional turning diffuser with baffle
efficiency, η 154
7.10 Comparison of η 155
7.11 Three types of meshes tested in grid independence study 158 7.12 Numerical scheme CPU hours needed to reach convergence 160 7.13 Convergence criteria CPU hours needed to reach convergence 162
7.14 Comparison of Pi 163
7.15 Comparison of Po 164
7.16 Comparison of Cp 164
7.17 Comparison of Vout 165
7.18 CFD value of three-dimensional turning diffuser with baffle
efficiency, η 165
7.19 Comparison of η 165
8.1 Design parameters changes in determining optimum design of
baffle 168
8.2 Static pressure comparison between flat plate and airfoil baffle 171 8.3 Cp comparison between flat plate and airfoil baffle 171 8.4 Mean outlet velocity, Vout comparison between flat plate and
airfoil 172
xiii
8.7 Turning diffuser performance comparison for airfoil with
various AOA tested 185
8.8 Turning diffuser efficiency, η comparison for airfoil with
various AOA tested 186
8.9 Drag coefficient measured for airfoil with various AOA tested 186 8.10 Turning diffuser performance for each airfoil with various
AOA tested 194
8.11 Turning diffuser efficiency, η comparison for airfoils with
various AOA tested 194
8.12 Drag coefficient, Cd measured for each AOA 195
8.13 Airfoil characteristics tested 198
8.14 Turning diffuser performance for each airfoil tested 199 8.15 Turning diffuser efficiency, η comparison for each t/c tested 200 8.16 Drag coefficient measured for each airfoil 200
8.17 Airfoil tested in changes of f/c 204
8.18 Turning diffuser performance for each airfoil tested 205 8.19 Turning diffuser efficiency, η comparison for each f/c tested 205 8.20 Drag coefficient measured for each airfoil 206 8.21 Airfoil properties tested in changes in chord length, c 209 8.22 Turning diffuser performance for each airfoil tested 210 8.23 Turning diffuser efficiency, η comparison for each c tested 210 8.24 Drag coefficient measured for each airfoil 211 8.25 Performance comparison between base airfoil and optimum
airfoil 214
xiv
LIST OF FIGURES
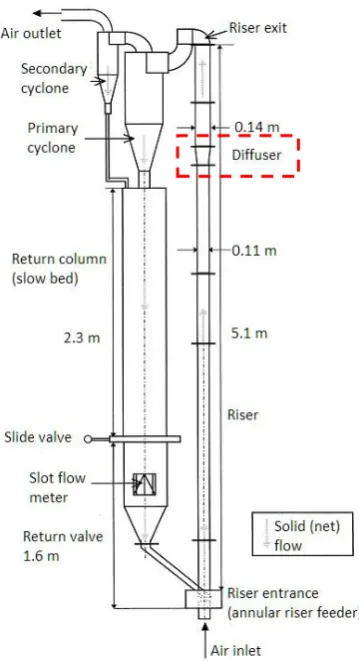
1.1 Schematic diagram of experimental circulating fluidised bed
including diffuser (Schut et al., 2000) 2
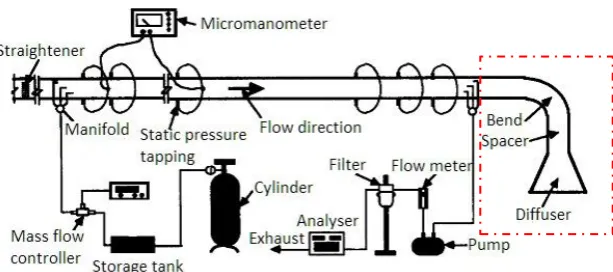
1.2 Test rig measurement of diffuser’s pressure loss coefficient in
HVAC free discharge duct system (Gan & Riffat, 1996) 3 1.3 Closed loop subsonic wind tunnel detailed computer-aided
design CAD model (Calautit et al., 2014) 3 1.4 Design of the two-dimensional turning diffuser (Nordin et al.,
2012) 5
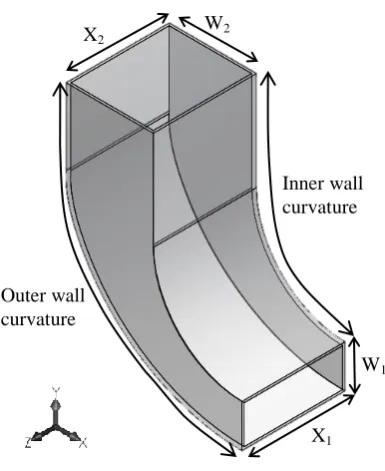
1.5 Design of the three-dimensional turning diffuser (Nordin et al.,
2012) 5
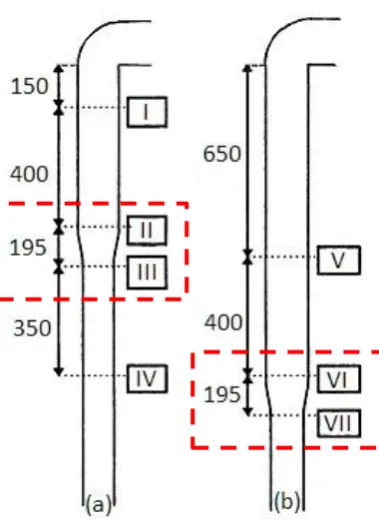
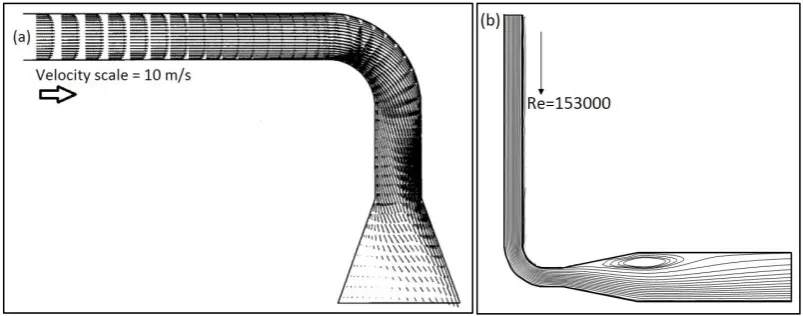
2.1 Two different positions of diffuser in the riser; (a) 550 cm below the exit and (b) 1050 cm below the exit (Schut et al.,
2000) 12
2.2 Bend-diffuser combination with short spacer shows highly distorted flow at diffuser exit for both studies by; (a) Gan &
Riffat (1996), (b) El-Askary & Nasr (2009) 13 2.3 (a) Contours of velocity magnitude for wind tunnel before and
(b) after installation of guide vanes (Calautit et al., 2014) 15 2.4 Location chosen for measurement; S1, S2, S3 (Nordin et al.,
2011) 17
2.5 Two planes selected for each location measurement (Nordin et
al., 2011) 17
2.6 Rig development of low subsonic wind tunnel. All dimensions
in cm. (Nordin et al., 2013) 19
2.7 (a) Five points location at inlet for measurements of fully developed flow and (b) velocity profile measured using Pitot
static probe (Nordin et al., 2014b) 20
2.8 Flat plate baffle designed by Noh@Seth et al. (2013). All
xv
2.9 Outlet velocity contour and vector comparison between (a) Nordin et al. (2014a) and (b) Noh@Seth et al. (2013). Red box
indicates inner wall region. 23
2.10 Schematic diagram of experimental setup using diffusing bend
(Friedman & Westphal, 1952) 25
2.11 Sketch showing airfoil location and cascade end condition
(Friedman & Westphal, 1952) 26
2.12 Airfoil profile (Friedman & Westphal, 1952) 26 2.13 Computer velocity vectors on sharp 180° bend duct (a) without
guide vane, and (b) with one guide vane (Modi & Jayanti,
2004) 27
2.14 The cascade vane geometry used by Lindgren et al. (1998); d=spacing between vanes, c=chord length, h0=spacing between vanes perpendicular to outflow direction, h1=spacing between
vanes perpendicular to inflow direction 28 2.15 Solid line guide vane is the optimised guide vane for
non-expanding corners. Dashed line is the new vane optimised for
expanding corners. (Lindgren & Johansson, 2002) 29 2.16 Mean velocity contour around airfoil for (a) AOA=0º, (b)
AOA=6º and (c) AOA=15º. RA=reattachment, S=separation.
(Nakano et al., 2007) 30
2.17 Geometry of cascades (Schreiber et al., 2004) 31 2.18 Comparison of leading edge geometry (Schreiber et al., 2004) 31 2.19 Schematic diagram of the turning vanes in Mathew (2006) 33 2.20 Schematic diagram of stereoscopic PIV setup taken from
Prasad (2000) 34
2.21 Validation process (Standard A.I.A.A, 1999) 36 2.22 Verification process (Standard A.I.A.A, 1999) 36 2.23 (a) Full scale of entire closed circuit wind tunnel; (b) Test
section for wind tunnel with inlet and outlet boundary
condition (Moonen et al., 2006). 37
2.24 Instantaneous velocity field obtained by LES (Jakirlić et al.,
2010) 39
3.1 Schematic diagram of the experimental setup (Nordin et al.,
2013) 43
xvi
contraction cone, (b) rectangular duct and turning diffuser with
baffle 43
3.3 Centrifugal blower in Aerodynamic Lab, UTHM 44 3.4 Settling chamber with 4 units of mesh screen attached to the
contraction cone 46
3.5 200 m long rectangular duct 48
3.6 Schematic diagram of the three-dimensional turning diffuser with preliminary airfoil baffle. All dimensions are not up to
scale. 49
3.7 Three-dimensional turning diffuser with baffle made up of 3
mm acrylic plate 49
3.8 Schematic diagram of a Pitot static tube (Elyasi, 2009) 51 3.9 FLUKE 922 digital air flow meter and its function 52 3.10 Centre point of turning diffuser inlet, Xc 52 3.11 Pitot tube connection to digital manometer (Appendix C) 53 3.12 Pitot tube connected to digital manometer (left) and
measurement of ΔPdyn at point Xc at turning diffuser inlet
(right) 53
3.13 (a) Pressure tapping at outlet and (b) inlet connected to digital
Manometer using Triple-T piezometer tube 56 3.14 Basic concept of the 2D PIV system (Adrian, 2005) 58 3.15 PIV post processing and data analysis technique (Appendix D) 58
3.16 2D PIV setup 60
3.17 3D stereoscopic setup 61
3.18 Local outlet plane of interest points V0, V1, V2, V3 and V4 62 3.19 Pitot static reading at the outlet for validation with PIV values
at V0 and V1 62
3.20 Medium density tracer particle seeding in PIV frame (Raffel et
al., 2013) 63
3.21 Dantec F2010 Safex fog generator with remote control 64 3.22 Illumination parts from Dantec; (a) DualPower Laser
screw-pumped cooling system, (b) Laser light guiding arm (c) Laser
optic and (d) Nd:YAG Laser source 65
3.23 Calibration plate 67
xvii
3.25 5 orientations of calibration plate for calibration in 3D
stereoscopic PIV; (a) 20° incline to east side, (b) 20° incline to west side, (c) 20° incline to north side, (d) 20° incline to south
side and (e) 0° flat position 68
3.26 Successful calibration (a) pinhole Image Model Fit (IMF) for
2D PIV and (b) Direct Linear Transform (DLT) for 3D PIV 69 3.27 Turning diffuser divided into 3 planes for 2D PIV setup 69 3.28 Masked area around turning diffuser for all planes in 2D PIV
setup; (a) Plane 1, (b) Plane 2 and (c) Plane 3 71 3.29 Minor masked area around the outlet for 3D PIV setup from;
(a) Camera 1 and (b) Camera 2 71
3.30 Vector flow in Plane 1 after image processing for 2D PIV
setup 71
3.31 Vector statistic from (a) Camera 1 and (b) Camera 2 combined to produced (c) stereoscopic third velocity component contour,
Vo 72
4.1 Extended CFD domain for three-dimensional (a) and two-dimensional (c) turning diffuser and actual geometry in experiment for three-dimensional (b) and two-dimensional (d)
turning diffuser. All dimensions are in cm. 77 4.2 Turbulent flow boundary layer (ANSYS, 2010) 78 4.3 Value of y+ in turbulent flow boundary layers (ANSYS, 2010) 78 4.4 Enhanced wall treatment in the sub-layer zone (ANSYS, 2010) 80 4.5 SIMPLE algorithm flow diagram (Versteeg & Malalasekera,
2007) 84
5.1 Schematic diagram of three-dimensional turning diffuser 90 5.2 (a) Airfoil parameters and (b) location of airfoil baffle in
three-dimensional turning diffuser 92
5.3 (a) Plane 1 image location and (b) mask image with seeded
particle flow 95
5.4 Point of Xc data acquisition to be compared with Pitot static
probe reading and location of Line 1 at Plane 1 96 5.5 Flow structures on Plane 1 for all Rein; (a) 4.527E+04, (b)
5.110E+04, (c) 7.580E+04, (d) 9.950E+04 and (e) 1.263E+05 99 5.6 Velocity contour at Plane 1 extracted for all Rein; (a)
4.527E+04, (b) 5.110E+04, (c) 7.580E+04, (d) 9.950E+04 and
xviii
5.7 Local inlet velocity, Uo plot along Line 1 together with Umax
measured by Pitot static reading for comparison 102 5.8 (a) Original image location of Plane 2; (b) and (c) shows flow
with seeded particle image containing reflections due to laser
light sheet 103
5.9 Flow structure at Plane 2 for all Rein tested; (a) 4.527E+04, (b)
5.110E+04, (c) 7.580E+04, (d) 9.950E+04 and (e) 1.263E+05 104 5.10 Velocity contour at Plane 2 for all Rein tested; (a) 4.527E+04,
(b) 5.110E+04, (c) 7.580E+04, (d) 9.950E+04 and (e)
1.263E+05 105
5.11 (a) Plane 3 desired location and (b) seeded flow after image
masking 107
5.12 Flow structure at Plane 3 from 2D PIV setup for all Rein tested; (a) 4.527E+04, (b) 5.110E+04, (c) 7.580E+04, (d) 9.950E+04
and (e) 1.263E+05 108
5.13 Flow structure comparison at Rein=4.527E+04 between; (a) turning diffuser with baffle and (b) turning diffuser without
baffle (Nordin et al., 2014a) 109
5.14 Flow structure comparison at Rein=1.263E+05 between; (a) turning diffuser with baffle and (b) turning diffuser without
baffle (Nordin et al., 2014a) 110
5.15 Both cameras mounted on traverse by using Scheimpflug rule
facing outlet plane of interest 112
5.16 Points taken at the outlet for validation of Δt selection 112 5.17 Local third velocity component, Vo contour comparison
between present study and previous study (Nordin et al., 2014a) for; Rein=4.527E+04 ((a) and (c) respectively) and
Rein=1.263E+05 ((b) and (d) respectively). 115 5.18 Outlet plane of interest and allocated position of Line A and
Line B 117
5.19 Local outlet velocities, V0 plotted graph along Line A; (a)
present study, (b) Nordin et al. (2014a) 118 5.20 Local outlet velocities, V0 plotted graph along Line B; (a)
present study, (b) Nordin et al. (2014a) 119 6.1 Two-dimensional turning diffuser with baffles computational
domain 124
6.2 Two-dimensional turning diffuser with baffle constructed mesh
xix
6.3 Flow structures on Plane A for all Rein; (a) 4.527E+04, (b)
5.110E+04, (c) 7.580E+04, (d) 9.950E+04 and (e) 1.263E+05 128 6.4 Velocity contour on Plane A for all Rein; (a) 4.527E+04, (b)
5.110E+04, (c) 7.580E+04, (d) 9.950E+04 and (e) 1.263E+0 129 6.5 Three-dimensional turning diffuser with baffle computational
domain 131
6.6 Three-dimensional turning diffuser with baffle constructed
mesh with Enhanced Wall Treatment (EWT) function 132 6.7 Flow structure at Plane 1 for all Rein; (a) 4.527E+04, (b)
5.110E+04, (c) 7.580E+04, (d) 9.950E+04 and (e) 1.263E+0 133 6.8 Velocity contour at Plane 1 for all Rein; (a) 4.527E+04, (b)
5.110E+04, (c) 7.580E+04, (d) 9.950E+04 and (e) 1.263E+0 134 6.9 Flow structure at Plane 2 for all Rein; (a) 4.527E+04, (b)
5.110E+04, (c) 7.580E+04, (d) 9.950E+04 and (e) 1.263E+0 136 6.10 Velocity contour at Plane 2 for all Rein; (a) 4.527E+04, (b)
5.110E+04, (c) 7.580E+04, (d) 9.950E+04 and (e) 1.263E+0 137 6.11 Flow structure at Plane 3 for all Rein; (a) 4.527E+04, (b)
5.110E+04, (c) 7.580E+04, (d) 9.950E+04 and (e) 1.263E+0 139 6.12 Velocity contour at Plane 3 for all Rein; (a) 4.527E+04, (b)
5.110E+04, (c) 7.580E+04, (d) 9.950E+04 and (e) 1.263E+0 140 6.13 Velocity contour at outlet plane for all Rein; (a) 4.527E+04, (b)
5.110E+04, (c) 7.580E+04, (d) 9.950E+04 and (e) 1.263E+0 142 7.1 Mesh 1 unstructured grid for two-dimensional turning diffuser
with baffles 145
7.2 Mesh 2 unstructured grid for two-dimensional turning diffuser
with baffles 145
7.3 Mesh 3 unstructured grid for two-dimensional turning diffuser
with baffles 146
7.4 Local outlet velocity, V0 plotted along Line A for grid
independent study test 147
7.5 Local outlet velocity, V0 plotted along Line A for turbulence
model test 148
7.6 Local outlet velocity, V0 plotted along Line A for numerical
scheme test 150
7.7 Local outlet velocity, V0 plotted along Line A for convergence
criteria test 151
7.8 Mesh 1 unstructured grid for three-dimensional turning
xx
7.9 Mesh 2 unstructured grid for three dimensional turning diffuser
with baffle 157
7.10 Mesh 3 unstructured grid for three-dimensional turning
diffuser with baffle 157
7.11 Local outlet velocity, V0 plotted along line A for grid
independent study test 158
7.12 Local outlet velocity, V0 plotted along line A for turbulence
model test 159
7.13 Local outlet velocity, V0 plotted along Line A for numerical
scheme test 161
7.14 Local outlet velocity, V0 plotted along Line A for convergence
criteria test 162
8.1 (a) Location of the leading edge and separation point and (b) preliminary airfoil dimensions used in both the experiment and
simulation 169
8.2 Flat plate baffle design in three-dimensional turning diffuser
(all dimensions in cm); (a) side view and (b) isometric view 170 8.3 Flat plate baffle velocity contour at Plane A for all Rein; (a)
4.527E+04, (b) 5.110E+04, (c) 7.580E+04, (d) 9.950E+04 and
(e) 1.263E+05 174
8.4 Airfoil baffle velocity contour at Plane A for all Rein; (a) 4.527E+04, (b) 5.110E+04, (c) 7.580E+04, (d) 9.950E+04 and
(e) 1.263E+05 175
8.5 Location for plane of interest, Plane B 176 8.6 Flat plate baffle velocity contour at Plane B for all Rein; (a)
4.527E+04, (b) 5.110E+04, (c) 7.580E+04, (d) 9.950E+04 and
(e) 1.263E+05 177
8.7 Airfoil baffle velocity contour at Plane B for all Rein; (a) 4.527E+04, (b) 5.110E+04, (c) 7.580E+04, (d) 9.950E+04 and
(e) 1.263E+05 178
8.8 Local outlet velocity, V0 plot along Line A comparison between flat plate and airfoil baffle for Rein=4.527E+04 and
Rein=1.263E+05 180
8.9 Local outlet velocity, V0 plot along Line B comparison between flat plate and airfoil baffle for Rein=4.527E+04 and
Rein=1.263E+05 180
xxi
8.11 Local outlet velocity, V0 plot along Line C comparison between flat plate and airfoil baffle for Rein=4.527E+04 and
Rein=1.263E+05 181
8.12 Velocity contour at outlet plane (flat plate baffle) for all Rein; (a) 4.527E+04, (b) 5.110E+04, (c) 7.580E+04, (d) 9.950E+04
and (e) 1.263E+0 183
8.13 Different angle of attack tested in simulation 184 8.14 Location of data for Cpa plot around airfoil 187 8.15 Cpa plot around airfoil crossing z-axis=0 187 8.16 Velocity contour at Plane A for airfoil with; (a) AOA=11º, (b)
AOA=14º, (c) AOA=17º (preliminary), (d) AOA=20º and (e)
AOA=23º 189
8.17 Velocity contour at Plane B for airfoil with; (a) AOA=11º, (b) AOA=14º, (c) AOA=17º (preliminary), (d) AOA=20º and (e)
AOA=23º 190
8.18 Outlet velocity contour at multiple positions for airfoil with
AOA=23º 191
8.19 Outlet velocity contour at multiple positions for airfoil with
AOA=20º 192
8.20 Outlet velocity contour at multiple positions for airfoil with
AOA=17º (preliminary) 192
8.21 Different angle of attack tested in simulation 193 8.22 Cpa plot around airfoil across z-axis=0 196 8.23 Velocity contour at Plane B for airfoil with; (a) AOA=16º, (b)
AOA=15º, (c) AOA=14º, (d) AOA=13º and (e) AOA=12º 197 8.24 Airfoil design with different t/c tested 199 8.25 Cpa plot around airfoil across z-axis=0 201 8.26 Velocity contour at Plane B; (a) Airfoil A, (b) Airfoil B, (c)
Airfoil Base, (d) Airfoil C, (e) Airfoil D and (f) Airfoil E 203 8.27 Airfoil designs with different f/c tested 204 8.28 Cpa plot around airfoil across z-axis=0 207 8.29 Velocity contour at Plane B for; (a) Airfoil F, (b) Airfoil G,
(c) Airfoil Base, (d) Airfoil H and (e) Airfoil I. 208 8.30 Airfoil designs with different chord length, c tested 209 8.31 Cpa plot around airfoil with different chord length, c 212 8.32 Velocity contour at Plane B for all airfoil; (a) Airfoil J, (b)
xxii
LIST OF SYMBOLS
A - Current
A1 - Inlet area
A2 - Outlet area
c - Chord length Cd - Drag coefficient
Cp - Turning diffuser pressure recovery coefficient Cpa - Airfoil pressure coefficient
- Pressure recovery for ideal turning diffuser d - Spacing between vanes in cascade design Dh - Hydraulic diameter
f/c - Camber-to-chord ratio
h0 - Spacing between vanes perpendicular to outflow direction h1 - Spacing between vanes perpendicular to inflow direction I - Turbulence intensity, %
K - Loss coefficient
k - Kinetic energy coefficient Lin - Inner wall length
Lm - Centreline length
Lm/W1 - Centreline length to inlet width ratio Lout - Outer wall length
N - Number of measurement points Patm - Atmospheric pressure = 101325 Pa
Pgauge - Gauge pressure
xxiii
Rein - Inlet Reynolds number t - Airfoil thickness f - Camber thickness t/c - Thickness-to-chord ratio Umax - Inlet maximum velocity Uin - Inlet mean velocity Uo - Inlet local velocity Vo - Local outlet velocity Vout - Mean outlet velocity Vp - Particle velocity
- Air kinematic viscosity, 1.60E-05 m2/s
̅ - Skin friction coefficient
W1 - Inlet width W2 - Outer width
- Hydrodynamic entrance length yp - First layer thickness
y+ - Size of grid cell nearest to the wall σout - Outlet flow uniformity
- Diffuser efficiency ρ - Air density, 1.164 kg/m3
- Air dynamic viscosity, 1.86E-05 kg/ms λ - Laser wavelength
- Turning angle ε - Dissipation rate
ΔPdyn - Dynamic pressure of moving fluid
xxiv
LIST OF ABBREVIATIONS
AR - Area ratio AOA - Angle of attack
CAD - Computer-aided Design CCD - Charge-coupled device CDA - Controlled diffusion concept CFD - Computational fluid dynamic DEHS - Di-Ethyl-Hexyl-Sabacar DLT - Direct linear transform ES - Evolution strategy EVM - Eddy viscosity model EWT - Enhanced Wall Treatment
HVAC - Heating, Ventilation and Air Conditioning IMF - Image model fit
LES - Large eddy simulation
MOGA - Multi objective generic algorithm Nd:YAG - Neodym-yttrium-aluminium-garnet OGV - Outlet guide vanes
PIV - Particle Image Velocimetry RA - Reattachment point
RANS - Reynolds-averaged Navier-Stokes RNG - Renormalization group turbulence model RPM - Revolution per minute
RSM - Reynolds stress model S - Separation point
xxv
SKE - Standard K-Epsilon turbulence model RKE - Realizable K-Epsilon turbulence model SST - Shear stress transport model
xxvi
LIST OF APPENDICES
APPENDIX TITLE PAGE
A DEHS MSDS 231
B Blower Manual 233
C Digital Manometer Manual 235
D PIV catalogue 239
E 3D traversing system specifications 240
F Fog generator and fog fluid specifications 243
G DualPower laser specifications 247
H FlowSense 2M specifications 255
I Turning diffuser with baffle detail design 257
J Stereoscopic PIV contour 261
CHAPTER 1
INTRODUCTION
Investigation of flow patterns and flow characteristics for internal and external fluid flow has been of interest to researchers all around the world. The study of fluid mechanics deals with the action of forces on fluids, which in contrast to solids, can deform and flow under the action of shear stress. Such flows offer a lot of interesting topics to be discussed, especially when considering the vital role fluid mechanics plays in our everyday lives.
The diffuser, for an example, is one of the steady flow engineering devices introduced in fluid flow systems, which has the simplest design of an expanding area in the flow direction. By slowing down the flow and consequently resulting in the recovery of static pressure (Ghose, Datta, & Mukhopadhyay, 2013), following the conservation of energy, the diffuser’s basic function is to convert kinetic energy into potential energy (Azad, 1996; Lee et al., 2013).
2
Figure 1.1: Schematic diagram of experimental circulating fluidised bed including diffuser (Schut et al., 2000)
3
Figure 1.2: Test rig measurement of diffuser’s pressure loss coefficient in HVAC free discharge duct system (Gan & Riffat, 1996)
The same concept was applied for the closed loop subsonic wind tunnel system. The diffuser in the closed loop wind tunnel was located downstream of the test section. In order to minimize loss of kinetic energy in the flow, the diffuser decelerates the flow after the test section (Calautit et al., 2014). As shown in Figure 1.3, the area covered by the closed loop subsonic wind tunnel can be reduced if both the 90º downstream turn and diffuser were combined into a turning diffuser.
[image:28.595.139.502.500.651.2]4
1.1 Research background
There are two types of turning diffusers, namely the two-dimensional turning diffuser and the dimensional turning diffuser. Flow structure in the three-dimensional turning diffuser has been proven to be more distorted as compared to the two-dimensional turning diffuser (Nordin et al., 2014a). Consequently, higher pressure loss occurs in the three-dimensional turning diffuser due to curvature effects and diffusing activities. Both types of turning diffusers used in the present study closely resemble the turning diffuser used in a previous study (Chong, Joseph, & Davies, 2008; Nordin et al., 2014a)
The dimensions of the inlet surface area of a diffuser are denoted by W1 and
X1 while the outlet dimensions are denoted by W2 and X2. The two-dimensional
turning diffuser has expanding cross-section in y-z plane where the length of X1 and
X2 remain the same. Figure 1.4 and Figure 1.5 show the design of the
two-dimensional turning diffuser and the three-two-dimensional turning diffuser.
On the other hand, the three-dimensional turning diffuser has different lengths for all W1, W2, X1, and X2. It has expanding cross section in both x-y and y-z planes.
Due to this, the flow structure for the three-dimensional turning diffuser is much more complex to be investigated. Other than pressure recovery coefficient Cp, turning diffuser performance can be measured by calculating standard deviation of the outlet flow, σout. As a square root of variance in probability distribution (Othman, Wahab, & Raghavan, 2012), standard deviation represents variation of local outlet velocity, Vo to the mean outlet velocity, Vout.
5
Figure 1.4: Design of the two-dimensional turning diffuser (Nordin et al., 2012)
Figure 1.5: Design of the three-dimensional turning diffuser (Nordin et al., 2012) Outer wall
curvature
Inner wall curvature W2
X2
W1
X1
Outer wall curvature
Inner wall curvature W2
X2
W1
[image:30.595.213.407.415.656.2]6
1.2 Problem Statement
Secondary flow (flow separation) occurs mostly in diffuser applications. In circulating fluidized bed riser for example, flow separation leads to recirculation of gas and solids in the diffusers and consequently increases reflux ratio (Schut et al., 2000). In a dump diffuser, a recirculating vortex at the upper corner forms due to flow separation occurring at the outer wall (Ghose et al., 2013). Flow separation and reattachment in engineering situations are believed to contribute to pressure fluctuations, noise and also flow unsteadiness (Park & Sung, 1995).
Flow separation in a diffuser itself is unavoidable due to an adverse pressure gradient in diffuser flow (El-Askary & Nasr, 2009; Moonen et al., 2006; Wang et al., 2009). One of the approaches to reduce such losses in a diffuser is by installing guide vanes (baffles). In a closed loop wind tunnel, for example, in the upstream test section as shown in Figure 1.3 in Calautit et al. (2014), the diffuser was equipped with splitting plates and a 90º bend was installed with guide vanes. These are the approaches taken to reduce flow separation in both parts which can reduce the overall performance of the wind tunnel significantly.
For the two-dimensional 90º turning diffuser with AR=2.16, the approach for installing the baffle has been successfully investigated in a previous study (Noh@seth et al., 2013). By measuring the overall performance of the turning diffuser in terms of pressure recovery, Cp, and flow uniformity, σout,, introduction of
three units of flat plate baffles improved the overall performance by 50%. The present study will continue this effort by implementing a numerical approach to the same design of turning diffuser with baffle.
7
It is essential to propose the optimum design of baffle for the three-dimensional turning diffuser application in order to improve its performance in terms of both pressure recovery and flow uniformity. Reducing flow separation will simultaneously reduce pressure fluctuations, noise and flow unsteadiness, as mentioned earlier, especially at the upstream section of turning diffuser in the application of closed loop low speed wind tunnel and HVAC duct system.
1.3 Objectives of study
The objectives of this study are:
1. To investigate the mechanism of flow structure in turning diffuser installed
with baffle and studies the effects towards turning diffuser performance.
2. To propose an optimal design of baffles and evaluate the effectiveness of the
new baffle design to improve turning diffuser performance.
1.4 Scope of study
The scope of this study covers;
1. A three-dimensional 90º turning diffuser with inlet dimension 13 cm × 5 cm and outlet dimension 19.5 cm × 7.2 cm, giving the area ratio of AR=2.16. The preliminary airfoil installed was optimized Wortmann FX60-100 taken from previous study (Sahlin et al., 1991).
8
3. Inlet operating parameters, Rein varied within the range of 4.527E+04 (10 m/s) – 1.263E+05 (28 m/s).
4. The turning diffuser performance is evaluated in terms of pressure recovery
coefficient (Cp), which is measured through pressure tapping, and flow uniformity (σout), which is measured using Particle Image Velocimetry (PIV).
5. Simulations are done on both the two-dimensional and three-dimensional
turning diffusers by using ANSYS Fluent. The K-Epsilon turbulence model and boundary conditions were verified and validated using experimental results.
6. The parametric study on the baffle design includes changes on; type of baffle between flat plate and airfoil, angle of attack, AOA ranging from 23° to 11°, thickness-to-chord ratio, t/c ranging from 5.35% to 13.27%, camber-to-chord ratio, f/c ranging from 7% to 13% and chord length, c ranging from 5 cm to 9 cm. Simulations on 23 designs of baffle include the performance comparison in terms of drag coefficient, Cd and airfoil pressure coefficient, Cpa profile.
1.5 Significance of study
9
1.6 Thesis outline
The remainder of this thesis consists of another 8 chapters.
Chapter 2 presents a review on available literature to date referred to involving diffuser applications and theoretical background as well as development of experimental rig used in present study. Documentations on previous design of baffle which uses similar experimental setup was reviewed in order to propose preliminary airfoil to be installed in three-dimensional turning diffuser. Since present work involve both experimental and numerical approach, instrumentations on PIV sensors and techniques together with turbulence model used to study flow parameters were also reviewed.
Both Chapter 3 and Chapter 4 explain method and tools used in both experimental and numerical approach respectively. Chapter 3 starts with explanations on the overall experimental setup and later segregate each instrument in details. PIV measurement and instrumentation techniques were also discussed in details.
Chapter 4 continues with discussion on CFD modelling techniques which include mathematical model, computational domain, meshing, boundary conditions, solver algorithm and convergence criteria. Summarize input in ANSYS Fluent was also included in this chapter.
Chapter 5 laid out the experimental results from PIV, ranging from pressure recovery measurements data, flow structure from 2D and 3D PIV setup as well as measurement of turning diffuser outlet flow uniformity and efficiency. All data were compared to three-dimensional turning diffuser without baffle taken from previous study.
Chapter 6 continues with numerical results on velocity contour and flow structure for both two-dimensional turning diffuser and three-dimensional turning diffuser taking from ANSYS Fluent.
10
analysis were discussed and the numerical results were validated with experimental results presented in Chapter 5.
Chapter 8 presents parametric study conducted on optimized Wortmann FX60-100 airfoil design including changes on design of baffle, AOA, t/c, f/c and chord length, c. After all parametric study conducted, the optimum design of baffle was proposed in this chapter.
CHAPTER 2
LITERATURE REVIEW
In order to better comprehend most aspects in studying flow in both the two-dimensional and three-two-dimensional turning diffuser with baffle, a review of some concept and theoretical background on the experimental setup and numerical approach is quite essential. Included in this chapter is review on the basic industrial application of diffuser followed by development of the experimental rig used in the present study. The present study focuses more on improving turning diffuser performance by installing baffles. Thus, a review on various baffle designs from previous studies, taken from different cases, is included in this chapter. As mentioned in the previous chapter, turning diffuser outlet flow uniformity, σout was measured using PIV. Procedures on conducting the experiment using PIV by referring to other studies were also reviewed. Following the experimental procedures is a review on the numerical approach including validation and verification method conducted previously.
12
2.1 Diffuser applications and turning diffuser theoretical background
[image:37.595.222.412.424.684.2]In general definition, diffusers are chambers that expand in flow direction, resulting in the decrease of fluid velocities along with increase of fluid pressure (Cermak, 1981). Industrial application, which uses the diffuser is either preceded by a bend or followed by a bend, includes a circulating fluidized bed riser, HVAC duct system as well as closed loop wind tunnel. Schematic experimental diagram of the circulating fluidized bed riser conducted by Schut et al.(2000) as shown in Figure 1.1 in the previous chapter is a clear example of diffuser application in duct system. The location of diffuser within the riser was varied as shown in Figure 2.1 and the effects on reflux ratio concludes that diffuser located 1050 cm below the exit provide better reflux ratio. Reflux ratio in parallel duct is higher when distance below the exit increases. Thus, proposing the use of turning diffuser in this case is rather inappropriate.
13
[image:38.595.118.520.322.480.2]In HVAC ductwork, free-discharge diffuser preceded by a bend was installed at the duct outlet to reduce the air velocity when discharge to atmosphere as part of room air distribution system. Gan and Riffat (1996) concluded in their study that a divergence angle smaller than 10º of pyramidal diffuser should be used to achieve flow regularity and stability discharged air, with the exception of spacer length of twice the hydraulic diameter, Dh (2Dh) should be introduced. El-Askary & Nasr (2009) concluded the same issue, where spacer length should be introduced between bend and diffuser which will contribute to loss reduction of the system. However, as shown in Figure 2.2, a highly distorted flow was still recorded. The turning diffuser could be proposed, together with installation of baffle to improve such flaws.
Figure 2.2: Bend-diffuser combination with short spacer shows highly distorted flow at diffuser exit for both studies by; (a) Gan & Riffat (1996), (b) El-Askary & Nasr
(2009)
14
2014). A closed loop wind tunnel has four 90º turn as shown in Figure 1.3 in previous chapter.
For the 90º upstream turn (Section 4), guide vanes were installed to reduce flow separation, whereas for 90º lower upstream turn (Section 8), guide vanes were mounted to direct the flow to be parallel to test section centre line. At the same time, it helped improved flow uniformity just before entering contraction cone. Both 90º turn downstream and upstream of the diffuser’s outlet were also installed with guide vanes, with the same objective to reduce flow separation occurring in the turn (Calautit et al., 2014). As shown in Figure 2.3, significant improvement on velocity contour in closed loop wind tunnel concluded that guide vanes installed in diffuser and 90º turn helps reduce flow separation and improve flow uniformity entering the test section.
However, when space limitations were the factor to be considered in building a closed loop wind tunnel, diffusing and turning activities could be combined as a turning diffuser. Other terms for turning diffuser used in previous studies were expanding corner, diffusing bend and curved diffuser. Studies on turning diffusers were previously conducted, and they highlighted a few subjects to be brought up for discussion (Chong et al., 2008; Djebedjian, 2001; McMillan, 1982; Majumdar et al., 1996, 1998, 1999; Sinha et al., 2010, 2011, 2012).
15
Figure 2.3: (a) Contours of velocity magnitude for wind tunnel before and (b) after installation of guide vanes (Calautit et al., 2014)
16
accumulated and shifted towards the outer (concave) wall especially at the outlet of curved diffuser.
All these studies highlighted critical flow separation due to curvature effects as well as diffusing activities in curved diffuser. Secondary flow cannot be neglected since it contributes to losses in the system. Efforts can be done in improving flow characteristics in curved diffuser, since it offers wide industrial applications especially in restricted space cases. Next section will outline a review on previous research focusing on the two-dimensional and three-dimensional rectangular cross section turning diffuser together with development of experimental rig used in present study.
2.2 Experimental rig development on low subsonic wind tunnel feature
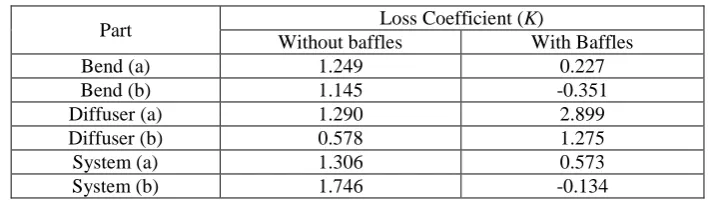
Nordin et al. (2011) started research on performance of a bend-diffuser with baffles installed which was measured and compared to a bend-diffuser without baffles. The tested diffuser has an area ratio (AR) of 7.2 with 13 cm × 13 cm square inlet and axial length of 49 cm. Three locations were chosen to be measured, i.e., before bend (S1), before diffuser (S2) and after diffuser (S3) with two planes (A and B) each using Pitot static probe and digital manometer with accuracy of ±0.1Pa. Macbain’s (MacBain, 2003) patent was selected as baffle design to be adopted in the experiment. Details are shown in Figure 2.4 and Figure 2.5. It was proven that with the installation of baffles in bend-diffuser system, the overall performance improved in terms of pressure loss reduction. As shown in Table 2.1, loss coefficient (K) was reduced for almost all cases except inside the diffuser. This is due to excessive separation in the diffuser itself.
17
[image:42.595.198.434.161.396.2]models, which was Standard K-Epsilon turbulence model (SKE), the Shear Stress Transport model (SST K-Omega) and the Reynolds Stress Model (RSM).
Figure 2.4: Location chosen for measurement; S1, S2, S3 (Nordin et al., 2011)
Figure 2.5: Two planes selected for each location measurement (Nordin et al., 2011) 13 cm
49 cm
35 cm Plane
(b)
[image:42.595.146.484.467.620.2]18
Table 2.1: Pressure loss coefficient (K) (Nordin et al., 2011)
Part Loss Coefficient (K)
Without baffles With Baffles
Bend (a) 1.249 0.227
Bend (b) 1.145 -0.351
Diffuser (a) 1.290 2.899
Diffuser (b) 0.578 1.275
System (a) 1.306 0.573
System (b) 1.746 -0.134
Turning diffuser performances were measured in terms of pressure recovery (Cp) and outlet’s flow uniformity (σout). Higher value of Cp represents high pressure recovery, whereas lower value of σout represents high flow uniformity. From the simulation at specific Rein, pressure recovery increases with increasing AR. Conversely, flow uniformity decreases with increasing Rein. On the other hand, at specific AR, while pressure recovery increase with increasing Rein, flow uniformity decrease with increasing Rein. After all, the increase of AR yields smaller effects on the flow uniformity as compared to the effects by increasing Rein.
Thus, Nordin et al. (2012a) carried out more intensive studies on varying Rein to find its effects on the flow uniformity. Consequently, an optimum geometric configuration of turning diffuser was proposed; AR=1.6 running at Rein=2.653E+04, which corresponded to performance value of Cp=0.320 and σout=1.620. However, results between simulation and experimental data deviates up to 34.1%, concluding that further improvement on the existing rig need to be implemented.
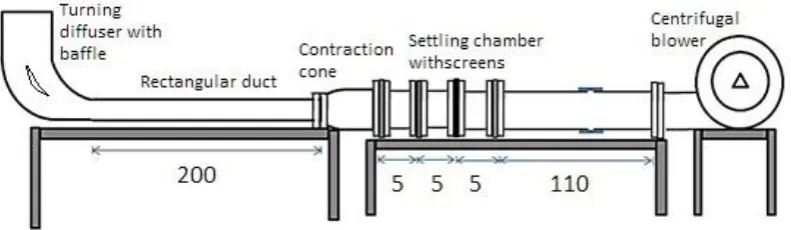
19
Figure 2.6: Rig development of low subsonic wind tunnel. All dimensions in cm. (Nordin et al., 2013)
To develop steady flow, a centrifugal blower with 3-phase inverter controller was used. Settling chamber and multiple screens made of metal wire interwoven were installed to improve the mean flow uniformity and reduce oncoming turbulence. The contraction cone will help to accelerate flow from the settling chamber, and it is expected to have steady, uniform and free separation out-going flow. Hydrodynamic length was introduced earlier on before connected to the turning diffuser’s inlet. Thus, at the turning diffuser’s inlet, the flow is believed to be steady, uniform and fully developed.
20
Figure 2.7: (a) Five points location at inlet for measurements of fully developed flow and (b) velocity profile measured using Pitot static probe (Nordin et al., 2014b)
After a strong verification of the rig and the whole system, Nordin et al. (2014a) continues the experimental investigation on two-dimensional turning diffuser by varying inflow Reynolds number. Pressure recovery was measured using pressure tapping at both inlet and outlet of the turning diffuser connected via triple-T piezometer and measured using a digital Manometer, whereas the outlet flow uniformity was measured using PIV.
5 different values of outlet flow velocity were measured. Verification of PIV result was obtained by comparing manual measurement of the local outlet velocity, Vo using Pitot static probe with PIV measurement. Table 2.2 shows the deviation between both approaches. These outputs were used by Noh@Seth et al. (2013) as reference in the study of improving flow uniformity and pressure recovery of the two-dimensional turning diffuser by means of installing baffles.
Table 2.2: Cp measured for each Rein tested and verification of PIV results for two-dimensional turning diffuser (Nordin et al., 2014a)
Rein Cp
Vo
Pitot
Vo
PIV Deviation (%)
5.786E+04 0.191 4.98 4.92 1.2
6.382E+04 0.209 5.92 5.87 0.8
1.027E+05 0.216 11.05 10.64 3.7
1.397E+05 0.221 15.45 15.34 0.7
[image:45.595.207.432.646.730.2]21
Noh@Seth et al. (2013) continued the effort to improve flow uniformity and pressure recovery by installing flat plate baffles. 3 units of flat plate baffles were designed, acting as a small turning diffuser in the existing turning diffuser in order to avoid flow abruption. Figure 2.8 shows the design of flat plate baffles in two-dimensional turning diffuser.
[image:46.595.205.433.362.565.2]Using the same experimental rig, an improvement of 54.6% on pressure recovery was proven after installing the two-dimensional turning diffuser with baffles. Best produced pressure recovery of Cp=0.526 was recorded as compared to Cp=0.239 for two-dimensional turning diffuser without baffle at the highest Reynolds number tested. As for the flow uniformity, the best σoutwas σout=3.235 at the highest Reynolds number tested, with an improvement of 47.1%. Table 2.3 shows the resulting output from the experiment done by Noh@Seth et al. (2013).
22
Table 2.3: Result comparison between Noh@Seth et al. (2013) and Nordin et al. (2014a) for both Cp and σout
Rein
σout
(Noh@seth et al., 2013)
σout
(Nordin et al., 2014a)
Improvement (%)
5.786E+04 0.719 1.755 58.864
6.382E+04 0.683 1.852 63.032
1.027E+05 2.437 2.910 16.240
1.397E+05 2.621 4.947 46.492
1.775E+05 3.235 6.128 47.127
Rein
Cp
(Noh@seth et al., 2013)
Cp
(Nordin et al., 2014a)
Improvement (%)
5.786E+04 0.413 0.191 53.849
6.382E+04 0.418 0.209 50.100
1.027E+05 0.433 0.216 50.225
1.397E+05 0.491 0.221 55.035
1.775E+05 0.526 0.239 54.625
23
Figure 2.9: Outlet velocity contour and vector comparison between (a) Nordin et al. (2014a) and (b) Noh@Seth et al. (2013). Red box indicates inner wall region.
Study on turning diffuser can be widely enhanced to various dimensions of turning diffuser. Since the two-dimensional turning diffuser offered extensive improvement on replacing bend-diffuser, especially with the installation of baffle, Nordin et al. (2012b) extended their studies by varying the area ratios of the three-dimensional turning diffuser. Generally, the three-three-dimensional turning diffuser has more complex flow as compared to the two-dimensional turning diffuser as prescribed in previous chapter; hence offer wider discussion on flow characteristics and turning diffuser performance.
Nordin et al. (2012b) investigated three different cases; the two-dimensional turning diffuser (Case A), three-dimensional turning diffuser with AR=2.0 (Case B)
(a)
(b)
Outer wall
Inner wall
Outer wall
24
and three-dimensional turning diffuser with AR=4.0 (Case C). All cases were compared and concluded that pressure recovery and flow uniformity for Case B is lower than Case A, due to more complex flow and diffusing activities for three-dimensional turning diffuser.
[image:49.595.173.464.446.528.2]Latest research done by Nordin et al. (2014a) was on the performance of the three-dimensional turning diffuser at various inlet conditions as compared to the two-dimensional turning diffuser by using similar experimental setup and rig. Table 2.4 and 2.5 shows the comparison of both experiments. The research proposed for inflow Rein=1.027E+05-1.775E+05, the three-dimensional turning diffuser is more reliable and as for Rein=5.786E+04-6.382E+04, the two-dimensional turning diffuser is much more favourable. This is only if flow uniformity is of interest to subject. On the other hand, if pressure recovery is becoming the concern, the three-dimensional turning diffuser performed better within Rein=5.786E+04-6.382E+04 and Rein =1.027E+05-1.775E+05 for the two-dimensional turning diffuser.
Table 2.4: Mean outlet velocity, Vout and flow uniformity comparison, σout (Nordin et al., 2014a)
Rein
2-D Turning Diffuser 3-D Turning Diffuser
Vout (m/s) σout (m/s) Vout (m/s) σout (m/s)
5.786E+04 1.57 1.75 2.07 1.82
6.382E+04 1.61 1.85 2.62 2.25
1.027E+05 2.31 2.91 3.03 2.7
1.397E+05 4.85 4.90 5.68 4.64
1.775E+05 5.75 6.12 5.95 5.05
Table 2.5: Pressure recovery, Cp comparison (Nordin et al., 2014a)
Rein
2-D Turning Diffuser 3-D Turning Diffuser
Cp Cp
5.786E+04 0.191 0.210
6.382E+04 0.209 0.217
1.027E+05 0.216 0.203
1.397E+05 0.221 0.219
[image:49.595.186.448.596.681.2]218
REFERENCES
Abdulmouti, H., & Mansour, T. M. (2006). The technique of PIV and its applications. In 10th International Congress on Liquid Atomization and Spray Systems, Kyoto, Japan.
Abe, K. I., & Ohya, Y. (2004). An investigation of flow fields around flanged diffusers using CFD. Journal of wind engineering and industrial aerodynamics, 92(3), 315-330.
Abe, K., Nishida, M., Sakurai, A., Ohya, Y., Kihara, H., Wada, E., & Sato, K. (2005). Experimental and numerical investigations of flow fields behind a small wind turbine with a flanged diffuser. Journal of Wind Engineering and Industrial Aerodynamics, 93(12), 951-970.
Adebayo, D. S., (2012) Annular flows and their interaction with a cylindrical probe. University of Leicester. Ph.D. Thesis.
Adrian, R. J. (2005). Twenty years of particle image velocimetry. Experiments in fluids, 39(2), 159-169.
Ahmed, N., (2013) Design features of a low turbulence return circuit subsonic wind tunnel having interchangeable test sections. In: Ahmed, N. A. (Ed). Wind Tunnel-Designs and Their Diverse Engineering Applications. Croatia: InTech. pp. 29-57.
Aider, J. L., Beaudoin, J. F., & Wesfreid, J. E. (2010). Drag and lift reduction of a 3D bluff-body using active vortex generators. Experiments in fluids, 48(5), 771-789.
219
Azad, R. S. (1996). Turbulent flow in a conical diffuser: a review. Experimental Thermal and Fluid Science, 13(4), 318-337.
Azzola, J., Humphrey, J. A. C., Iacovides, H., & Launder, B. E. (1986). Developing turbulent flow in a U-bend of circular cross-section: measurement and computation. Journal of fluids engineering, 108(2), 214-221.
Bell, J. H. and Mehta, R. D., Boundary-layer predictions for small low-speed contractions. American Institute of Aeronautics and Astronautics Journal. 1989. 27(3): 372-374.
Birch, N. (1984). The calculation of 3D flow in curved ducts using Q385. Rolls-Royce Theoretical Sciences Group, Derby. Report TSG0161.
Blechinger, C. J. (1971). The influence of inlet velocity distribution on the flow through a plane curved diffuser. Iowa State University, Ph.D. Thesis.
Blevins, R. D. (1984). Applied fluid dynamics handbook. New York, Van Nostrand Reinhold Co.
Calautit, J. K., Chaudhry, H. N., Hughes, B. R., & Ghani, S. A. (2013). Comparison between evaporative cooling and a heat pipe assisted thermal loop for a commercial wind tower in hot and dry climatic conditions. Applied Energy, 101, 740-755.
Calautit, J. K., Chaudhry, H. N., Hughes, B. R., & Sim, L. F. (2014). A validated design methodology for a closed-loop subsonic wind tunnel. Journal of Wind Engineering and Industrial Aerodynamics, 125, 180-194.
Cermak, J. E. (1981). Wind tunnel design for physical modeling of atmospheric boundary layers. Journal of the American Society of Civil Engineers, 107, 623-642.
Chang, S. M., Humphrey, J. A. C., & Modavi, A. (1983). Turbulent-flow in a strongly curved u-bend and downstream tangent of square cross-sections. PhysicoChemical Hydrodynamics, 4(3), 243-269.
Chaudhry, H. N., Calautit, J. K., Hughes, B. R., & Sim, L. F. (2015). CFD and experimental study on the effect of progressive heating on fluid flow inside a thermal wind tunnel. Computation, 3(4), 509-527.
220
Chong, T. P., Joseph, P. F., & Davies, P. O. (2008). A parametric study of passive flow control for a short, high area ratio 90deg curved diffuser. Journal of Fluids Engineering, 130(11), 111104-1-12.
Corsiglia, V. R., Olson, L. E. and Falarski, M. D., (1984) Aerodynamic characteristics of the 40-by 80/80- by 120-foot wind tunnel at NASA Ames Research Center. NASA Technical Memorandum 85946.
Dixon, S. L. (1998), Fluid Mechanics, Thermodynamics of Turbomachinery. 4th Ed. New York. McGraw-Hill.
Djebedjian, B. (2001). Numerical and experimental investigations of turbulent flow in a 180◦ curved diffuser. In ASME Division of Fluid Dynamics Summer Meeting.
El-Askary, W. A., & Nasr, M. (2009). Performance of a bend–diffuser system: Experimental and numerical studies. Computers & Fluids, 38(1), 160-170. Elyasi, S., (2009) Development of UV photoreactor models for water treatment.
University of British Columbia. Ph.D. Thesis.
Farsimadan, E., & Mokhtarzadeh-Dehghan, M. R. (2010). An experimental study of the turbulence quantities in the boundary layer and near-wake of an airfoil placed at upstream of a 90° bend. Experimental Thermal and Fluid Science, 34(8), 979-991.
Friedman, D., & Westphal, W. R. (1952). Experimental investigation of a 90 cascade diffusing bend with an area ratio of 1.45: 1 and with several inlet boundary layers. NACA Tech. Note, 2668.
Fukumasu, N. K., Guenther, C. K. F. and Yanagihara, J. I., (2013) PIV analyses of the influence on flow structure of vane design in swirl type air diffusers. 8th World Conference on Experimental Heat Transfer, Fluid Mechanics and Thermodynamics. June 16-20. Lisbon, Portugal. 2013.
Gan, G., & Riffat, S. B. (1996). Measurement and computational fluid dynamics prediction of diffuser pressure-loss coefficient. Applied energy, 54(2), 181-195.
221
Gartmann, A., Fister, W., Schwanghart, W., & Müller, M. D. (2011). CFD modelling and validation of measured wind field data in a portable wind tunnel. Aeolian Research, 3(3), 315-325.
Gelder, T. F., Moore, R. D., Sanz, J. M. and Mcfarland, E. R., (1985) Wind tunnel turning vanes of modern design. Lewis Research Center, Cleveland, Ohio. NASA Technical Memorandum AIAA-86-0044.
Ghorbanian, K., Soltani, M. R., & Manshadi, M. D. (2011). Experimental investigation on turbulence intensity reduction in subsonic wind tunnels.Aerospace science and Technology, 15(2), 137-147.
Ghose, P., Datta, A., & Mukhopadhyay, A. (2013). Effect of dome shape on static pressure recovery in a dump diffuser at different inlet swirl. International Journal of Emerging Technology and Advanced Engineering, 3, 465-471. Gopaliya, M. K., Goel, P., Prashar, S., & Dutt, A. (2011). CFD analysis of
performance characteristics of S-shaped diffusers with combined horizontal and vertical offsets. Computers & Fluids, 40(1), 280-290.
Gordon, R., & Imbabi, M. S. (1998). CFD simulation and experimental validation of a new closed circuit wind/water tunnel design. Journal of fluids engineering, 120(2), 311-318.
Versteeg, H. K. and Malalasekera, W., (2007) “An introduction to computational fluid dynamic the finite volume method”, 2nd
Edition, Pearson Education Limited.
Hu, H., Saga, T., Kobayashi, T., Okamoto, K., & Taniguchi, N. (1998). Evaluation of the cross correlation method by using PIV standard images.Journal of Visualization, 1(1), 87-94.
Jakirlić, S., Kadavelil, G., Kornhaas, M., Schäfer, M., Sternel, D. C., & Tropea, C. (2010). Numerical and physical aspects in LES and hybrid LES/RANS of turbulent flow separation in a 3-D diffuser. International Journal of Heat and Fluid Flow, 31(5), 820-832.
Johl, G. S., (2010) The design and performance of a 1.9m x 1.3m indraft wind tunnel. Loughborough University. Ph.D. Thesis.
222
Johnson, R. W., (1984) Turbulent convecting flow in a square duct with a 180º bend. University of Manchester. Ph.D. Thesis.
Jung, W. J., Affes, H., Perng, C. Y., & Chu, D. (1998). A Preliminary Study on Curvature Effect Turbulence Modeling for Ducted and Turbomachinery Flows œ Wall Treatment. In Proceedings, FEDSM, 98(1998), pp. 21-25. Kim, H. J., Lee, S., & Fujisawa, N. (2006). Computation of unsteady flow and
aerodynamic noise of NACA0018 airfoil using large-eddy simulation. International journal of heat and fluid flow, 27(2), 229-242. Kim, J., Moin, P., & Moser, R. (1987). Turbulence statistics in fully developed
channel flow at low Reynolds number. Journal of fluid mechanics, 177, 133-166.
Kishore, R. A., & Priya, S. (2013). Design and experimental verification of a high efficiency small wind energy portable turbine (SWEPT). Journal of Wind Engineering and Industrial Aerodynamics, 118, 12-19.
Koch, H., Kozulovic, D., & Hoeger, M. (2012). Outlet Guide Vane Airfoil for Low Pressure Turbine Configurations. AIAA Paper, (2012-2979).
Kozak, J. D., (2000) Investigation of inlet guide vane wakes in a F109 turbofan engine with and without flow. Virginia Polytechnic Institute and State University. Ph.D Thesis.
Lastra, M. R., Oro, J. M. F., Vega, M. G., Marigorta, E. B., & Morros, C. S. (2013). Novel design and experimental validation of a contraction nozzle for aerodynamic measurements in a subsonic wind tunnel. Journal of Wind Engineering and Industrial Aerodynamics, 118, 35-43.
Lee, G. G., Allan, W. D., & Boulama, K. G. (2013). Flow and performance characteristics of an Allison 250 gas turbine S-shaped diffuser: effects of geometry variations. International Journal of Heat and Fluid Flow, 42, 151-163.
Lien, K., Monty, J. P., Chong, M. S., & Ooi, A. (2004, November). The entrance length for fully developed turbulent channel flow. In 15th Australian Fluid Mechanics Conference, 15, pp. 356-363.