Journal of Chemical and Pharmaceutical Research, 2015, 7(4):141-146
Research Article
ISSN : 0975-7384
CODEN(USA) : JCPRC5
Validated UV spectrophotometric method for estimation of eprosartan in bulk
and pharmaceutical formulation
M. M. Eswarudu
1,2, Vivek Joyal
1, D. Pavan Kumar
1, R. Mounika
1, Sk. Yakub Pasha
1,
J. Veerababu
1and M. Chinna Eswaraiah
11Department of Pharmaceutical Analysis, Anurag Pharmacy College, Ananthagiri (V), Kodad (M), Nalgonda (Dist),
T. S., India
2
Jawaharlal Nehru Technological University, Kakinada, Andhrapradesh, India
_____________________________________________________________________________________________
ABSTRACT
A simple, economical, accurate, precise and less time consuming UV spectrophotometric method has been developed and validated for the estimation of Eprosartan in bulk and pharmaceutical formulations. In this method Eprosartan exhibits maximum absorbance (λ max) at 233.The drug was obeys Beer’s law in the concentration range of 2-20µg/ml. The method was validated as per the International Conference on Harmonization (ICH) guidelines. Drug followed the linearity in the concentration range of 2-20µg/ml with correlation coefficient (r2) of 0.998. The validity of the proposed method was assessed by applying the standard addition technique where the percentage recovery of the added standard was found to be 98.68 ± 0.701 for Eprosartan Mesylate.The limit of detection and quantification were calculated to be 0.045386µg/ml and 0.0542916µg/ml respectively. The proposed method is recommended for routine analysis of eprosartan in bulk and its dosage forms in quality control testing laboratories. Hence it is rapid, simple, accurate and sensitive.
Keywords: Eprosartan Mesylate, Beer's Law, UV Spectrophotometry, Validation.
_____________________________________________________________________________________________
INTRODUCTION
Eprosartan Mesylate is a novel angiotensin receptor antagonist with chemical name IUPAC: (E)-2-Butyl–(1-Pcarboxybenzyl)-α-2-thenylimidazole-5-acrylicacid methane sulfonate. Its molecular weight is 520.61832 [g/mol] with molecular formula C24H28N2O7S2 [1]. Eprosartan used for the treatment of high blood pressure. It acts on the
rennin angiotensin system in two ways to decrease total peripheral resistance. First, it blocks the binding of angiotensin II to AT1 receptors in vascular smooth muscle, causing vascular dilatation. Second, it inhibits sympathetic norepinephrine production, further reducing blood pressure. A recent advance in the treatment of hypertension and heart failure is the development of a new class of pharmacologic agents, angiotensin II receptor antagonists, which block the effects of the renin‐angiotensin system directly at the angiotensin II receptor level. Angiotensin II, the primary mediator of the renin‐angiotensin system, plays a major role in the regulation of fluid and electrolyte balance, blood pressure, and blood volume[2].
pharmaceutical formulations with good accuracy and economy. The structure of Eprosartan is shown in (Figure1).The analytical method was validated according to ICH validation parameters [13, 14].
[image:2.595.215.384.142.254.2]
Figure 1: Chemical structure of Eprosartan Mesylate
EXPERIMENTAL SECTION
Chemicals: Eprosartan was taken as gifted sample from Bio-Leo Analytical Lab pvt.Limited Hyderabad, India. The commercial tablets (Teveten) containing 400 mg of Eprosartan Mesylate (Abbott Health care pvt.Ltd, Mumbai, India) was procured from the local market. 0.1M Sodium hydroxide AR grade (SD fine chemicals Pvt. Ltd., Mumbai, India) and methanol AR grade (Rankem chemicals, Mumbai, India) were used as solvents in this study.
Equipments: LABINDIA-3000+ Double beam UV-Visible spectrophotometer with 1cm matched quartz cells was used for the measurement of absorbance. Shimadzu-AX-200 electronic balance was used for weighing the samples. Citizen-Ultrasonicator and Class ‘A’volumetric glassware’s were used for this work.
Selection of Solvent for Analysis: The UV spectra of Eprosartan obtained from different solutions (Methanol, Distilled water, 0.1 M hydrochloric acid and 0.1 M sodium hydroxide) were studied. The drug was insoluble in distilled water and in 0.1 M hydrochloric acid, But soluble in Methanol and 0.1M sodium hydroxide. The stability of Eprosartan was found to be 24 hours. In methanol the stability of Eprosartan is less. At the end of these studies, 0.1 M sodium hydroxide was chosen, because of the time gain while preparing solutions and cost saving by eliminating the purchase and disposal of organic solvents.
Preparation of standard stock solution: 10 mg of Eprosartan was weighed and transferred to 100ml volumetric flask and dissolved in 0.1M sodium hydroxide solution and the solution was made up to volume100ml with 0.1M sodium hydroxide solution to get 100 µg/ml of Eprosartan.
Figure 2: UV Spectra of Eprosartan in 0.1M sodium hydroxide (at 233nm)
[image:2.595.147.451.525.661.2]______________________________________________________________________________
of each solution at 233nm against 0.1M Sodium hydroxide as blank. A calibration curve was prepared by plotting absorbance versus concentration. UV spectrum of Eprosartan was shown in figure 2.
[image:3.595.123.476.423.602.2]Optical characteristics: Optical characteristics such as Beer’s law limit (µg/mL), Correlation coefficient, Regression equation, Slope (m), and Intercept (c) were calculated and shown in Table-1
Table-1: Optical characteristics
S.no Optical characteristics Observed values
1 Beer’s law limit (µg/ml) 2-20 µg/ml 2 Correlation coefficient (r2) 0.998
3 Regression equation Y=0.041x+0.001
4 Slope (a) 0.041
5 Intercept (b) 0.001
6 LOD 0.045386µg/ml
7 LOQ 0.0542916µg/ml
Estimation of Eprosartan in Tablets: For the analysis of the drug in bulk, accurately weighed 10 mg sample was dissolved in 100 mL 0.1M Sodium hydroxide in a volumetric flask. After suitable dilution, the absorbance of final sample was recorded against the blank at 233nm. For the analysis of dosage form, twenty tablets of Eprosartan Mesylate (400mg) were ground to fine powder and mixed thoroughly. A quantity of powder equivalent to 10 mg of the drug was transferred to 100 mL volumetric flask and dissolved in about 40 ml 0.1M sodium hydroxide. The insoluble excipients were separated by filtration through whattman filter paper. After suitable dilution, the absorbance was recorded against the blank at 233nm.
Validation of Analytical Method:
Linearity: Fresh aliquots were prepared from standard stock solution ranging from 2-20 µg/ml and the absorbance values of each concentration was recorded at 233 nm for this method using 0.1M sodium hydroxide as blank. The drug shows linearity between 2-20 µg/ml for this method. Results were shown in Table-2 and figure-3.
Table 2: Linearity results of Eprosartan
S. no Concentration (µg/ml)
Absorbance (at 233nm)
1 2 0.081
2 4 0.176
3 6 0.245
4 8 0.338
5 10 0.417
6 12 0.505
7 14 0.583
8 16 0.646
9 18 0.722
10 20 0.828
[image:4.595.194.404.321.429.2]Precision: In intraday study, concentration of replicates of drug was calculated on the same day for two times. In inter-day study the concentration of drug were calculated on two successive days which expresses the laboratory variation in different days. In both intra and inter day precision study for the methods %RSD was calculated and results are shown in Table-3 and 4.
Table 3: Intra-day precision (Repeatability) data of proposed method
S.no Concentration (µg/ml) Absorbance (at 233 nm) Morning Evening
1 8 0.345 0.331
2 8 0.341 0.388
3 8 0.346 0.371
4 8 0.364 0.336
5 8 0.334 0.383
6 8 0.356 0.346
Average 0.3476 0.35916
S.D 0.02466 0.02466
[image:4.595.192.401.453.562.2]%R.S.D 0.411 0.411
Table 4: Inter-day precision (Reproducibility) data of proposed method
S.no Concentration (µg/ml) Absorbance (at 233 nm) Day 1 Day 2
1 8 0.358 0.320
2 8 0.360 0.326
3 8 0.365 0.322
4 8 0.365 0.323
5 8 0.365 0.319
6 8 0.362 0.321
Average 0.3625 0.321833
S.D 0.003016 0.002483
[image:4.595.140.460.583.683.2]%R.S.D 0.502 0.041
Table 5: Recovery studies data of proposed method
S. no Spike Level µg/ml added µg/ml found %recovery Mean %recovery
1 100% 8 7.72 96.5
101.3%
2 100% 8 8.7 108.7
3 100% 8 8 100
1 125% 10 9.93 99.3
97.73%
2 125% 10 10 100
3 125% 10 9.39 93.9
1 150% 12 11.71 97.58
97.44%
2 150% 12 11.61 96.75
3 150% 12 12.76 98
______________________________________________________________________________
method is very accurate for quantitative estimation of tablet as the statistical results were within the acceptance range. Results were shown in Table-5.
Limit of Detection and Limit of Quantification: The limit of detection and limit of quantification of Eprosaratan by proposed method were determined using calibration graphs. LOQ and LOD were calculated as
LOD = 3.3 X S.D/S
LOQ = 10 X S.D/S
Where S is the slope of the calibration curve and SD is the standard deviation of response of least concentration of calibration curve in three replicates. Results were shown in Table-1.
[image:5.595.190.405.312.419.2]Robustness: Robustness of the method was determined by carrying out the analysis at three different wavelengths (±2nm). The respective absorbance was noted and the result was indicated by % RSD and results were shown in Table-6.
Table 6: Robustness studies data of proposed method
S. no Concentration ( µg / ml ) Absorbance 230 nm 233 nm 235 nm
1 10 0.409 0.424 0.417
2 10 0.408 0.438 0.421
3 10 0.407 0.435 0.416
4 10 0.407 0.440 0.423
5 10 0.405 0.446 0.427
6 10 0.407 0.445 0.448
Average 0.407167 0.438 0.425333
S.D 0.001329 0.008024 0.01180
%R.S.D 0.0225 0.133 0.196
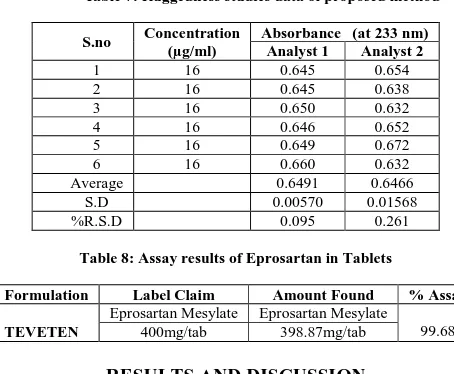
[image:5.595.180.407.470.657.2]Ruggedness: Ruggedness of the method was determined by carrying out the analysis by two different analysts and the respective absorbance was noted. The result was indicated by % RSD and results were shown in Table-7.
Table 7: Ruggedness studies data of proposed method
S.no Concentration (µg/ml)
Absorbance (at 233 nm) Analyst 1 Analyst 2
1 16 0.645 0.654
2 16 0.645 0.638
3 16 0.650 0.632
4 16 0.646 0.652
5 16 0.649 0.672
6 16 0.660 0.632
Average 0.6491 0.6466
S.D 0.00570 0.01568
%R.S.D 0.095 0.261
Table 8: Assay results of Eprosartan in Tablets
Formulation Label Claim Amount Found % Assay
TEVETEN
Eprosartan Mesylate Eprosartan Mesylate
99.68
400mg/tab 398.87mg/tab
RESULTS AND DISCUSSION
%RSD values which are less than 2%. The results of assay show that the amount of drug was in good agreement with the label claim of the formulation as indicated by % recovery (99.68%).
CONCLUSION
The proposed method was simple, sensitive, and cost-effective. It was validated in terms of precision, linearity and accuracy. The results are reproducible, and can be used successfully for the estimation of Eprosartan in bulk and its pharmaceutical formulations.
Acknowledgements
The authors are thankful to Dr. M.Chinna Eswaraiah, Principal of Anurag Pharmacy College and thankful to Management of Anurag Pharmacy College for providing all types of facilities for this research work and also thankful to Bio-Leo Analytical Lab pvt.Limited, Hyderabad, for providing the gift sample of the drug.
REFERENCES
[1] The Merck Index, Merck Research Laboratories, 14th edition, (Monograph #3635), 2006, 621.
[2] AG Gilman, JG Hardman, LE Limbird, the Pharmacological Basis of Therapeutics, New York: McGraw‐Hill; 1996, 733–758.
[3] S Rewar; BK Bansal; CJ Singh; AK Sharma, International Journal of Research and development in Pharmacy
and Life Sciences, 2014, 3(6), 1300-1303.
[4] K Anandakumar; K Vijaya Santhi; M Jayamariappan, IJPIR, 2011, 1(1), 22-27.
[5] V Raja Kumar; Akshay Kumar Pattnaik; Alok Sahu;K Vasantha Lakshmi and BVV Ravi Kumar, Research
Journal of Pharmaceutical, Biological and Chemical Sciences, 2011,2(3), 460-466.
[6] Dr. K Veerreddy; P Tejakumar; K Sunil; B Sandeep, Journal of Pharmacy Research, 2012, 5(8).
[7] V Kiran kumar; N Appala raju; JVLN Seshagiri rao and T Satyanarayana. Oriental Journal of Chemistry, 2009, 25(3), 711-714.
[8] Manish Thimma raju; G Srikanth; J Venkateshwar rao; K R S Sambasivarao, International Journal of Pharmacy
and Pharmaceutical Sciences, 2011,3(2),191-194.
[9] G Sharanya; T Sridhar; V Raj Kumar; N Vijay Kumar, International Journal of Pharmacy and Pharmaceutical
Sciences, 2014, 6(2), 446-451.
[10] Kamepalli Sujana; Medavankala Zabuda; Hamuthala Vimmy, World Journal of Pharmacy and
Pharmaceutical Sciences, 2014, 3(12), 1403-1410.
[11] J Vinayak; Dalvi Daksha; D Parmar; P Atmaram Tambe; V Vineeta; Khan vilkar; J VilasRao Kadam, An
International Journal of Pharmaceutical Sciences, 2013, 4(4), 371-387.
[12] M M Kamila; N Mondal & L K Ghosh, Indian Journal of Chemical Technology, 2008, 15, 194-196. [13] Validation of Analytical Procedure: Methodology, ICH Harmonized tripartite Guideline, 1996.