i
UNIVERSITI TUN HUSSEIN ONN MALAYSIA
STATUS CONFIRMATION FOR MASTER’S THESIS
DEVELOPMENT OF A MICROFLUIDIC DILUTION AND INFUSION PUMP SYSTEM
ACADEMIC SESSION : 2015/2016
I, MUHAMMAD SHARIL BIN SARIPAN agree to allow this Master’s Thesis to be kept at the Library under the following terms:
1. This Master’s Thesis is the property of Universiti Tun Hussein Onn Malaysia. 2. The library has the right to make copies for educational purposes only.
3. The library is allowed to make copies of this report for educational exchange between higher educational institutions.
4. ** Please Mark (√)
CONFIDENTIAL
(Contains information of high security or of great importance to Malaysia as STIPULATED under the OFFICIAL SECRET ACT 1972)
RESTRICTED (Contains restricted information as determined by the Organization/institution where research was conducted)
FREE ACCESS
_________________________
Approved by,
__________________________
(WRITER’S SIGNATURE) (SUPERVISOR’S SIGNATURE)
Student’s name
MUHAMMAD SHARIL BIN SARIPAN
Date: ___________________
Supervisor’s name
PM.DR. SOON CHIN FHONG
Date : ________________________
NOTE:
** If this Master’s Thesis is classified as CONFIDENTIAL or RESTRICTED, Please attach the letter from the relevant authority/organization stating reasons and duration for such classifications.
DEVELOPMENT OF A MICROFLUIDIC DILUTION AND INFUSION PUMP SYSTEM
MUHAMMAD SHARIL BIN SARIPAN
A thesis submitted in
Fulfillment of the requirement for the award of the Degree of Master of Electrical Engineering
Faculty of Electrical & Electronic Engineering Universiti Tun Hussein Onn Malaysia
ii
I hereby declare that the work in this thesis is my own except for quotations and summaries which have been duly acknowledged.
Student : ………..
Muhammad Sharil bin Saripan
Date : ……….
Supervisor : ………..
PM Dr Soon Chin Fhong
iii
ACKNOWLEDGEMENT
iv ABSTRACT
v ABSTRAK
Pada tahun terkini, banyak kajian penyelidikan dalam bidang biological yang memerlukan penggunaan microfluidic cip dalam pengujian makmal, antara salah satu contoh alatan yang digunakan adalah microfluidic cip pencairan yang digunakan untuk proses mencairkan kelikatan cecair yang digunakan. Salah satu aplikasi pencairan yang digunakan dalam pengujian adalah rawatan cytochemical. Oleh yang demikian, untuk memisahkan kelikatan cecair didalam microfluidic cip, satu infusion pam telah dibangunkan dan direka dengan tujuan untuk mengalirkan cecair ke dalam microfluidic cip dengan kadar pengaliran yang berbeza. Kadar pengaliran yang telah
ditetapkan didalam system pam adalah 0.5, 1 dan 2 ml/min. Tujuan kadar pengaliran yang berbeza untuk melihat keberkesanan pencairan di dalam microfluidic cip.
Infusion pam dibina dengan menggunakan Arduino sebagai pengawal utama
vi
TABLE OF CONTENTS
CHAPTER TITLE PAGE
DECLARATION i
ACKNOWLEDGEMENTS iii
ABSTRACT iv
ABSTRAK v
TABLE OF CONTENTS vi
LIST OF FIGURE ix
LIST OF TABLE xiii
CHAPTER 1 INTRODUCTION 1
1.1 Microfluidic background 1
1.2 Project background 1
1.3 Problem statement 2
1.4 Objectives of project 2
1.5 Project scopes 3
CHAPTER 2 LITERATURE REVIEW 4
2.1 Physics of microfluidic 4
2.1.1 Reynold’s number 4
2.1.2 Fluidic resistance 5
2.1.3 Beer’s lambert law 5
2.2 Fabrication of microfluidic 6
2.2.1 Photolitography 6
2.2.2 Master molding process 7
2.2.3 Advantages and disadvantages of PDMS 8
2.3 Types of infusion syringe pump 9
2.3.1 Neonatal syringe pump 9
2.3.3 Self-aligning gas or liquid micropump 11 2.3.4 Micro-jet pump for microfluidic system 12
2.4 Micromixer dilution 13
2.4.1 Types of microfluidic mixer 14 (a) Single-target dilution microfluidic 14 (b) Digital microfluidic biochip 15 (c) Rectangular mixing channel 15 (d) Vibrating microplate mixer 16 (e) Serial dilution micromixer 16 (f) Straight, square wave and 3D
serpentine micromixer
17
(g) One channel micromixer 18 2.4.2 Applications of microfluidic mixers 18 2.5 Comparison of previous projects 19
CHAPTER 3 METHODOLOGY 24
3.1 The flow chart of the project 24
3.2 Development of the infusion pump system 26 3.2.1 Block diagram of the infusion syringe
pump system
26
3.2.2 Operation of the infusion pump system 28 3.3 Design and development of the infusion pump 29
3.3.1 Simulation of the electronic circuit simulation
29
3.3.2 Prototype design of the infusion pump device
31
3.4 Characterization of linear slider rotation speed 32 3.5 Design of the microfluidic mixer device 33 3.6 Design of microfluidic dilution chip using COMSOL multiphysics version 5.1 software
34
3.7 Microfluidic fabrication process 36
3.8 Absorbance of the fluid dilution calculation 39
viii
CHAPTER 4 RESULTS AND DISCUSSION 49
4.1 Introduction 49
4.2 Simulation of the mixing function at the merging channel result
49
4.3 Main menu system interface functions 50 4.4 The infusion pump system model developed 51 4.5 Motorised linear slider produced 52
4.6 Flow rate calibrations test 53
4.7 Calibration result analysis 56
4.8 Calibration results of stepper motor speed 58
4.9 Dilution concentration result 60
4.10 Dilution spectrum 62
4.11 Determine the concentration of the green fluid dye
at wavelength of 330
63
(a) High concentrate dilution concentration 63
(b) Less concentrate dilution concentration 64
(c) Less diluted dilution concentration 64
(d) Much diluted dilution concentration 65
4.12 Drawbacks of the project development 66
CHAPTER 5 CONCLUSION 67
5.1 Future improvements and suggestions 67
REFERENCES 68
APPENDIX A (ZD-6560-V3 2.5A MOTOR DRIVER) 70
APPENDIX B (LCD DISPLAY) 71
LIST OF FIGURE
Figure 2.1 (a) Tube channel of microfluidic 5
Figure 2.1 (b) Formula used to calculate fluid resistance 5 Figure 2.2 (a) Absorption sample of concentration 5
Figure 2.2 (b) Beer’s lambert law formula 5
Figure 2.3 Photolithography process 7
Figure 2.4 Master mold process 7
Figure 2.5 (a) Novel mechanical syringe pump design 9
Figure 2.5 (b) Measurement result 9
Figure 2.6 (a) Magnetic coupling structure of in-line gear pump 10 Figure 2.6 (b) Flow rate versus pump rotation speed for
theoretical and measurement in-line gear pump
10
Figure 2.7 (a) Measurement setup for micropump illustration 11 Figure 2.7 (b) Measurement result for the flow rate 11 Figure 2.7 (c) Measurement setup for gas pump 12 Figure 2.7 (d) Measurement result for gas pump 12 Figure 2.8 (a) Image of micro-jet pump fabricated 13 Figure 2.8 (b) Schematic diagram of micro-jet pump 13 Figure 2.9 Classification scheme of micromixer 14 Figure 2.10 Top and cross-sectional view of digital
microfluidic (DMF) biochip
14
Figure 2.11 Schematic design of digital microfluidic biochip 15 Figure 2.12 Block diagram of setup for mixing pressure-
driven microfluidic
15
Figure 2.13 Channel of microfluidic geometry and operating parameter
16
Figure 2.14 Channel of microfluidic design using COMSOL 16 Figure 2.15 Graphical abstract for serial dilution experiments
of microorganisms’ growth in bacteriological
17
Figure 2.16 3 types of micro-channel used to determine the fluid velocity in micro-channel
x
Figure 2.17 Schematic of two input reservoir of microfluidic to mix two different fluid
18
Figure 3.1 Flow chart for project methodology 25 Figure 3.2 Block diagram of the mechanical system 26 Figure 3.3 Illustration block diagram of infusion pump 27 Figure 3.4 Flow chart operation of infusion pump system 28 Figure 3.5 The circuit controller, input switches and output
indicators
29
Figure 3.6 Direction and stepping pin connected to the Arduino board from motor driver ZD-6560-V3
30
Figure 3.7 LCD display connection pin 31
Figure 3.8 Prototype infusion pump device 32
Figure 3.9 Digital laser tachometer 33
Figure 3.10 (a) Finished microfluidic dilution sticker template 34 Figure 3.10 (b) Paint illustration of microfluidic dilution device 34 Figure 3.11 Design of microfluidic dilution and mixing using
COMSOL software
35
Figure 3.12 Stick template to petri dish 36
Figure 3.13 Coating of microfluidic 36
Figure 3.14 Heating process was used to cure the PDMS and vacuum process used to remove bubbles
37
Figure 3.15 Microfluidic pattern heated 37
Figure 3.16 Remove microfluidic pattern 38
Figure 3.17 Coated PDMS mixture and reheated 38
Figure 3.18 Create hole and tubing pipe installation 38
Figure 3.19 Complete microfluidic device 38
Figure 3.20 Absorbance formula for difference the dilution result
39
Figure 3.21 Header files source code 39
Figure 3.22 Pin declaration for input and output port 40
Figure 3.23 Stepper pin configuration 40
Figure 3.24 Connection from ZD-6560-V3 motor driver to Arduino pin
Figure 3.25 Pin used to active the liquid crystal 41
Figure 3.26 Declaration for the push button 41
Figure 3.27 Startup program to initialize the LCD 42
Figure 3.28 Void function for slow speed 42
Figure 3.29 Void function for medium speed 43
Figure 3.30 Void function for high speed 43
Figure 3.31 Void reverse function 44
Figure 3.32 Void stop function 44
Figure 3.33 Loop process function 45
Figure 3.34 Selective program “A” 46
Figure 3.35 Selective program “B” 46
Figure 3.36 Selective program “C” 47
Figure 3.37 Selective program “D” 47
Figure 3.38 Selective program “E” 48
Figure 4.1 Simulation result for the velocity of the fluid flow in the microfluidic channel
50
Figure 4.2 Main menu interface message 50
Figure 4.3 Flow rate of 0.5 ml/min button process 50 Figure 4.4 Flow rate of 1 ml/min button process 51 Figure 4.5 Flow rate of 2 ml/min button process 51 Figure 4.6 Linear slider move in reverse process 51 Figure 4.7 Model of the infusion pump designed 52 Figure 4.8 Structure design of the linear slider 53 Figure 4.9 Graph flow rate of 0.5 ml/min collected from the
repetition of 3 experiments
54
Figure 4.10 Graph flow rate of 1 ml/min collected from the repetition of 3 experiments
55
Figure 4.11 Graph flow rate of 2 ml/min collected from the repetition of 3 experiments
56
Figure 4.12 Graph shows the flow rate collected at different step size
57
Figure 4.13 Graph analysis between the relationship of flow rate with speed and step size measured
xii
Figure 4.14 RPM result comparison 59
Figure 4.15 Motor speed result with and without syringe inserted
60
Figure 4.16 Dilute concentration of fluid in microfluidic chip 61 Figure 4.17 Different types of fluid concentration obtained
from the three outlets of microfluidic mixer device for a flow rate of 2 ml/min
61
Figure 4.18 Light absorbed from different fluid concentration 63 Figure 4.19 Concentration obtained from the high concentrate
solution
64
Figure 4.20 Concentration obtained from the less concentrate solution
64
Figure 4.21 Concentration obtained from the less diluted solution
65
Figure 4.22 Concentration obtained from the much diluted solution
65
Figure 4.23 Absorbance of different dilution with the concentration collected
LIST OF TABLE
Table 2.1 Applications of Microfluidic mixer used in the previous project developed
18
Table 2.2 Comparison of different syringe pump systems for use with microfluidic device
20
Table 2.3 Comparison between project application techniques in microfluidic device
21
Table 3.1 Parameter set on the microfluidic input channel 35 Table 3.2 Material parameter set for water in inlet channel 35 Table 3.3 Material parameter for the green food colouring dye 36 Table 4.1 Calibration result for 0.5 ml/min flow rate by using step
size of 280 with 3 different result
53
Table 4.2 Calibration result for 1 ml/min flow rate by using step size of 560 with 3 different result
54
Table 4.3 Calibration result for 2 ml/min flow rate by using step size of 1120 with 3 different result
55
Table 4.4 Collected data from calibrating test 57
Table 4.5 RPM measurement result comparison 59
Table 4.6 Motor speed test from flow rate result with load and unloaded syringe
60
Table 4.7 Total absorbance of light for different dilution 62 Table 4.8 Concentration of green food colouring dye obtained
from different dilution result
1
CHAPTER 1
INTRODUCTION
1.1 Microfluidic Background
Microfluidic is a multidisciplinary field that investigates the behaviour of fluids itself at the micro scale to pico scale of fluid [1] The application of microfluidic devices are such as the chemical reaction, control volume of fluid or to manipulate small samples volume such as for lab-on-chip application [1,2]. Channels in the microfluidic device can be used to control the movement of fluids in micro or nano metric volume. Polydimethylsiloxane (PDMS) is the main material used for the manufacturing of micro-fluidic device [3,4]. In this project, a microfluidic device will be used as an input for the fluid injected by the infusion pump.
1.2 Project background
The syringe pump will made up with 2 mode of microfluidic device, which will use infusion process for both solvent and distilled water. The purpose for the project develop to separate the concentration of chemical solution by infuse a volume of distilled water then mix with an amount of chemical solution to find the concentration of the solution by using dilution process. , the 2 tier of microfluidic will design with 4 outlets for the dilution process. The 2 tier input will be the distilled water and solvent, both of the substances will flow through the 4 flow channel of microfluidic to mix both solution to separate the concentration obtain through the 4 outlet of the microfluidic device.
1.3 Problem Statement
Current problem occurred in the design of syringe pump system was the control of speed and the volume flow in µl/min. The problem were not satisfies some user when they handling some experiment for the micro-fluidic. In other word, the drive of fluid will flow overload or not follow the specification as the accuracy for every reading will affect the record taken. All this will result in micro-fluidic channel flow from the liquid that drive in from the syringe pump system. This problem occurred due to the fluid drive from the syringe pump which the speed of motor affects the fluids driving to the micro-fluidic.
1.4 Objectives of the project
The main objectives of this project are:
To design and fabricate a microfluidic mixer that performs serial dilutions
To develop an infusion pump with various flow rates of 0.5, 1 and 2 ml/min
To separate the concentration of fluid intensity
To produce four dilutions of two different liquids
3
1.5 Project scopes
The following are the scope of project which is:
Using Comsol Multiphysics version 5.1 for modelling the microfluidic simulation design
Programming software microcontroller to control the current driver to a motorised linear slides.
Design model of infusion pump using Sketchup software.
Design model of microfluidic using AutoCAD
CHAPTER 2
LITERATURE REVIEW
The literature review covered the past research related to the background of flow mechanic for microfluidics and electronics of different liquid pump system. The physics of microfluidic were reviewed and reported in this chapter. Surveying the past literature review from a sources like journal, conference proceeding, articles and dissertations with a purpose for collecting data that related to the work field research progress development to avoid reinventing the research already conducted on the topic.
2.1 Physics of microfluidic
2.1.1 Reynolds’s number
In microfluidic, laminar flow in the micro channel is very important to predict the flow of droplet or particle in the fluid stream in function of fluid density, velocity, pressure and fluid viscosity. Thus, The Reynolds number (Re) formula is used to describe the parameter involve for the fluid flows in a microfluidic channel. The Reynolds number can be calculated by using equation 2.1,
𝑅𝑒 =
⍴𝜐Lµ
(2.1)
in which ⍴ is the fluid density, 𝜐 is the velocity of fluid,
µ is the dynamic viscosity and
5
2.1.2 Fluidic resistance
[image:19.595.165.491.251.383.2]Fluidic resistance occurred in the channels of both input and output stream is governed by a set of equations whole solutions are well known [17]. The flow rate presence within the micro channel given by formula of Q= ΔP/R, where Q is the flow rate, ΔP is the pressure drop occurred across the channel, and R is the channel resistance. Meanwhile, the resistance of a circular geometry can be calculated by the formula of,
Figure 2.1: (a) Tube channel of microfluidic, (b) Formula used to calculate fluid resistance
From the Figure 2.1 as shown, the fluid resistance on the microfluidic channel as shown in (a) calculated by using the formula on (b) where µ is the fluid viscosity, L is the channel length, and r is the channel radius and R is the total resistance in the tube channel.
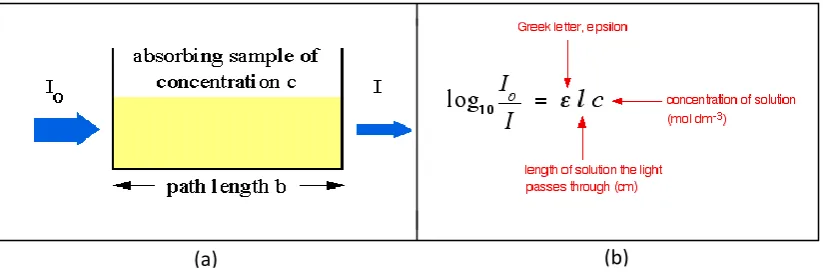
2.1.3 Beer’s lambert law
[image:19.595.119.531.600.736.2]In the spectrophotometer, the efficiency of the microfluidic mixer can be tested by measuring the light absorption or spectroscopy of each light in different dilution.
Figure 2.2: (a) Absorption sample of concentration, (b) Beer’s lambert law formula
(b) (a)
(b) (a)
𝑹 =
𝟖µ𝑳
𝝅𝒓
𝟒Figure 2.2 shows the relationship between absorption of concentration sample the wavelength transmittance of liquid in the microfluidic channel as shown in (a) can be accessed by beer’s lambert law (b) with the formula given by Absorbance = εLc. In this equation,
ε
is the molar extinction coefficient, L is the path length of light passed
and c is the liquid concentration from the outlet stream of micro channel.2.2 Fabrication of microfluidic
In this section, method of microfluidic fabrication discussed which there are two process of microfluidic fabrication which ise photolithography and molding [6].
2.2.1 Photolithography
7
Figure 2.3: Photolithography process
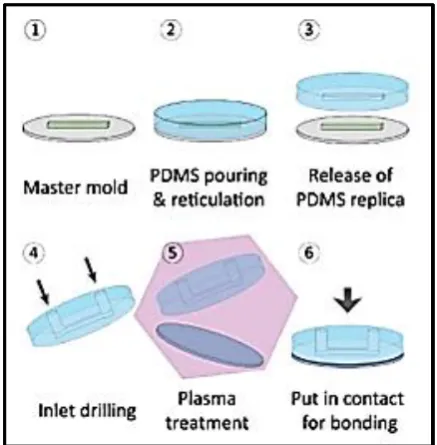
2.2.2 Master molding process
Molding process is a common process used in the fabricating of microfluidic in PDMS. It is used the silicone polymer based at ambient temperature to fabricate the microfluidic. Molding commonly is a fabricating process after the photolithography process is done.
Figure 2.4: Master mold process
[image:21.595.210.429.466.689.2]mould by pouring the PDMS onto the mould. Then, an elastomer silicone gel and curing agent poured to the mould and heated at high temperature. Next process is to remove the hardened PDMS from the mould to obtain the micro-pattern of the PDMS chip. Then, the process continued to create a hole for the input and output channels of the microfluidic by using the holes puncher with size of 2 mm is commonly used. Next, the PDMS and the glass slide were treated using plasma treatment. This is allow for both of the microfluidic and glass slide can be bonded.
2.2.3 Advantages and disadvantages of PDMS
From the technological point of view in developing and fabricating of PDMS in, there are some advantages and disadvantages measured from the intrinsic properties which is:
Advantages of PDMS i. Cheap.
ii. Biocompatible to all field in science or biological field application. iii. It contain low auto fluorescence.
iv. PDMS can be replicate by using plasma treatment to formed sealed microfluidic device.
Disadvantages of PDMS
i. PDMS can absorb small hydrophobic molecules especially in cell biology application.
ii. Sensitive to expose with certain chemicals. iii. Difficult to integrate with small electrode.
9
2.3 Types of infusion syringe pump
2.3.1 Neonatal syringe pump
The neonatal syringe pump is used to deliver proper neonatal IV therapy accessible. This device is capable to produce a flow rate between 5cc/hr to 40cc/hr for standard syringe used with error produced within 15% and the delivery of intravenous operation and volume at low infusion rates of (<20ml/hr) used by control the over flow rates of the fluid flows through microfluidic channel. The prototype design were tested for 20cc, 30cc, and 60cc syringes at room temperature (25𝑜 C). These systems
[image:23.595.119.535.349.533.2]operate by driving the plunger of a syringe at controlled velocity to dispense fluids through Intravenous (IV) channel [5].
Figure 2.1: Volume dispensed during two runs of 15cc/hr with a 20cc syringe pump [6]
Figure 2.5: (a) Novel mechanical syringe pump design and (b) Measurement result
The neonatal syringe pump prototyped as shown in the Figure 2.5 discussed the (a) flow rate delivered data for two different runs of 5 cc and 40 cc to determines the volume dispensed (ml) within 60 seconds and (b) shows the prototype design for the syringe pump with a driving mass to drive the plunger of the syringe for delivery of fluid purpose.
(a) (b)
Plunger
2.3.2 In-line gear pump
The experiment develops to determine the performance demonstrates a viable pump to the syringe pumps for flowing fluid in micro-instrumentation by comparing the first in-linear gear pump and second stage in-line gear pump [6]. The process of the system to compare the flow rates of the flowing fluid from the syringe pump to the different motor used in the experiment. One the pump used in the first experiment is in-linear pump assemble at first stage demonstrated with 350 µl/min at 5000 rpm. Other than that, when using fluid motor, the flow rates generates from the syringe pump resulting of 200 ml/min at 4000 rpm [6].
Figure 2.6 (a): magnetic coupling structure of in-line gear pump [6]
Figure 2.6 (b): Flow rate versus pump rotation speed for theoretical and measurement in-line
[image:24.595.219.423.304.424.2] [image:24.595.188.448.474.648.2]11
2.3.3 Self-aligning gas or liquid micropump
In this section, a piezoelectric driven silicon membrane pump and passive dynamic valve [7] developed to tolerant the relationship between the pump gases and liquid with the gas bubble. The project development progress are used to reduce the dead volume of fluid produced by the micropump thus increasing the compression ratio from the gas pumping. The outcome of the project shows that the flow rate produced a 1500 µl/𝑚𝑖𝑛−1 for liquid pump and 690 µl/𝑚𝑖𝑛−1 for gas pump.
Figure 2.7 (a): Measurement setup for Micropump illustration and (b) Measurement result
for the flow rate [7]
As shown in Figure 2.7, the setup for the micro-pump included the inlet and outlet channel tube that connected between the micro-pump with a purpose to deliver the fluid and the Perspex test jig is used to observe the presence of adhesive between the inlet and outlet valve. Meanwhile for (b), it shows the result of measured pump rate at zero backpressure over a frequency range between 0.5 KHz and 3.5 KHz. From the result, the flow rate achieved at 1500 µl/𝑚𝑖𝑛−1 with frequency of 2.5 KHz.
Next, is the measurement setup discussed installation setup for the gas pump testing with a water beaker included and the outlet valve placed 4 mm inside the water beaker containing water. The setup proposed to measure the gas presence in the beaker when the micropump started to infuse the fluid as illustrated in Figure 2.7 (c).
[image:25.595.123.552.252.438.2]Figure 2.7 (c): Measurement setup for gas pump [7]
Figure 2.7 (d): Measurement result for gas pump [7]
From the result as shown in the Figure 2.7 (d), the measurement for gas pump repeated by 3 test with a result shows the gas started to pump at the frequency of 3.5 KHz. Thus, it resulting with approximate gas pump rate of 690 µl/min−1 at a frequency of 3.4 kHz is calculated.
2.3.4 Micro-jet pump for microfluidic system
[image:26.595.194.448.73.191.2] [image:26.595.211.429.232.376.2]13
Figure 2.8 (a): Image of micro-jet pump fabricated [8]
Figure 2.8 (b): Schematic diagram of micro-jet pump [8]
2.4 Micromixer dilution
[image:27.595.221.419.68.251.2] [image:27.595.210.413.299.416.2]Figure 2.9: Classification scheme of micro-mixer [9]
2.4.1 Types of microfluidic mixer
(a) Single – target dilution microfluidic
Digital microfluidic (DMF) biochip [10,11] was used to developed a single-target dilution by using several reagent with different concentration level for a dilution process and mapping lab-bench protocol for an automate process. This process of dilution used to minimizing the number of mix split-step of fluid and to minimize the waste droplet during the automated sample preparation. The project also developed a new dilution algorithm called Improved Dilution/Mixing Algorithm (IDMA) to maximize the reuse of intermediate droplet generated during process.
[image:28.595.158.481.542.680.2]15
(b) Digital microfluidic biochip
[image:29.595.225.409.249.371.2]The project developed to design a chip and mapping lab-bench protocol [9] to carry out dilution process of biochemical samples. Dilution/Mixing algorithm developed to creation automation technique to reduce the production of waste droplets. The digital microfluidic designed consists of two 0(n)-size rotary mixers and 0(n) storage electrodes [10]. The droplet of fluids flows by applying the voltage control and electrode adjacent at the same time. The patterns of control voltage varying the merging, mixing and splitting of the biochemical droplet samples.
Figure 2.11: Schematic design of digital microfluidic biochip [11]
(c) Rectangular mixing channel
A method of mixing process in the micro-channel flows of microfluidic developed measured and analysed the pressure during drive the fluid. Thus both of the two fluid streams in pressure driven rectangular microfluidic channel [12]. Spectral method were used in three dimensional equation to determine the non-uniform and uniform mixing process for both fluids. The project carries out by analyse and measure the mix of two fluids on silicon and poly (methyl methacrylate) (PMMA) based T-type micro mixers.
[image:29.595.197.434.605.731.2](d) Vibrating micro-plate mixer
[image:30.595.191.447.293.370.2]Mixing concept based on a vibrating micro-plate in microfluidic channel [13,14] project developed to determine and to find the efficient mixing of solvent in microfluidic. It done by decrease the diffusion path and increase the contact area between fluids to be mixed. It used numerical investigation conducted by COMSOL to determine the parameter of flow velocity, amplitude and frequency of vibrating plate. Method used for this project by design two fluid streams with different concentration flow into upper and down half of microfluidic channel. The channel design with 250µm length and 50µm depth, meanwhile the micro-plate dimension is 20µm length and 5µm depth.
Figure 2.13: Channel of microfluidic geometry and operating parameter [13]
Figure 2.14: Channel of microfluidic design using COMSOL [13]
(e) Serial dilution micro-mixer
[image:30.595.181.460.415.504.2]17
Figure 2.15: Graphical abstract for serial dilution experiments of microorganisms’ growth in
bacteriological [14]
(f) Straight, square wave and 3D serpentine micro-mixer
The other applications that used in microfluidic is mixing [13]. This project developed to study about the computational of mixing a fluids in micro-channel to define the mixing efficiency of fluid in straight, square-wave and three dimensional (3D) serpentine micro-channels [1]. This project used COMSOL Multiphsyics [15] to determine the velocity of fluids flow and use CATIA v6 software. To characterized the mixing efficiency of fluids, this project used fluid concentration from 0mol/𝑚3 and 50mol/𝑚3 with water and dilute with two different inlets in the
[image:31.595.246.391.479.660.2]micro-channel.
Figure 2.16: 3 types of micro-channel used to determine the fluid velocity in micro-channel
[15]
was handled by using (a) straight micro-mixer, then the test repeated by using (b) square wave micro-mixer and lastly (c) Serpentine micro-mixer.
(g) One channel micro-mixer
[image:32.595.213.416.327.453.2]The project developed to studies about the fundamental concept of mixing fluids with the microfluidic devices. The studies taking the consideration for the design of the mixing application performances such as mixing index and residence time [16]. The gradient of the concentration of the species of fluid mixed called Fick’s Law [17] defined to relate it with the proportional of flux to the gradient between two reservoirs in the microfluidic devices to carry out the process of random motion for fluid and the instantaneous state during the process.
Figure 2.17: Schematic of two input reservoir of microfluidic to mix two different fluid [16]
2.4.2 Applications of microfluidic mixers
From the previous literature review for the microfluidic mixers, the Table 2.1 shows the summarization concluded from the previous literature review to define the applications of various type the microfluidic mixer used in the microfluidic project.
Table 2.1: Applications of Microfluidic mixer used in the previous project developed
Types of Micromixer Application
i. Single – Target Dilution Microfluidic a) To minimize number of mix split-step of fluid.
b) To minimize waste droplet. c) Develop IDMA [9] algorithm to
[image:32.595.105.531.625.753.2]19
intermediate droplet.
ii. Digital Microfluidic Biochip a) Dilution for biochemical droplet sample.
b) To reduce the production of waste droplet.
iii. Rectangular Mixing Channel a) Determine the non-uniform and uniform mixing process.
b) Measure pressure of fluid in channel.
iv. Vibrating Microplate Mixer a) Find the efficient mixing of solvent in microfluidic with two fluid streams with different concentration flow into upper and down half of microfluidic channel.
v. Serial Dilution Micromixer a) To determine the estimation of microbial counts obtained
b) Investigate the microorganisms’ growth on bacteriological media.
vi. Straight, Square – Wave & 3D Serpentine
a) To define the mixing efficiency of fluid
vii. One Channel Micromixer a) Define the mixing index and residence time gradient of the concentration of the fluid mixed
2.5 Comparison of previous projects
Table 2.2: Comparison of different syringe pump systems for use with microfluidic device
Associated Project Flow Rate Material Use Reference
i) Novel Mechanical Syringe Pump
i. Flow rate from 5cc/hr to 40cc/hr
i) electric motor ii) Neonatal Syringe
Pump (NeoSyP)
iii) Syringe Plunger
Cynthia Sung et al.
2011 [5]
ii) In Line Gear Pump
i) 350 µl/min at 5000 rpm
ii) 200 ml/min at 4000 rpm
i) Microfabricated pump
ii) In-linear gear pump
Andrew S.Dewa et al. 1997 [6]
iii)
Self-Aligning/ Liquid Micropump
i) 1500
µl/𝑚𝑖𝑛−1 for
liquid pump
ii) 690 µl/𝑚𝑖𝑛−1
for gas pump
i) Micropump C.G.J Schabmuller et al. 2002 [7]
iv) Micro-Jet Pump i) Pressure of 2kPa
i) Vacuum suction Xiuhan Li et al. 2006 [8]
21
Table 2.3: Comparison between project application techniques in microfluidic device
Associated Project
Project Description Method References
i) Waste-aware Single-target Dilution of a Biochemical Fluid Using Digital Microfluidic (DMF) Biochips
i) Dilution process of a biochemical by using a digital microfluidic (DMF) biochips [9] and mapping lab-bench protocol for an automate process.
i) Digital microfluidic (DMF) biochips
ii) Improved Dilution/ Mixing Algorithm (IDMA)
Sudip Roy et al. 2015 [10,11]
ii) Analysis and Measurement of Mixing in Pressure-Driven Microchannel Flows
i) Determine the non-uniform and uniform mixing process for both fluids
ii) Analyse and measure the mix of two fluids on silicon and poly (methyl methacrylate) (PMMA) based T-type micro mixers
i)Spectral method 1. Jerry M. Chen et al. 2006 [12]
iii)Simulation of a Vibrating-Plate based
Micromixer
i) To studies a mixing concept based on a vibrating microplate in microfluidic channel to achieve an efficient mixing
i) COMSOL Software 1. Hongwei Sun et al. 2006 [13]
iv) Estimation Method for
i) To determine the estimation of
i) Agar Plate used from 2 to 100 ml
Serial Dilution Experiments
microbial counts obtained with the serial dilution technique
ii) The techniques to investigate the microorganisms’ growth on bacteriological media and develop into colony
ii) Amicrobial counts between 104and 1012 microns of colony-forming units
iii) 6.25 to 200 of size ratio for plate size
2014 [14] v) Computational Analysis for Mixing of Fluids Flowing through Micro-Channels of Different Geometries
i) To define the
mixing efficiency of fluid in straight, square-wave and three dimensional (3D) serpentine micro-channels.
ii) Fluid concentration from 0 mol/𝑚3 and 50 mol/𝑚3 with water and dilute with two different inlets in the micro-channel.
i) COMSOL software ii) Catia v6 software
1. Sankha Shuvra Das et al. 2014 [15]
vi) A Review on Mixing in Microfluidics
i) To studies about the fundamental
concept of mixing fluids with the microfluidic devices
i) Using two reservoir on microfluidic technique
23
CHAPTER 3
METHODOLOGY
This chapter included the discussion on the design and simulation for the microfluidic dilution device, the development of the infusion pump, and verification of the performance of the infusion pump and the fabrication of the device. The flow and pressure formed in the microfluidic mixer designed for dilution purpose was studied in the Comsol Multiphysic version 5.1 software. While the infusion pump was customised to provide suitable flow rates to achieve the four dilutions required by the project. The calibration steps for the infusion pump to work together with the microfluidic is required in order to prevent problems such as spillage and wastage of fluid from the syringe while performing the desire functions. The design of the microfluidic influenced the flow process when fluid was injected from the infusion pump to the microfluidic device. Thus, the outcome of the project is to produce fluid in different dilution concentrations at the output channel of the microfluidic mixer.
3.1 The flow chart of the project
![Figure 2.1: Volume dispensed during two runs of 15cc/hr with a 20cc syringe pump [6]](https://thumb-us.123doks.com/thumbv2/123dok_us/8761403.894207/23.595.119.535.349.533/figure-volume-dispensed-runs-cc-hr-syringe-pump.webp)


![Figure 2.7 (c): Measurement setup for gas pump [7]](https://thumb-us.123doks.com/thumbv2/123dok_us/8761403.894207/26.595.211.429.232.376/figure-c-measurement-setup-gas-pump.webp)
![Figure 2.8 (b): Schematic diagram of micro-jet pump [8]](https://thumb-us.123doks.com/thumbv2/123dok_us/8761403.894207/27.595.221.419.68.251/figure-b-schematic-diagram-micro-jet-pump.webp)
![Figure 2.9: Classification scheme of micro-mixer [9]](https://thumb-us.123doks.com/thumbv2/123dok_us/8761403.894207/28.595.158.481.542.680/figure-classification-scheme-of-micro-mixer.webp)
![Figure 2.11: Schematic design of digital microfluidic biochip [11]](https://thumb-us.123doks.com/thumbv2/123dok_us/8761403.894207/29.595.197.434.605.731/figure-schematic-design-of-digital-microfluidic-biochip.webp)
![Figure 2.13: Channel of microfluidic geometry and operating parameter [13]](https://thumb-us.123doks.com/thumbv2/123dok_us/8761403.894207/30.595.181.460.415.504/figure-channel-microfluidic-geometry-operating-parameter.webp)
