International Journal of Emerging Technology and Advanced Engineering
Website: www.ijetae.com (ISSN 2250-2459, Volume 2, Issue 7, July 2012)321
Fuzzy Logic Controller Based Analysis of Load
Frequency Control of Two Area Interconnected Power
System
P.V.R.Prasad
1, Dr. M. Sai Veeraju
21 PG scholar, Department of Electrical and Electronics Engineering, S.R.K.R.Engineering College,
Bhimavaram-534204, West Godavari, Andhra Pradesh, India.
2Professor, Department of Electrical Electronics Engineering, S.R.K.R.Engineering College, Bhimavaram-534204,
West Godavari, Andhra Pradesh, India.
1
Abstract—Frequency plays a vital role in power system. In many industries, the speed of the machines depends on the frequency. Any deviation in the frequency may lead to mal-operation of the system. So load frequency control is the key problem in the power system. Works are being done to optimize the controllers to get faster and better results. The present work aims to control the frequency using fuzzy logic control.
The Fuzzy logic controller is applied in load frequency control of two area system , this analysis is done using different fuzzy based rules using linguistic variables i.e., by considering three variables, five variables and seven variables. The results thus obtained are compared against the results using without any controller and by using ordinary PI controllers and PID controller. It is seen that both the transient and steady state response are improved by using this fuzzy logic controller.
Keywords—Fuzzy Logic Controller (FLC), PI controller, PID controller, Fuzzy PI control system, Fuzzy PID control system.
I. INTRODUCTION
Interconnected transmission network supplying the national power balance and synchronize the different manufacturing facilities are required to work. Areas that may occur in one of the failures that may occur to any load change and also affect other regions. One of the most important effects of this type of system is the exchange of power with constant bus voltage and mains frequency. Electric power transmission systems to provide high quality and constant power load changes caused by oscillation frequency and voltage values must be removed as soon as possible.
Fixed frequency is an important factor for power systems quality. Subscribers connected to the energy system at a frequency of changes in energy demand leads to some of the harmonics. Load frequency control system should identify these changes and should not be considered a distortion. Electric power systems, power system stability under normal operating conditions to remain stable operating condition and after exposure to a perturbation makes it possible to attain an acceptable feature of re-equilibrium state can be defined as. In a sudden change in consumers' demands for power, voltage and frequency control, a complicating factor. At this point, the power system load frequency control, it is important for stability. Load frequency control with voltage and frequency of the system is set. Therefore, the system will be increased power quality.[1-3]
II. INTERCONNECTED POWER SYSTEMS
Modern day power systems are divided into various areas. For example in India, there are five regional grids, e.g. Eastern Region, Western Region etc. Each of these areas is generally interconnected to its neighboring areas. The transmission lines that connect an area to its neighboring area are called tie-lines. Power sharing between two areas occurs through these tie-lines. Two single area power systems are connected through a tie line in order to form an interconnected power system. The main advantage of interconnected power system is to attain the load demand.
The system frequency rises when the load decreases if
ref
P
International Journal of Emerging Technology and Advanced Engineering
Website: www.ijetae.com (ISSN 2250-2459, Volume 2, Issue 7, July 2012)322
For example, area-I may export a pre-specified amount of power to aria – j while importing another pre-specified amount of power from area-k. however it is expected that to fulfill this obligation, area – I absorbs its own load change, i.e. increase generation to supply extra load in the area or decrease generation when the load demand in the area has reduced. While doing this area-I must however maintain its obligation to areas j and k as far as importing and exporting power is concerned. A conceptual diagram of the interconnected areas is shown in Fig.1.
Fig: 1 .Interconnected areas in a power system
SINGLE AREA POWER SYSTEM:
Fig.2.Single area power system
Where
∆Pc(s )= Speed Command Input
∆PD(s )= Load Demand
Ksg = Governor Gain Constant
Tsg = Governor Time Constant
Kt = Turbine Gain Constant
Tt = Turbine Time Constant
Kps = Power System Gain Constant
Tps = Power System Time Constant
R = Speed Regulation Of Governor
DYNAMIC RESPONSE :
The dynamic response of a single area power system under controlled case :
∆F(s) = {-∆Pc(t)KpsR/(R+Kps)} * [1-e-t((R+kps)/RTps)]....(1)
The dynamic response of single area power system under uncontrolled case:
( )
( )
[
(
)
]
………. (2)
TWO AREA INTERCONNECTED POWER SYSTEM
A two area system consists of two single area systems, connected through a power line called tie-line, is shown in the Figure: 3 each area feeds its user pool, and the tie line allows electric power to flow between the areas. Information about the local area is found in the tie line power fluctuations. Therefore, the tie-line power is sensed, and the resulting tie-line power signal is fed back into both areas. It is conveniently assumed that each control area can be represented by and equivalent turbine, generator and governor system. Symbol used with suffix 1 refer to area 1 and those with suffix 2 refer to area 2.
Fig.3. Two area interconnected power system
In an isolated control area case the incremental power
D
G
P
P
&
was accounted for by the rate of increase of stored kinetic energy and increase in area in area load cause by increase in frequency. Since a tie line transports power in or out of an area, this fact must be accounted for in the incremental power balance equation of each area.[7]Tie-lines
Area-i
ΔP
G(s)
+
-
+
K
sg(1+sT
sg)
K
t(1+sT
t)
ΔP
D(s)
ΔF(s)
-
K
ps(1+sT
ps)
1/R
ΔP
C(s)
-
International Journal of Emerging Technology and Advanced Engineering
Website: www.ijetae.com (ISSN 2250-2459, Volume 2, Issue 7, July 2012)323
III. FUZZYLOGIC CONTROLLER
There are three principal elements to a fuzzy logic controller:
Fuzzification module (Fuzzifer)
Rule base and Inference engine
Defuzzification module (Defuzzifier)
[image:3.612.336.553.158.266.2]For Load Frequency Control the process operator is assumed to respond to variables error (e) and change of error (ce).
Fig.4.Fuzzy logic controller
The variable error is equal to the real power system frequency deviation (f). The frequency deviation f is the difference between the nominal or scheduled power system frequency (fN) and the real power system frequency (f). Taking the scaling gains into account, the global function of the FLC output signal can be written as
, ( ) ( ) -……….. (3)
Where, ne and nce are the error and the change of error scaling
gains, respectively, and F is a fuzzy nonlinear function. FLC is dependant to its inputs scaling gains.[4,5,8,9] The block diagram of FLC is shown in Fig.4.
A label set corresponding to linguistic variables of the input control signals, e (k) and ce (k), with a sampling time of 0.01 sec is as follows
( ) * +
(4)
Where, NB = Negative Big
NM = Negative Medium
ZE = Zero
PM = Positive Medium
[image:3.612.72.274.275.336.2]PB = Positive Big
Fig .5.Membership function for the control input variables
Fuzzy logic controller has been used in both the thermal-thermal and hydro-thermal-thermal inter connected areas. Attempt has been made to examine with five number of triangular membership functions (MFs) which provides better dynamic response with the range on input (error in frequency deviation and change in frequency deviation) i.e. universe of discourse is -0.25 to 0.25. The number of rules are 25. The dynamic response are obtained and compared to those obtained with conventional integral controllers. Further, several inputs have been tried out and dynamic responses are examined in order to decide suitable inputs to the fuzzy logic controller (FLC).
The membership functions (MFs) for the input variables are shown in Fig.5.
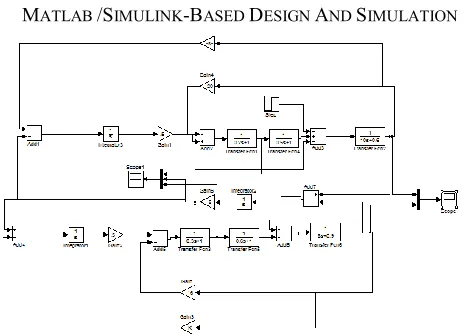
IV. WO AREA INTER CONNECTED POWER SYSTEM IN MATLAB /SIMULINK-BASED DESIGN AND SIMULATION
[image:3.612.324.556.469.636.2]International Journal of Emerging Technology and Advanced Engineering
Website: www.ijetae.com (ISSN 2250-2459, Volume 2, Issue 7, July 2012)324
Fig.7 Two area power system frequency change with PI controller
The above simulation are the result for two area power system using conventional PI controller shows that it has good steady state response i.e.,zero frequency deviation but it has pooor dynamic response,to improve this Fuzzy Logic controller is used.
TABLE.1
THREE VARIABLE RULE BASE
TABLE.2
FIVE VARIABLE RULE BASE
Fig.8 Two area power system with Fuzzy PI controller
Fig.9 Two area power system with Fuzzy PI controller for three variable rule base
The above simulation result shows that steady state response is reached but the dynamic response is poor as compared to PI controller but has high stability gain margin compared to PI controller. So to improve both responses we go for five variable rule base.
0 5 10 15 20 25 30 35 40 45 50 -14
-12 -10 -8 -6 -4 -2 0 2 4 6x 10⁻³
Time(sec)
Fr
eq
ue
nc
y
Ch
an
ge
(p
u)
With PI
0 5 10 15 20 25 30 35 40 45 50
-7 -6 -5 -4 -3 -2 -1 0 1 2x 10
-4
Time(sec)
Fr
eq
ue
nc
y
C
ha
ng
e(
pu
)
fuzzy pi 3 Ce(k)
e(k)
NE ZE PE
NE NE NE ZE
ZE NE ZE PE
PE ZE PE PE
Ce(k)
e(k)
NB NM ZE PM PB
NB NB NB NM NM ZE
NM NB NB NM ZE ZE
ZE NM NM ZE PM PM
PM ZE PM PM PB PB
International Journal of Emerging Technology and Advanced Engineering
Website: www.ijetae.com (ISSN 2250-2459, Volume 2, Issue 7, July 2012)325
Fig.10 Two area power system frequency change with Fuzzy PI controller for five variable rule base
The simulation result shows that dynamic response is improved and steady state is attained at t=32 sec.
TABLE.3
SEVEN VARIABLE RULE BASE
Fig.11 Two area power system frequency change with Fuzzy PI controller for seven variable rule base
The above simulation result with seven variable rule base shows good dynamic response and attain steady state at t=40sec. but it has high compilation time.
Fig:12 Two area power system with PID controller
Fig.13 Two area power system frequency change with PID controller
Fig:14.Two area power system with Fuzzy PID controller
0 5 10 15 20 25 30 35 40 45 50 -7
-6 -5 -4 -3 -2 -1 0 1 2 3x 10
-4
Time(sec)
Fr
eq
ue
nc
y
C
ha
ng
e(
pu
)
with fuzzy pi5
0 5 10 15 20 25 30 35 40 45 50 -6
-5 -4 -3 -2 -1 0 1 2x 10
-4 with fuzz pi7
Time(sec)
Fr
eq
ue
nc
y
C
ha
ng
e(
pu
)
0 5 10 15 20 25 30 35 40 45 50 -14
-12 -10 -8 -6 -4 -2 0 2 4x 10⁻³
Time(sec)
Fr
eq
ue
nc
y
C
ha
ng
e
(p
u)
with PID
Ce(k)
e(k)
International Journal of Emerging Technology and Advanced Engineering
Website: www.ijetae.com (ISSN 2250-2459, Volume 2, Issue 7, July 2012)326
Fig.15. Two area power system frequency change with Fuzzy PID controller for three variable rule base
Fig.16.Two area power system frequency change Fuzzy PID controller for five variable rule base
Fig.17. Two area power system frequency change with Fuzzy PID controller for seven rule base
The simulation results for the two area power system with PID controller shown in fig.13. The simulation of two area power system with Fuzzy PID controller for three, five, seven variable rule base are shown in Fig.15, Fig.16 & Fig.17 respectively. Three variable rule base simulation result shows that steady state response is reached but the dynamic response is poor as compared to PID controller but has high stability gain margin compared to PID controller. So to improve both responses we go for five variable rule base. In five variable rule base simulation result shows that dynamic response is improved and steady state is
attained at t=22sec. In seven variable rule base simulation result shows good dynamic response and attain steady state at t=18sec.
V. CONCLUSION
The usage of Fuzzy PID controller provides better dynamic performance and reduces the oscillation of the frequency deviation as compared to the conventional PI, PID controllers, and Fuzzy PI controller, which provides zero steady state frequency deviation with step load increment in power system, but exhibits poor dynamic performance (such as more number of oscillation and more setting time) in the presence of parameters variation and non-linearity.
Thus the attempt made here was a success. From the above simulation results it is clear that the dynamic response in the proposed method is far better than that of the conventional PI, PID controller and Fuzzy PI controller. All the drawbacks of the PI, PID controller, providing a better dynamic response are eliminated by using a Fuzzy logic controller. Hence we can conclude form the above results that inclusion of fuzzy logic controller is an effective and efficient method of load frequency control with better dynamic response
REFERENCE
[1] George Gross and Jeong Woo Lee. 2001. Analysis of Load Frequency Control Performance Assessment Criteria. IEEE transaction on Power systems 16(3) : 520-525. August.
[2] Elgerd O. I. 1982. Electric Energy System Theory : An Introduction. Mc-Graw Hill.
[3] Jawad Talaq and Fadel Al-Basri. 1999. Adaptive Fuzzy gain scheduling for Load Frequency Control IEEE Transaction on Power systems. 14(1) : 145-150, February
[4] J.Nanda and J.S. Kakkarum. 200. Automatic Generation Control with Fuzzy logic controllers considering generation constrains In : Proc. Of 6th Intl. Conf on Advances in Power System Control
operation and Managements. Hong Kong. November.
[5] A. Magla and J Nanda. 2004. Automatic Generation Control of an interconnected hydro – Thermal System Using Conventional Integral and Fuzzy logic Control. In : Proc. IEEE Electric Utility Deregulation, Restructuring and Power Technologies. April.
[6] John Y.Hong. 1993. Variable Structure Control : A suryvey. IEEE Transaction on Industrial Electronics. 40(1) February.
0 5 10 15 20 25 30 35 40 45 50 -20
-15 -10 -5 0 5x 10
-3 Time(sec) Fr e q u e n c y C h a n g e (p u )
with fuzzy pid3
0 5 10 15 20 25 30 35 40 45 50
-18 -16 -14 -12 -10 -8 -6 -4 -2 0 2x 10
-3 with fuzzy pid5
Time(sec) Fr e q u e n c y c h a n g e (p u )
0 5 10 15 20 25 30 35 40 45 50 -18 -16 -14 -12 -10 -8 -6 -4 -2 0 2x 10
-3 with fuzzy pid7
International Journal of Emerging Technology and Advanced Engineering
Website: www.ijetae.com (ISSN 2250-2459, Volume 2, Issue 7, July 2012)327
[7] Kundur P. 1994. Power System Stability and Control. Mc-Graw Hill, New York.
[8] Timothy. J. Ross. 1995. Fuzzy logic with engineering application. Mc-Graw Hill.
[9] Q.P. Ha.1998. A Fuzzy sliding mode controller for Power System Load Frequency Control. 2nd International Conference of Knowledge