Research Article
CODEN(USA) : JCPRC5
ISSN : 0975-7384
Effects of packaging materials on the lifetime of LED modules under
high temperature test
Lei Nie
1*, Wenjing Xiang
1, Mingxiang Chen
2, Huajing Li
1,2and Quan Chen
21School of Mechanical Engineering, Hubei University of Technology, Wuhan, China
2School of Mechanical Science and Engineering, Huazhong University of Science and Technology, Wuhan, China
_____________________________________________________________________________________________
ABSTRACT
Performance degradation of packaging material is an important reason for the lifetime reduction of LED. In order to understanding the failure behavior of packaging material, silicone and phosphor were chosen to fabricate LED
samples within which an aging test at 125℃ was performed. The result of online luminance measurement showed
that LED samples with both silicone and phosphor had the highest luminance decay rate among all test samples because the carbonization of silicone and the consequent outgassing reduced the luminance quickly. The result of the luminance variance with test time was analyzed and an exponential decay model was developed with which the lifetime of LED under high temperature could be estimated.
Keywords: LED, Packaging materials, aging test, luminance, lifetime
_____________________________________________________________________________________________
INTRODUCTION
Nowadays, Light emitting diodes (LEDs) are widely used in indoor illumination, outdoor lighting and street lamp. It is well known that LED is an excellent solid-state lighting source with the characters of low power consumption, small package, and environmental friendliness[1-3]. Furthermore, as a typical high reliability electric product, LED often has a lifetime about several years at room temperature[4-6]. However, in order to improve the luminance, the input power of LED is becoming higher and higher and the thermal density is raised greatly. If LEDs work in an environment with inefficient heat dissipation, the temperature of LEDs will increase sharply. In this case, according to the Arrhenius equation, the lifetime of LED will be reduced sharply[7-9]. Although high temperature has omnidirectional adverse effect on LED lifetime, the thermal decay of packaging material is much more prominent than that of other parts along with the increase of temperature[10-12].
As common packaging materials, silicone and phosphor are sensitive to high temperature. They will fail easily and then cause failure of the whole LED under high temperature. In order to understand the failure behavior of packaging materials and increase lifetime of LED, some representative LED samples were used to undertake constant high temperature aging test so that failure process of packaging materials would be accelerated. By the means of measuring the luminance of samples online, time-dependent luminance had been revealed. Based on that, lifetime model of LED samples was built and then reasonable lifetime prediction would be realized.
AGING TEST DESIGN
Failure Criterion: Luminance depression over 30%, flicker and dead-light (completely extinguished) are the three
important failure modes of LED. The sample were regarded as a failed one when any of these three modes was observed.
Test Temperature: Based on PN junction temperature and other performance parameters of LED samples, 125℃
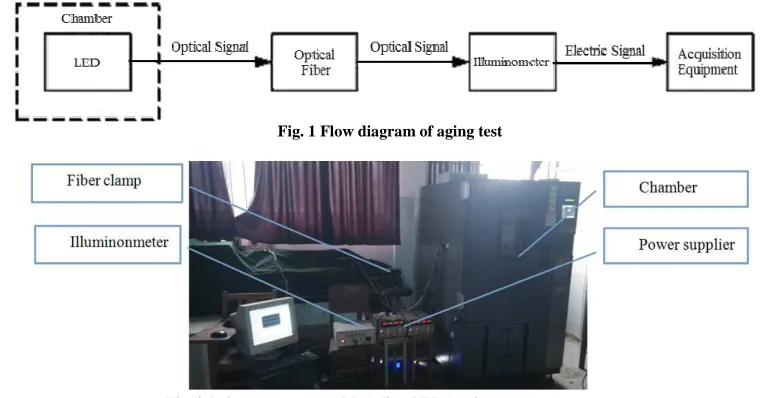
Fig. 1 Flow diagram of aging test
Fig. 2 Aging test system with online LED luminance measurement
Experimental Procedure and Equipments: The flow program of aging test was shown in Fig. 1. The test samples
were put into testing chamber. The optical signals of these samples were transmitted to luminometer by fibers. And a computer was used to collect the measuring data. According to this procedure, the aging test system with LED luminance online measurement was shown in Fig. 2.
The aging test system consisted of acquisition equipment, power equipment and the chamber. Acquisition equipment included digital multichannel luminometer with acquisition software, fibers, resin and plastic fixture. Power equipment was a constant current power supplier which offered 350mA to LED samples. And the temperature cycling chamber kept the temperature at 125℃.
There were four different kinds of experimental samples, which were pure chip sample, silicone sample, phosphor silicone sample, phosphor sample. All the samples were fabricated with the same sapphire substrate and the epoxy cap. However, different from pure chip and silicone samples, phosphor was coated on the LED chip in phosphor silicone and phosphor samples. And that whether silicone filler was used or not was the difference between pure chip and silicone samples.
RESULTS AND DISCUSSION
Appearance Variation: After aging test, every sample was inspected by microscope to compare the appearance
variation of all samples before and after aging test. As shown in Fig. 3, the variation of pure chip sample was not obvious. For silicone sample and phosphor silicone sample, there were bubbles under the epoxy caps. But different from phosphor silicone sample, silicone sample had visible carbonization in the silicone filler. And the deformation of epoxy caps of phosphor sample was very clear.
[image:2.595.113.506.566.752.2]
Fig. 4 The curve of the normalized illumination
Lumination Measurement: In aging test, no flicker or dead-light samples arose. Thus only the luminance reduction was regarded as failure criterion. The average luminance of each kind samples was normalized and drawn in Fig. 4. The luminance of chip sample reduced 8% after 120 hours and the other three kinds of samples reduced over 30%.
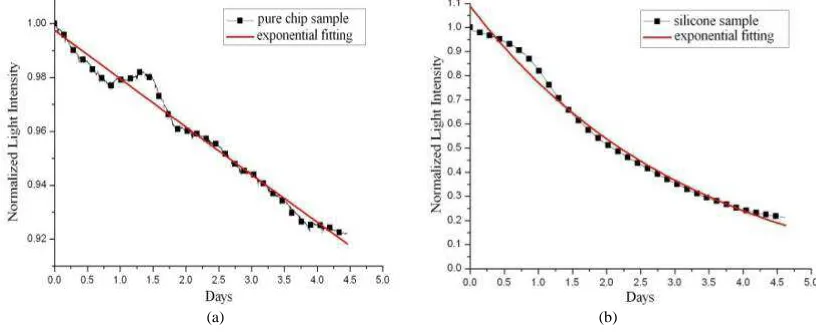
Mathematical Model: Curve fitting of normalized light intensity was shown in Fig. 5. And fitting equations were given:
L
=
0
.
9979
e
−0.0186ta,
R
2=
0
.
98
a (1)
L
=
1
.
1721
e
−0.3759tb,
R
2=
0
.
99
b (2)
L
=
0
.
3436
e
−0.4688tc,
R
2=
0
.
90
c (3)
L
=
0
.
7599
e
−0.0586td,
R
2=
0
.
93
d (4)
The La, Lb, Lc and Ld were normalized light intensity of four kinds of samples. The ta, tb, tc and td were the test time.
R2 was the fitting degree. For all four fitting equations, the value of R2 were close to 1. That was to say, the fitting equations matched the experimental results very well and the exponential distribution could be used to describe luminance reduction of samples.
[image:4.595.94.512.62.238.2]
(c) (d)
Fig. 5 Curve fitting of luminance reduction of samples: (a)pure chip; (b)silicone; (c)phosphor silicone; (d)phosphor
Based on these fitting equations, mathematical model of luminance reduction could be developed.
L
=
α
exp
(
−
β
t
)
(5)The L was luminance. α and β were constants which had relationship with the performance parameters of samples. t was time of aging test.
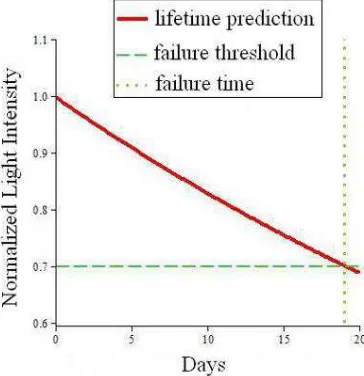
As mentioned above, pure chip samples were not failed. But based on the model of luminance reduction, the lifetime of them could be predicted. As shown in Fig. 6, it would cost about 19 days for the luminance reduction of pure chip sample from 100% to 70%. Therefore the lifetime was about 19 days under the temperature of 125℃.
The Results Analysis: according to the results of on-line luminance measurement, the pure chip sample had a relatively high reliability because the luminance reduction was only 8%. The silicone sample and the phosphor sample both failed at the time of about 36 hours. However, on the one hand, the luminance of silicone sample reduced more slowly than that of phosphor sample before failure. On the other hand, the situation was opposite after failure. As to the phosphor silicone sample, it failed at 12 hours and the luminance would reduced 90% at 120 hours.
[image:4.595.214.396.478.666.2]Based on the analysis of the failure behavior of LEDs in aging test, it was obvious that packaging materials had an important impact on the lifetime. In order to build failure model and predict lifetime, 125℃ was designed as the
constant temperature. Four different kinds of samples were undergone aging test and the result of luminance reduction was acquired by an on-line measurement instrument. The experimental results showed that the pure chip sample had a longest lifetime among these four kinds of samples because the carbonization and bubbles of silicone led to the luminance reduction. The time-dependent data of luminance reduction were analyzed and fitting models were developed which matched with exponential decay very well. By the aid of this model, the lifetime of LEDs could be predicted.
Acknowledgements
This work was funded by National Natural Science Foundation of China (50975106), the Project of Educational Commission of Hubei Province of China (Q20111405), open foundation of State Key Lab of Digital Manufacturing Equipment & Technology(DMETKF2014017) and the State Key Laboratory of Silicate Materials for Architectures (Wuhan University of Technology, No: SYSJJ2013-10).
REFERENCES
[1] L. Liu; D. Yang. In Proceedings of Thermal, Mechanical and Multi-Physics Simulation and Experiments in Microelectronics and Microsystems (EuroSimE), 2011:1-5.
[2] F. M Steranka. Phys. Status Solidi (a), 2002, 194(2):380-388.
[3] X.A.Cao,S.D. Arthur, Appl. Phys. Lett., 2004, 85(18):3971-3973.
[4] S. Bo, K. S. Wee, C. Yuan, F. Xuejun, and Z. Guoqi, In Proceedings of Thermal, Mechanical and Multi-Physics Simulation and Experiments in Microelectronics and Microsystems (EuroSimE), 2013:1-5.
[5] J.S. Wang, C.C. Tsai, J.Si. Liou, W.C. Cheng, S.Y. Huang, G. Chang, and W.H. Cheng, Microelectron.
Reliab.,2012, 52:813-817.
[6] L. Yang, J. Hu, and M.W. Shin, Solid-State Electron., 2009, 53:567-570.
[7] Y.G. Zhou, X.R. Li, X. Ye, G.F. Zhai. In Proceedings of IEEE Conference on Prognostics and System Health Management (PHM), China, 2012: 1-5.
[8] W. Frank, P. S. Martin, and G. Harbers, In Proceedings of SPIE: Solid State Lighting, 2004:1-5.
[9] M. Gong, X. Ma and D. Yang, In Proceedings of Electronic Packaging Technology and High Density Packaging (ICEPT-HDP), 2012:1546-1549.
[10]Z. Chen, Q. Zhang and K.Wang, J. Semicon., 2011, 32(1):53-56.
[11]W. Chi, T. Chou, C. Han, and K. Chiang, In Proceedings of Electronics Packaging Technology Conference, Singapore, 2008: 533-538 (2008).