Journal of Chemical and Pharmaceutical Research, 2014, 6(3):926-930
Research Article
CODEN(USA) : JCPRC5
ISSN : 0975-7384
Research on regression model-based swimmer body shape features
affect performance
Qinglin Hong
Sports Department, Xianyang Normal University, Xianyang, China
_____________________________________________________________________________________________
ABSTRACT
Excellent swimmers’ competition performance is comprehensive reflection by multiple factors effects, body shape features as one of important factors to predict human body maximum movement potential, is an important guarantee for swimmers getting excellent performance. Exploring excellent swimmers body shape special features not only provides scientific guidance for swimmers high level selection, but also plays remote orientation roles in swimmers’ basic selection, it can also makes certain references for swimmers’ special physical training. This paper first through consulting documents, finds out swimming performance correlated each body shape indicator 4 large types that accounts for larger weight, by mathematical statistics method, with China swimmers four body shapes and performance through year 2005, 2009 and 2013 investigation as values basis, use MATLAB fitting, it respectively gets four body shape and swimming performance relationships, then use average method to solve weight algorithm, finally it gets four body shapes and swimming performance whole relations. At last, use swimmer Sun Yang swimming performance and his four body shapes data to make verifying, achieved results basically conform to fact, finally gets the conclusion that the model has feasibility.
Key words: Regression model, body shape, numerical fitting, swimmer
_____________________________________________________________________________________________
INTRODUCTION
Due to athletes’ figures exist regional differences, China athlete figure compares with other areas athlete, it is generally not ideal. In order to shorten final competition performance gap as much as possible, it regards scientific talent selection as swimming circle important topics. Swimmers’ performance is affected by multiple factors; body shape feature is regarded as one of important factors of human body movement potentials, meanwhile is also the guarantee of athletes getting excellent performance. Exploring excellent swimmers’ body shape feature and swimming performance relationships, not only provides theoretical basis for selecting high level swimmers, but also plays crucial roles in swimmers basic talent selection [1-3].
It is clear that in previous research information, no intuitional research on swimming body shapes and swimming performances, here, this research through consulting documents information, it finds out swimmers body shapes four body shapes that of great important on swimming performance influences are height, foot area, span, shank plus foot height. Establish the four body shapes and performance relationships, so that provides better theoretical basis for athletes’ performance.
BODY SHAPE AND PERFORMANCE RELATIONSHIP MATHEMATICAL MODEL Least square method and unary regression model establishment
At first, according to sample values defining equation
yˆ
=
a
+
bx
coefficienta
,
b
. Assume in one experiment, it takesn
pairs of data(
x
i,
y
i)(
i
=
1
,
2
,
n
)
,
then
pairs of data(
x
i,
y
i)
is a sequence of sample values,according to the sequence of sample values, it can look for a pair of coefficient
a
,
b
but due to y is a random variable, by another group of experiments, it can also get a pair ofa
,
b
values [8, 9]. That is to say, what we get from a group of data is coefficienta
,
b
estimation values, recorda
ˆ
,
b
ˆ
solved regression equation by a group of experiment data is:x
b
a
y
ˆ
=
ˆ
+
ˆ
(1)
It is called empirical equation of regression. It is also called empirical formula,
a
ˆ
,
b
ˆ
as empirical regression coefficient.In order to solve
a
,
b
estimation value, we common used methoda
ˆ
,
b
ˆ
is least square method.Assume in one experiment, it gets
n
pairs of number(
x
i,
y
i)
, from whichy
i is random variabley
corresponding
x
i experiment values. Every experiment valuey
i and regression valuey
ˆ
i differencey
i−
y
ˆ
i, itshows as two vertical coordinates differences in figure, the differences have positive value and also negative value,
its absolute value is
y
i−
y
ˆ
i .Obviously, the straight line we look for should be the straight line that lets all thesedistance sums be smallest, that
∑
=−
n i i iy
y
1ˆ
is minimum. But due to absolute value is relative complicated in
handling; replace it with sum of squares
Q
=
Q
( )
a
ˆ
,
b
ˆ
=
(
)
[
(
)
]
21 2 1
ˆ
ˆ
ˆ
∑
∑
= =+
−
=
−
n i i i n i ii
y
y
a
b
x
y
.
The sum of squares
Q
is changing with regression coefficienta
ˆ
,
b
ˆ
change, therefore it is one binary function ofa
ˆ
,
b
ˆ
, from whichx
i,
y
i is constant.According to binary function solving extreme value method, solves partial derivatives and it gets:
( )
[
]
(
)
[
]
+ − − = ∂ ∂ + − − = ∂ ∂∑
∑
= = n i i i i n i i i x x b a y b Q b a y a Q 1 . 1 ˆ ˆ 2 ˆ ˆ ˆ 2 ˆ , Let0
ˆ
,
0
ˆ
∂
=
∂
=
∂
∂
b
Q
a
Q
, It gets:
=
−
−
=
−
−
∑
∑
∑
∑
∑
∑
= = = = = = n i n i n i i i i i n i n i i n i ix
b
x
a
y
x
x
b
a
y
1 1 1
2 1 1 1
0
ˆ
ˆ
0
ˆ
ˆ
______________________________________________________________________________
−
=
−
−
=
∑
∑
∑
∑ ∑
= = = = =x
b
y
a
x
n
x
y
x
n
y
x
b
y
n i n i i i n i n i n i i i i iˆ
ˆ
1
1
ˆ
1 2 1 21 1 1
(2) From which:
∑
==
n i ix
x
1 ,
∑
==
n i iy
n
y
21
Formula (3) or written as:
−
=
−
−
=
∑
∑
= =x
b
y
a
x
n
x
y
x
n
y
x
b
n i i n i i iˆ
ˆ
ˆ
1 2 2 1 (3)In formula
a
ˆ
,
b
ˆ
, that are points ofQ
minimum values, makesQ
=
Q
( )
a
ˆ
,
b
ˆ
=
(
)
∑
= − n i i i y y 1 2 ˆ arrive atminimum.Linear equation with
a
ˆ
,
b
ˆ
as regression coefficient is our required regression equation.It can best represent these points scatter states, due to when solving coefficienta
ˆ
,
b
ˆ
,Q
let sum of squares to be minimum, the method is least square method.Curve goodness of fit testing
The merits of curve fitting can be measured by errors sum of squares. Assume that actual tested value is
Y
, its average value isY
1, according to fit curve solved theoretical value isY
2, and then it can get its error sum ofsquare
(
)
2 2
∑
Y
−
Y
, mean variance is
(
)
2 1
∑
Y
−
Y
, if error sum of squares and mean variance ratios be smaller, then it indicates that actual observation value and estimation value get more closer, curve fitting be better. Therefore,
it can define correlation coefficient
R
2, its computation formula is:(
)
(
)
2 1 2 2 2 1∑
∑
− − − = Y Y Y Y RBODY FEATURE AND PERFORMANCE RELATIONSHIP MODEL SOLUTION
[image:3.595.70.536.63.403.2]At first through consulting document information, it finds out swimming performance related each body shape indicator larger weight four types, by mathematical statistics method, with China swimmers four body shapes and performance through year 2005, 2009 and 2013 investigation as values basis, refer to Table 1.
Table 1: Body shape feature value
Year Height\cm Foot area\cm2cm Span\cm Shank plus foot height\cm Average performance Year 05 172.26 236.76 179.24 42.38 3’59’’29 Year 09 181.17 257.67 190.41 46.74 3’49’’11 Year 13 184.62 252.63 193.83 48.86 3’47’32
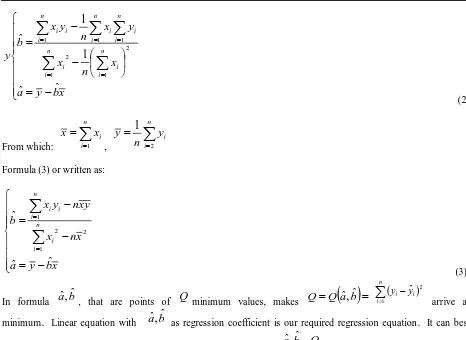
Table 2:
R
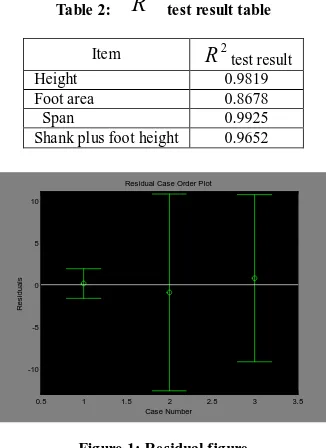
2 test result table Item R2test result Height 0.9819 Foot area 0.8678 Span 0.9925 Shank plus foot height 0.96520.5 1 1.5 2 2.5 3 3.5
-10 -5 0 5 10
Residual Case Order Plot
R
es
idual
s
Case Number
Figure 1: Residual figure
[image:4.595.224.387.79.303.2]Through Table 2 and Figure 1 result, it indicates that Table 3 all regression model expressions are at work.
Table 3: Body shape feature indicators and swimming performance relations expression
Body shape feature
m
b
ExpressionHeight 406.3528 -0.9789 y1 =406.3528x1-0.9789
Foot area
614.1536 -1.5745 y2 =614.1536x2-1.5745
Span 460.8610 -1.1773 y3 =460.8610x3-1.1773
Shank plus foot height 162.5832 -0.5027 y4=162.5832x4-0.5027 Note:
i
x
Four main test items values;
i
y
Four main test items corresponding competition performance;
i
m
x
i andy
i linear relations coefficient; ia
Four main test items weight in entirety;
Solve weight with average method,
∑
=
i i i
m
m
a
Handle with coefficient in expression of Table 3 each body shape feature value and swimming performance, it can
get ai =0.2472,0.3736,0.2803,0.0989 i=1,2,3,4
That is getting performance
y
expression:y=0.2472x1+0.3736x2+0.2803x3+0.0989x4EMPIRICAL RESEARCHES
To verify that achieved expression has reliability, use swimmer Sun Yang four body shape feature values and Olympic Games performance in 2012 as data, carry out verifying with final got expression:
______________________________________________________________________________
Therefore, this paper carries out verifying and estimation with Sun Yang as an example, Sun Yang body correlation data as Table 4 shows.
Table 4: Sun Yang body data information
Item Data Height\cm 198 Foot area\cm2 280 Span\cm 211 Shank plus foot height\cm 56
Input Table 4 correlation data correspondingly into height
(
x
1)
, foot area(
x
2)
, span(
x
3)
, shank plus footheight
(
x
4)
and the item predicted performance(
y
)
relations:y=0.2472x1+0.3736x2+0.2803x3 +0.0989x4It gets through calculationy=218.235
Through model prediction performance and actual performance comparing as Table 5:
Table 5: Predicted performance and actual performance comparative table
\ Best result by
prediction Actual best result 400 meters free stroke performance 3Minutes38second
s24
3Minutes40secon ds 14 Relative error 0.86%
The model is mainly established with China swimmers as research objects, the research can apply into national team swimmers selection and excellent swimmers best results prediction, so that it has better basis for planning more perfect training, diet and to other schemes.
CONCLUSION
Through fitting, it got each feature indicator and average performance relationships, used average method solving weights, it got each factor weight on average performance, which could get performance
y
expression, after that utilized master swimmer Sun Yang empirical verification such expression, the result was basically conforming to actual that indicated the modeling process was at work and reliable. The top advantage in the paper lied in its bold calculation and guess, exploring for problems without previous researching that started the trend.There are promotion existing on research results, it mainly four body shape feature indicators from them is defined according to previous investigation China swimmers physical qualities feature data, only represents China athletes physiques, it can collect some foreign athletes’ body shape feature values, expanding the research to international level, which produces effective promotion for improving international swimmers’ performance.
Acknowledgment
Scientific research project in Shaanxi province department of education: (2013 jk0524)
REFERENCES
[1] ZHANG Ming-fei, CHEN Yan, ZHANG Yi-hua. China Sport Science and Technology, 2006, 42(5):85-88. [2] SUN Bing, XU Hongqi. Journal of Tianjin Institute of Physical Education, 2008, 23(5):433-436.
[3] Li Yi-yu, Yang Fang and He Jiang-chuan. Neural Regeneration Research, 2009, 13(37):7381-7384. [4] Tang Qingwen, Chen Li. Sichuan Journal of Anatomy, 1997, 5(2):93-96.
[5] JI Gang. Journal of Guangzhou Physical Education Institute, 2009, 29(4). [6] LUO Zhi. Journal of Chengdu Physical Education Institute, 2005, 31(5):93-97.