Journal of Chemical and Pharmaceutical Research, 2014, 6(4):1-5
Research Article
CODEN(USA) : JCPRC5
ISSN : 0975-7384
Study of normalization method of isotopic compositions to
isotope reference scales
Li Ke, Zhang Lin
*and Zhao Guoxing
Institute of Hydrogeology and Environmental Geology (IHEG), CAGS, Zhengding, Hebei, P.R. China
____________________________________________________________________________________________
ABSTRACT
In stable isotope ratio mass spectrometry (IRMS), the stable isotopic composition of samples is measured relative to the isotopic composition of a working gas. This measured isotopic composition must be converted and reported on the respective international stable isotope reference scale for the accurate interlaboratory comparison of results. This data conversion procedure, commonly called normalization. In this paper, we present a discussion and mathematical formulation of several existing routinely used normalization procedures. By utilizing laboratory analytical data, the accuracy of the various normalization methods (given by the difference between the true and the normalized isotopic composition) has been compared. Our computations suggest that single-point anchoring produces normalization errors, that it must not be used for routinely anchoring stable isotope measurement results to the appropriate international scales. Using two or more certified reference standards produces a smaller normalization error provided that the isotopic composition of the standards brackets the isotopic composition of unknown samples.
Keywords: stable isotope; composition; normalization
____________________________________________________________________________________________
INTRODUCTION
Usually, we don’t measure the ratio R of stable isotope in gas isotope mass spectrometry directly. In the other way, we measure the relative difference δ of the isotope ratio of the sample Rspl and the isotope ratio of the standard Rstd.
δ(Spl) is defined as the permillage of isotope ratio in the isotope ratio of the standard, i.e. δ(Spl)=(Rspl/Rstd)×103‰.
In order to unify the comparability of the analysis data of samples, International Atomic Energy Agency puts V-SMOW (Vienna Standard Mean Ocean Water, δD and δ18O are defined as zero) as the international standard of δD and δ18
O. They put VPDB as the standard of δ13C at the same time.
There are some calculation rules which should be applied in stable isotope analysis by which we could calibrate original isotopic data and then acquire standard isotopic data based on international standards. These calibration methods are: 1) Single point calibration relative to reference gas; 2) Single reference material calibration; 3) Optimized Single reference material calibration; 4) Calibration with two or three kinds of reference material; 5) Multi-reference materials linear regression calibration. Therefore, we could get correct explanation of isotopic analysis data only by objective measurement error calculation and appropriate data processing [1].
correction value by analyzing a series of known standard sample of oxygen isotope (δ18O) by various calibration calculation methods. After that we discussed the precision of data by calibration methods.
EXPERIMENTAL SECTION
Calibration Method
Original isotopic data is calibrated into that based on international standard by different labs through standard process as follows: 1) Single-point calibration, reference gas with known true value; 2) Single-point calibration by standard material with known certified value; 3) Double- point calibration, two kinds of reference materials with known values. (For example: hydrogen and oxygen isotope according to international standards VSMOW & SLAP, carbon isotope according to international standards NBS18 and NBS19); 4) Multi-point standardization, linearity calibration based on more than two identified standards. From here, we are going to explain each method in details.
1.1 The CALIBRATION METHOD WITH KNOWN TRUE VALUE OF REFERENCE GAS
The method has been used for decades and requires the reference gas value relative to the international standard (VSMOW or VPDB). The value of δ of the sample to be measured is converted into isotope value relative to the international standard by the introduction of reference gas measurement [6, 7].
From the formula δ(Spl)=
1
R
R
Std Spl
×103‰ (1)
We could get the calculation formula of the sample relative to reference gas with known true value. δM
Spl= [(RSpl/RWG)-1]×103
RSpl=RWG×[(δM
Spl+1000)/1000] (2)
δT
WG=[(RWG/RInt)-1]×103
RInt=RWG×[1000/(δT
WG+1000)] (3)
δT
Spl=[(RSpl/RInt)-1] ×103 (4)
And put the value of RSpl and RInt in formula (2) and (3) into formula (4), and then we’ll get the formula as follows:
δT Spl=δ
M Spl+δ
T WG+
1000
T WG M Spl
(5)
Formula (5) is used to calculate isotope values of δ relative to international standards. It’s also used in mass
spectrometer software tools( MAT 253 Isodat NT 2.0 ). δMSplis the value of sample relative to reference gas. We
could get the true value of unknown sample if setting the true value of δTWG in the program. The value of sample
relative to reference gas δM
Spl could be calculated based on formula (5) if we set the value of reference gas as zero.
The disadvantage is: the true value of working gas is set to be constant during a certain period, but isotopic composition of reference gas in cylinders may change because of isotopic fractionation.
This phenomenon is quite common in elements with lower mass. For instance, the mass of 2H is twice as much as that of 1H. 1H with light component fractionates while time passes by. So there are thicker 2H with heaver component and isotope ratio in cylinder change. Isotope ratio may change when vapor phase and liquid phase of reference gas in cylinder coexist. Grootes et al [8]described isotopic fractionation of coexisting vapor phase and liquid phase CO2 in cylinder quantitatively. Therefore, the isotopic composition true value of reference gas should be
set based on frequent and regular measurement of stable standard material. The calculation rule of formula (5) has
only reference point, so formula (5) will become larger by deviation of (δT Spl-δ
T
WG),the deviation ofδ T Spl-δ
Norm Spl is
also increased. δTSplshould be close to δWGT in order to get precise result. Therefore, this calculation process does
not fit for continuous flow measurement system. It could be applied only when δT
_____________________________________________________________________________
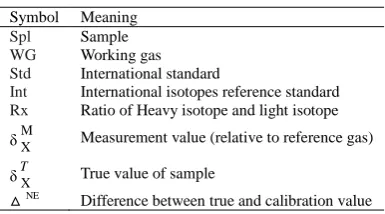
Table 1. Explanation of notations used in the text
Symbol Meaning
Spl Sample
WG Working gas
Std International standard
Int International isotopes reference standard
Rx Ratio of Heavy isotope and light isotope δMX Measurement value (relative to reference gas)
δTX True value of sample
△NE
Difference between true and calibration value
1.2 THE CALIBRATION METHOD WITH SINGLE STANDARD MATERIAL
In this method, an identified reference standard and sample will be analyzed, pretreated and measured in the same way. Standard and sample isotope will be measured by the same reference gas [9]. We use each original value to calculate the true value of isotopic composition. The mathematical formula for calibration result is listed as follows:
RSpl/RWG=[(δ
M
Spl+1000)/1000] (6)
Similarly, the following formulas can be derived:
RStd/RWG=[(δ
M
Std+1000)/1000] (7)
RStd/RInt=[(δ
T
Std+1000)/1000] (8)
Formula (7) divided by formula (6), we can get
RSpl/RStd=(δ
M
Spl+1000)/ (δ M
Std+1000) (9)
Formula (8) multiplied by formula (9), we can get
RSpl/RInt=
1000
1000
M Std M Spl
×1000
1000
T Std
(10)Putting the formula (10) into formula (4), we can get
δT Spl=
)
1000
(
)
1000
)(
1000
(
M Std T Std M Spl
-1000 (11)
Similar to formula (5) in the said section, formula (11) may lead us to large deviation when the difference between the sample and standard is considerable.
1.3 OPTIMIZED SINGLE REFERENCE MATERIAL CALIBRATION
This kind of optimized standardization applied formula (11) in which two identified standard values and an unknown sample are analyzed. In the formula, calibration factor ‘n’ is used to calculate the true value of the sample,see the formula:
δTSpl=
)
1000
(
)
1000
)(
1000
(
M Std T Std M Spln
n
-1000 (12)
The calibration factor ‘n’ is calculated with two true values of reference standards (std1 and std2). The true value of std2 could be estimated by formula (13) supposing that std2 is unknown.
δT
Std2=
)
1000
(
)
1000
)(
1000
(
1 1 2 M Std T Std M Stdn
n
-1000 (13)
n=
1000 1000
1 2 2 T Std1 2 1
2 1
M Std T Std M
Std M
Std M Std
T Std T Std
(14)
The advantage of this method is that the value of factor ‘n’ in mass spectrometer can remain and be constant in a certain period. For example, we should analyze two reference standards when determining the value of ‘n’ by dual-inlet. After that, only one reference standard is needed to measure the unknown sample but not two which have been identified each time. In other word, we may acquire the true value of the unknown sample by data in formula (12). However, we should calculate the value of `n` periodically to ensure that mass spectrometer condition is stable. It should be recalculated if sensitivity of mass spectrometer changes. For continuous flow IRMS, peripheral equipment condition of sample may change even mass spectrometer condition is constant. These parameters include the carrier gas flow, redox conditions and the reaction temperature.
As a result, two known standards are needed to calculate the value of ‘n’ in every test within continuous flow system. The optimized single point calibration method has the same identity as linear calibrations with two kinds of standards to be described below in case that the two reference standards are calculated every time. The optimized single point calibration method does not require that isotopic composition of samples is close to the identified isotopic standards. This is the difference between the single point calibration method in formula (5) and formula (11) respectively.
1.4 LINER CALIBRATION WITH TWO KINDS OF STANDARD MATERIALS
This method is to use the true value and measurement value of two identified reference standards to conduct linear regression. And it has been used for decades in which the measurement values of δD and δ18O of water sample are converted based on VSMOW and δ13C is calibrated referred by VPDB.
The system error of isotope mass spectrum is linear in this calibration method. The two reference points include the measurement value (y axis) and true value(x axis) of the two standards. The true value of the sample could be calculated in geometric way.
Figure 1. Illustration of derivation for two-point normalization
slope(m)=tan
= MStd M Spl
T Std T
Spl
2 2
= M
Std M
Std T Std T
Std
2 1
2 1
(16)
From formula (16), we can get:
δTSpl= M Std M
Std T Std T
Std
2 1
2 1
×(δMSpl-δ M Std2)+δ
T
Std2 (17)
_____________________________________________________________________________
large amount of calculation before.
1.5 MULTI-POINT LINEAR CALIBRATION
This kind of method is similar to linear calibration with two kinds of standard materials. The difference is that we need more than two points in linear calibration. Linear equations contain the factor of system error of isotope mass spectrometer already, so the calibration method considering two standard points is more accurate than that containing single standard point. But there will still be deviation in linear calibration curve if single point measurement error exists in calibration with two kinds of standard materials.
For instance, incomplete burning of the sample leads to accidental error in the measurement process by elemental analyzer. But in two-point calibration curve, the value of R2 is still 1 even there is something wrong with data. As a result, there will be data deviation if we calibrate the value of sample by this curve. Furthermore, the deviation could be larger when the value of unknown sample is close to the standard value of accidental error. Calibration with more than two standards could avoid this kind of deviation by showing R2<1 if there is accidental error. The analyzer will find out the reasons of deviation. So the calibration with more than two standards is applied in continuous flow test such as EA and GASBENCH [11] in the isotope measurements.
CONCLUSION
Single point calibration leads to relatively large deviation from the true value, and affects the precision of isotopic data analysis. During the process of single point calibration, error caused by calibration is larger than that of total analyzing (uncertainty of oxygen isotope analysis is 0.2‰) in case that the isotopic composition of unknown sample differs a lot from that of reference gas. The value of reference gas changes with time, temperature and humidity, so the true value of reference gas should be calibrated by working standard, and the isotope values of unknown samples should be calibrated by the value of reference gas.
Linear calibration with two kinds of standard material and optimized single reference material calibration are more precise than calibration method with single standard material because of smaller deviation. The bigger the difference between two standards, the wider the scale of linear calibration is. And there will be smaller calibration data deviation of samples. δ18OT will be more close to δ18ONorm too. The value of the unknown samples should be within the linear scale of the two standards during the test, so we’d better choose two standards with difference as big as it can be. The third standard point in multi-point linear calibration helps us getting rid of the effect of accidental error when measuring any standard value. In this way, we may avoid deviation of calibration curve, it is more dependable.
Acknowledgements
This work was financially supported by the China Geological Survey Funds,No.12120113022500 and Fundamental Research Funds for the IHEG, No.SK201101.
REFERENCES
[1] Han Youke, Rock and Mineral Analysis,2002,7,65-70.
[2] Coplen, T.Chemical Geology (Isotope Geosciences Section), 1998,72, 293-297. [3] Coplen, T. Geochimica et Cosmochimica Acta,1996,60, 3359-3360.
[4] Coplen, T.B. Pure and Applied Chemistry, 1994, 66, 273-276.
[5] Coplen TB, Brand WA, Gehre M, et al. Anal Chem, 2006,78, 2439-2441.
[6] Sharp Z. Principles of Stable Isotope Geochemistry. Pearson Prentice Hall: New Jersey, 2007.
[7] Craig H. Geochim. Cosmochim. Acta,1957,12,133-149.
[8] Grootes PM, Mook WG, Vogel JC, et al. A Hadrons and Nuclei,1969,221-257.
[9] Werner RA, Rothe M, Brand WA. Rapid Commun Mass Spectrom,2001,15,501-519.
[10] Available: http://water.usgs.gov/software/lims.html