A Study of the Yesilirmak River Catchment in
Northern Turkey: Spatial Patterns and
Temporal Trends in Water Quality
Li Jin1*, Paul Whitehead2, Michalis Hadjikakou2,3
1Department of Geology, State University of New York College at Cortland, Cortland, USA; 2School of Geography and the
Envi-ronment, University of Oxford, Oxford, UK; 3Centre for Environmental Strategy, University of Surrey, Guildford, UK.
Email: *li.jin@cortland.edu
Received May 15th, 2013; revised June 27th, 2013; accepted July 5th, 2013
Copyright © 2013 Li Jin et al. This is an open access article distributed under the Creative Commons Attribution License, which permits unrestricted use, distribution, and reproduction in any medium, provided the original work is properly cited.
ABSTRACT
This paper presents a comprehensive study of spatial and temporal patterns of water chemistry (1995-2008) in the Ye-silirmak River catchment in Northern Turkey. Biological oxygen demand (BOD), dissolved oxygen (DO) and nutrient concentrations (nitrogen and phosphorus) are variable across the catchment because the upland areas are relatively un-disturbed, and the lower catchment is dominated by urban, industrial and agricultural inputs. Seasonally, high nutrient concentrations occur in winter possibly due to flushing from the soil zone. Low summer flow and reduced dilution lead to high orthophosphate concentrations. However, denitrification seems to be more significant than dilution processes and this generates low nitrate concentrations in summer. Nutrient levels since 1995 do not show a significant upward trend. The current water quality status indicates that the river system is in poor condition. The majority of sites fall in the Turkish water classification class II-III and more than half fail the EU standards because of high nutrient concentra-tions. In order to improve the status of water quality to achieve good chemical and ecological status, there is clearly a need to improve pollution control within the river system by installing waste water treatment plants, while keeping the agricultural pollution to a minimum in the system.
Keywords: Nutrients; Nitrate; Orthophosphate; Agriculture; Wastewater; Waste Water Treatment Plants
1. Introduction
Fresh water in large river systems is an essential natural resource, providing drinking water, irrigation water for agriculture and power from hydroelectric power stations. However, water quality in many large river waters has deteriorated significantly worldwide due to anthropo- genic activities in the past two-three decades [1]. Pollu- tion entering the rivers from agricultural runoff has caused significant increases in nutrient concentrations such as nitrogen (N) and phosphorus (P) [2-4]. It is also widely accepted that wastewaters from treatment plants supply significant amounts of P to rivers, particularly in populated urban areas [5,6]. Nutrient enrichment can result in excessive growth of aquatic plants, algae pro- ductivity and reductions in dissolved oxygen in rivers [7,8].
A new human induced environmental change affecting fresh water systems is from climate change, which may have significant impacts on the water cycle and water quality [9-13]. The projected future increasing tempera- tures and decreasing flows in summer are the main con- cerns in the UK and Europe [14,15]. This is because in- tensive water resource use is often constrained by the lack of natural low flow, and low flow rivers are more affected by effluent discharges from cities, industries, and agriculture. For example, effluent from sewage treat- ment works can contribute significant inputs of nutrients to lowland rivers in the UK and nutrient concentrations are high during the summer low flow months, when dilu- tion is at its lowest and biological activity is at its highest [16-18].
of factors. According to recent reports of the OECD (Or- ganization for Economic Co-operation and Development), Turkey presents one of the strongest economic growth rates with around 7.5% of yearly average growth since 2002 as well as one of the fastest growing populations among OECD countries in recent years [19]. Although agricultural intensity is still fairly low, pressures from agriculture on the environment are rising as production along with irrigated land area are increasing steadily [20]. These characteristics make Turkey a country where, similarly to other rapidly developing economies such as Brazil [21] and China [22], the nutrient cycle is increas- ingly controlled by human activities as opposed to natu- ral processes. Furthermore, Turkey is situated in the Eastern Mediterranean, an area where according to the latest IPCC report, annual mean temperatures are likely to increase more than the global mean and annual pre- cipitation is very likely to decrease [23]. A recent model- ling study in the area [24] showed that under combined climate change and other environmental changes, such as land use change, in-stream nitrogen concentrations in Yesilirmak River are likely to increase significantly in future years. Solutions to these problems could come from the fact that Turkey is a candidate country for the EU. Candidate countries must complete the necessary procedures for the implementation of the EU Water Framework Directive (WFD), which Turkey plans to meet by 2025. The aims of the WFD of the EU are to improve surface, coastal, transitional and groundwater quality to a “good ecological and chemical status” across Europe [25]. The focus on maintaining good water qual- ity in water bodies gives Turkey the unique opportunity to ensure that the quality of its waters will not be se- verely affected by land use changes and climate change [26]. Turkey is still engaged in its “hydraulic mission” characterized by intensive dam and irrigation canal con- structions [27] because water resource management is still at an early stage. The WFD is also likely to bring monetary support for improving the country’s water in- frastructure and pollution prevention measures [28]. The EU could, therefore, provide added support and motiva- tion to finance and construct waste water treatment plants (WWTWs), control fertilizer application and to adapt to climate change, in order to ensure that problems of nu- trient pollution in aquatic systems like those experienced in the developed world are prevented.
The study by Hadjikakou et al. showed the importance
of nutrient loading to the Black Sea. It also suggested that climate change and land use change in future years will make the pollution worse with increases in nutrient loading [24]. In order to reverse the negative trends due to pollution from large catchment areas from countries around the Black Sea, including the Yesilirmak, it is so crucial to understand the current state of the water quality
and sources of pollution in the Yesilirmak River basin. This paper presents the first comprehensive analysis of water quality data including major dissolved solutes, nutrients, BOD and DO in the Yesilirmak River basin and identifies spatial and temporal patterns in water quality from 1995 to 2008. It provides some insight into the pat- terns and broad scale controls on river water chemistry in the Yesilirmak catchment. Our specific objectives are 1) to understand the major sources for general water quality determinands and nutrients in the catchment; 2) to assess the overall state of water quality for the basin and ex- plore its implications.
2. Study Area and Methods
2.1. Study Area
The Yesilirmak River catchment is one of the twenty-six major basins in Turkey [29]. It is located in Northern Turkey and bounded by 39˚30′ and 41˚21′N, and 34˚40′
and 39˚48′E (Figure1(a)). The catchment is 38,730 km2 which covers approximately 5% of Turkey’s total area and is the third largest basin in Turkey [29]. The land falls from an altitude of 3000 m in the mountainous areas of the catchment to sea level (Figure1(b)). The Yesilir- mak River is approximately 519 km in length and flows through several major cities such as Tokat, Turhul, Ama- sya and Çarsamba, before discharging into the Black Sea (Figure1(b)). The headwaters of the river and most of its tributaries originate in the mountains that form eastern and southern boundaries of the basin. The major tributar- ies to the Yesilirmak River are Kelkit river, Cekeret river (including Çorumriver) and Tersakan river (Figure1(b)). The Kelkit river is the largest tributary and flows in the west direction and is mostly parallel to the Yesilirmak River. The annual streamflow varies with low flow be- tween July and February and high flow between March and May as a result of seasonal rainfall, snowmelt and runoff [29]. The waters in the river system provide many ecosystem functions including public drinking water supply, industrial water supply, irrigation water for agri- culture, cultural and sporting activities such as swimming and fishing and conservation value for wildlife habitats, fisheries and biodiversity.
Figure 1. Maps of (a) The Yesilirmak River catchment in Northern Turkey; (b) The Yesilirmak River catchment including tributaries Kelkit, Cekeret, Çorum and Tersakan rivers and major cities (population exceeds 50,000) shown in red asterisks; (c) The water quality monitoring sites within the Yesilirmak River catchment shown in black and green circles (see Appendix I for the longitude and latitude); green circles indicate selected stations on the main river (Y1-Y5).
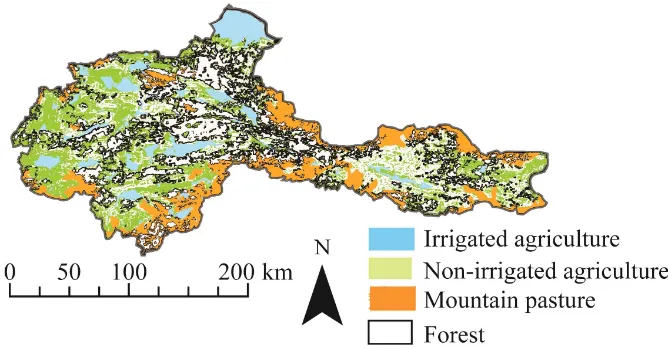
Figure 2. Major land uses in the Yesilirmak River catchment.
extensively faulted and folded due to the fault line locat- ed south of the river. In the basin, the bedrocks are most- ly sandstones, claystones, andesite, volcanic bressica and tuff [29].
Population in the catchment was 3 million in the 2000 census with a population density of 83 per km2 [30], which was slightly below the national average. Most in-
[image:3.595.130.464.450.624.2]turbidity [31], due to an intensified use of fertilizers and the fact that only 5% of the wastewater discharged into the river are treated [32]. Pollution from the river is po- tentially of concern to the whole of the Black Sea region [30], which is very sensitive to eutrophication [33].
The Yesilirmak River basin is located in a subtropical, semi-arid climate with extremes in temperature and rain- fall that shows great spatial and temporal heterogeneity [34]. Average recorded temperature and precipitation in Amasya for 1967-1999 were 13.7˚C and 397 mm, re- spectively. The local climate regime in the area is char- acterized by the transition from the climate of the Middle Black Sea Region to that of Central Anatolia [35].
2.2. Chemistry Data and Analysis
The catchment has been monitored for flow and water quality at over 60 monitoring stations for 30 determi- nands (Data source: DSI, State Hydraulic Works). Since 1995, samples at 33 sites have been collected regularly in January, April, July and October. Thus in our study, we used data from 1995 to 2008 (except for 1999—no sam- ples were collected) at these 33 sites (Figure 1(c) and Appendix I). Water quality determinands presented in this paper are dissolved oxygen (DO), biological oxygen demand (BOD), ammonium (NH4-N), nitrite (
2 NO-N), nitrate ( -N), orthophosphate (o- ) as well as major dissolved ions, such as calcium (Ca2+), magnesium (Mg2+), sodium (Na+) sulphate ( ), chloride (Cl−) and bicarbonate ( )/hardness.
3
NO 3
4 PO 3 4 SO 3 HCO
For spatial data analysis, average water chemistry was calculated from 1995 to 2008 data and mapped using ArcGIS 9.2. For temporal data assessment, time-series of chemical determinands and trend analyses were used to determine whether the concentrations have consistently increased or decreased during a particular time period. Moreover, average quarterly data from 1995 to 2008 were calculated in order to reveal seasonality.
Time series data are evaluated at five key monitoring stations on the Yesilirmak River, which cover upper, middle and base of the catchment. The uppermost water quality monitoring station selected is TokatÇikisi (Y1 in Figure1(c)), close to city of Tokat. The second key sta- tion (Y2 in Figure1(c)) is Sütlüce, close to city of Tur-hul. The third (Y3 in Figure 1(c)) is Durucasu, down-stream of city of Amasya. The fourth (Y4 in Figure 1(c)) is SuatUgurluBarajÇikisi, at the outlet of the SuatUgur-luBaraj lake. And the fifth (Y5 in Figure 1(c)) is Çar-sambaÇikisi, which is close to the river mouth and dis-charges to the Black Sea. Between Y2 and Y3, two tributaries, Cekeret (including Çorum) and Tersakanriv-ers, discharge into the main Yesilirmak River (Figures 1(b) and (c)). The largest tributary of the Yesilirmak
River, Kelkit river, enters the main stream between Y3 and Y4 (Figures1(b) and (c)). The trend analyses were performed for selected key determinands including BOD, nutrients (N and P) using standard statistical analysis software SPSS at these five locations along the Yesilir-mak River. When the trend is statistically significant (p < 0.05), the direction is given as upward and downward.
2.3. Water Classification
The Turkish water classification system provides the main method of pollution control in Turkey and this is important from an EU perspective. Turkey is an EU ac- cession country in that Turkey hopes to join the EU at some time in the future. One EU requirement is that the rivers in Turkey meet the EU Water Framework Directive in terms of water quality and ecology. In this paper we address this issue by comparing the water quality against both set of standards—the Turkish Water Classification system (Turkish Water Pollution Control Regulation— WPCR [36] and the EU Water Framework Directive (WFD) criteria
(http://ec.europa.eu/environment/water/water-framework/). In the case of the Turkish Legislation, the classifica-tion of in-land surface waters with respect to their quality are given below as four classes, namely: Class I: High quality water; Class II: Slightly polluted water; Class III: Polluted water; Class IV: Highly polluted water. Four water quality classes indicated above are considered for different water need. For example, to provide drinking water, class I water only required disinfection, while class II water requires advanced purification [36]. Ap-pendix II summarizes the physical, organic and inorganic chemical standards for the Turkish classification system for the four classes and the EU WFD standards. In order to undertake a classification, the average water quality for each relevant parameter has been determined at each sampling site along the river using the data from 2004- 2008 to reflect the most recent water quality status. Data has then been compared to the four classes and an overall class has been given to each site and mapped using Ar-cGIS 9.2. Two categories of “pass” and “fail” were given when assessing water quality based on the EU standards. The results were then mapped using ArcGIS 9.2.
3. Results and Discussion
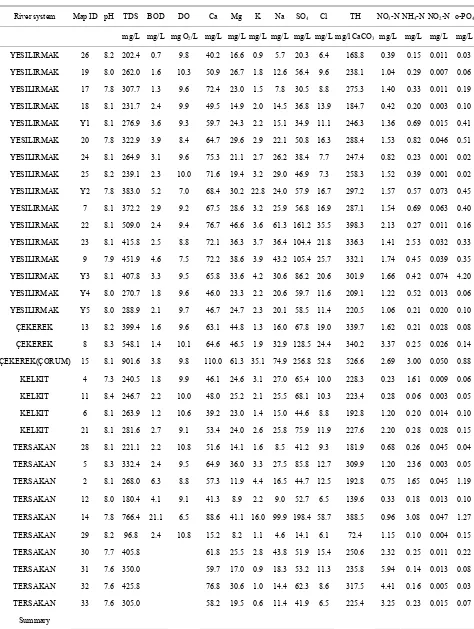
3.1. Summary of Average Water Chemistry Average pH, TDS and major dissolved element contents of waters of 33 sites from 1995 to 2008 are summarized in Table 1. A minimum of three years data are utilized to calculate average values for each site.
Table 1. Summary of average pH, TDS and major element contents of waters from 1995-2008 for each monitoring sites (TDS: total dissolved solid; TH: total hardness).
River system Map ID pH TDS BOD DO Ca Mg K Na SO4 Cl TH NO3-N NH4-N NO2-N o-PO4
mg/L mg/L mg O2/L mg/L mg/L mg/L mg/L mg/L mg/L mg/l CaCO3 mg/L mg/L mg/L mg/L
YESILIRMAK 26 8.2 202.4 0.7 9.8 40.2 16.6 0.9 5.7 20.3 6.4 168.8 0.39 0.15 0.011 0.03
YESILIRMAK 19 8.0 262.0 1.6 10.3 50.9 26.7 1.8 12.6 56.4 9.6 238.1 1.04 0.29 0.007 0.06
YESILIRMAK 17 7.8 307.7 1.3 9.6 72.4 23.0 1.5 7.8 30.5 8.8 275.3 1.40 0.33 0.011 0.19
YESILIRMAK 18 8.1 231.7 2.4 9.9 49.5 14.9 2.0 14.5 36.8 13.9 184.7 0.42 0.20 0.003 0.10
YESILIRMAK Y1 8.1 276.9 3.6 9.3 59.7 24.3 2.2 15.1 34.9 11.1 246.3 1.36 0.69 0.015 0.41
YESILIRMAK 20 7.8 322.9 3.9 8.4 64.7 29.6 2.9 22.1 50.8 16.3 288.4 1.53 0.82 0.046 0.51
YESILIRMAK 24 8.1 264.9 3.1 9.6 75.3 21.1 2.7 26.2 38.4 7.7 247.4 0.82 0.23 0.001 0.02
YESILIRMAK 25 8.2 239.1 2.3 10.0 71.6 19.4 3.2 29.0 46.9 7.3 258.3 1.52 0.39 0.001 0.02
YESILIRMAK Y2 7.8 383.0 5.2 7.0 68.4 30.2 22.8 24.0 57.9 16.7 297.2 1.57 0.57 0.073 0.45
YESILIRMAK 7 8.1 372.2 2.9 9.2 67.5 28.6 3.2 25.9 56.8 16.9 287.1 1.54 0.69 0.063 0.40
YESILIRMAK 22 8.1 509.0 2.4 9.4 76.7 46.6 3.6 61.3 161.2 35.5 398.3 2.13 0.27 0.011 0.16
YESILIRMAK 23 8.1 415.8 2.5 8.8 72.1 36.3 3.7 36.4 104.4 21.8 336.3 1.41 2.53 0.032 0.33
YESILIRMAK 9 7.9 451.9 4.6 7.5 72.2 38.6 3.9 43.2 105.4 25.7 332.1 1.74 0.45 0.039 0.35
YESILIRMAK Y3 8.1 407.8 3.3 9.5 65.8 33.6 4.2 30.6 86.2 20.6 301.9 1.66 0.42 0.074 4.20
YESILIRMAK Y4 8.0 270.7 1.8 9.6 46.0 23.3 2.2 20.6 59.7 11.6 209.1 1.22 0.52 0.013 0.06
YESILIRMAK Y5 8.0 288.9 2.1 9.7 46.7 24.7 2.3 20.1 58.5 11.4 220.5 1.06 0.21 0.020 0.10
ÇEKEREK 13 8.2 399.4 1.6 9.6 63.1 44.8 1.3 16.0 67.8 19.0 339.7 1.62 0.21 0.028 0.08
ÇEKEREK 8 8.3 548.1 1.4 10.1 64.6 46.5 1.9 32.9 128.5 24.4 340.2 3.37 0.25 0.026 0.14
ÇEKEREK(ÇORUM) 15 8.1 901.6 3.8 9.8 110.0 61.3 35.1 74.9 256.8 52.8 526.6 2.69 3.00 0.050 0.88
KELKIT 4 7.3 240.5 1.8 9.9 46.1 24.6 3.1 27.0 65.4 10.0 228.3 0.23 1.61 0.009 0.06
KELKIT 11 8.4 246.7 2.2 10.0 48.0 25.2 2.1 25.5 68.1 10.3 223.4 0.28 0.06 0.003 0.05
KELKIT 6 8.1 263.9 1.2 10.6 39.2 23.0 1.4 15.0 44.6 8.8 192.8 1.20 0.20 0.014 0.10
KELKIT 21 8.1 281.6 2.7 9.1 53.4 24.0 2.6 25.8 75.9 11.9 227.6 2.20 0.28 0.028 0.15
TERSAKAN 28 8.1 221.1 2.2 10.8 51.6 14.1 1.6 8.5 41.2 9.3 181.9 0.68 0.26 0.045 0.04
TERSAKAN 5 8.3 332.4 2.4 9.5 64.9 36.0 3.3 27.5 85.8 12.7 309.9 1.20 2.36 0.003 0.05
TERSAKAN 2 8.1 268.0 6.3 8.8 57.3 11.9 4.4 16.5 44.7 12.5 192.8 0.75 1.65 0.045 1.19
TERSAKAN 12 8.0 180.4 4.1 9.1 41.3 8.9 2.2 9.0 52.7 6.5 139.6 0.33 0.18 0.013 0.10
TERSAKAN 14 7.8 766.4 21.1 6.5 88.6 41.1 16.0 99.9 198.4 58.7 388.5 0.96 3.08 0.047 1.27
TERSAKAN 29 8.2 96.8 2.4 10.8 15.2 8.2 1.1 4.6 14.1 6.1 72.4 1.15 0.10 0.004 0.15
TERSAKAN 30 7.7 405.8 61.8 25.5 2.8 43.8 51.9 15.4 250.6 2.32 0.25 0.011 0.22
TERSAKAN 31 7.6 350.0 59.7 17.0 0.9 18.3 53.2 11.3 235.8 5.94 0.14 0.013 0.08
TERSAKAN 32 7.6 425.8 76.8 30.6 1.0 14.4 62.3 8.6 317.5 4.41 0.16 0.005 0.03
TERSAKAN 33 7.6 305.0 58.2 19.5 0.6 11.4 41.9 6.5 225.4 3.25 0.23 0.015 0.07
Continued
Mean 8.0 346.7 3.3 9.4 60.6 27.3 4.4 26.2 71.5 15.9 263.1 1.62 0.69 0.024 0.36
Std 0.2 158.8 3.6 1.0 16.9 11.8 7.0 20.1 50.6 12.2 84.8 1.21 0.86 0.021 0.76
Min 7.3 96.8 0.7 6.5 15.2 8.2 0.6 4.6 14.1 6.1 72.4 0.23 0.06 0.001 0.02
Max 8.4 901.6 21.1 10.8 110.0 61.3 35.1 99.9 256.8 58.7 526.6 5.94 3.08 0.074 4.20
% Major Cation and Anion by Charge
Mean 46.4 34.4 1.7 17.5 32.4 9.8 57.6 0.6
and is fairly uniform across the catchment. The alkaline pH values reflect the occurrence of local mineralogy, such as calcite and dolomite. The value of total dissolved solids (TDS) vary from 97 to 902 mg/L with the mean of 343 ± 156 mg/L (n = 33). Ca2+ and Mg2+ are the domi- nant cations; and (hardness) are the do- minant anions. The richness of Ca2+, Mg2+ and
3 4
SO
3
HCO
3
HCO
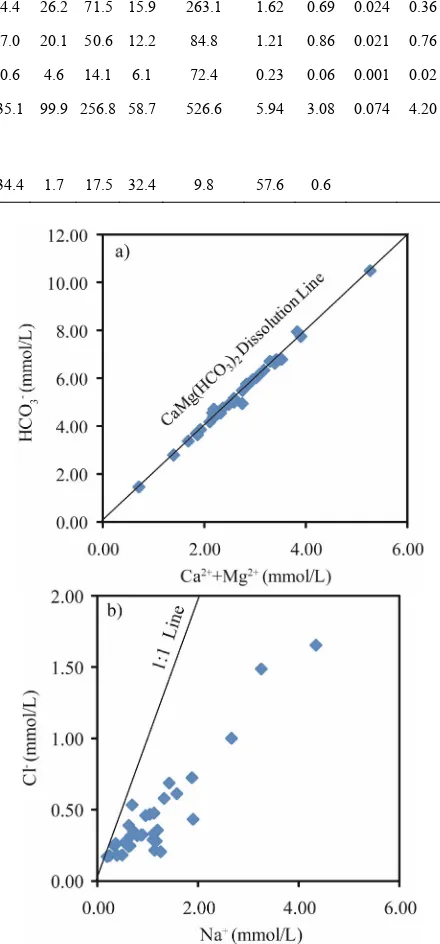
in the area as well as their 1:2 stoichiometric ratio linear relationship of Ca2+ plus Mg2+ versus suggests
3
HCO
that waters in the basin are mostly controlled by carbon-ate weathering, e.g. dolomite in bedrock (Figure 3). Components of Na+ and Cl− do not fall on 1:1 stoi- chiometric ratio line and the excess of Na+ compared to Cl− may indicate that there is another source of Na+ be- sides atmospheric deposition, which is possibly associ- ated with anthropogenic source and local geological source (Figure3).
For BOD, DO and nutrients concentrations (NH4
,
, and o- ), concentrations are also vari-
2
NO
3
NO 3
4
PO
able across the catchment which reflects point and non- point source pollution. BOD values range from 0.67 - 21.14 mg/L with the mean of 3.34 ± 3.65 mg/L (n = 29) and DO range from 6.45 - 10.79 with the mean of 9.38 ± 1.00 mg/L (n = 29). The mean concentrations of nutrients across the catchment are moderate to high with NH4-N
0.69 mg/L, NO3-N 1.62 mg/L and o- 3 0.36 mg/L
4
PO
(Table 2). When compared to a range of average UK river baseflow chemistry, the nitrate levels in the Yesilir- mak River waters are relatively low, corresponding to re- latively undisturbed catchments, such as the River Swale and the Derwent (Table 2). However, ammonium con- centrations are much higher than that of some major UK rivers (Table 2) and orthophosphate concentrations are similar to those rivers affected by point sources and ag- ricultural diffuse inputs.
3.2. Spatial Pattern in Average Water Chemistry
General chemistry (TDS, major cations and anions)
[image:6.595.313.533.105.577.2]The pattern of average general water chemistry (e.g. TDS) from 1995 to 2008 across the basin is presented in Fig-
Figure 3. Bivariate plots (a) of Ca2+ + Mg2+ versus
3
HCO . All points fall along the line with 1:2 stoichiometric ratio, which is CaMg(HCO3)2 dissolution line; (b) Na+ versus Cl−.
Data fall below the line with 1:1 stoichiometric ratio indi- cating excess of Na+ in waters.
Figure 4. Spatial pattern of TDS between 1995 and 2008. Graduated symbols indicate the range of the values. Red asterisks indicate major cities with population greater than 50,000.
Table 2. Average Yesilirmak River water chemistry com- pared to average baseflow chemistry for rural, agricultural and urban/industrial rivers of the UK [39].
Catchment Use NH4-N
(mg/L) NO(mg/L) 3-N (mg/L)SRP
Tweed Rural 0.027 0.600 0.056
Swale Rural 0.000 1.500 0.171
Derwent Agricultural 0.019 2.600 0.227
Eastern
Humber Chalk Agricultural 0.054 8.700 0.261
Eastern
Humber Clay Agricultural 0.070 4.100 0.392
Thames Agricultural 0.030 6.300 1.718
Great Ouse Agricultural 0.017 6.100 2.330
Trent Urban/Industrial 0.079 8.400 2.549
Yesilirmak Rural/Agricultural 0.690 1.620 0.36*
*0.36 is the orthophosphate concentration, which is different from SRP.
However, SRP consists largely of the inorganic orthophosphate form of phosphorus. Orthophosphate is the phosphorus form that is directly taken up by algae.
sections (Figure4). Along the main river, TDS shows an increasing pattern and reaches highest concentration at Amasya (Figure4). The upward trend of TDS along the Yesilirmak River may be due to groundwater discharge, which should have higher TDS from the longer residence time than the river waters. Due to the dilution from the tributary Kelkit River, the Yesilirmak water at the mouth has low TDS, around 280 mg/L. Major cations and ani- ons show similar spatial pattern to TDS, with low con- centrations at headwaters and increased dissolved solutes when flowing downstream.
BOD and DO
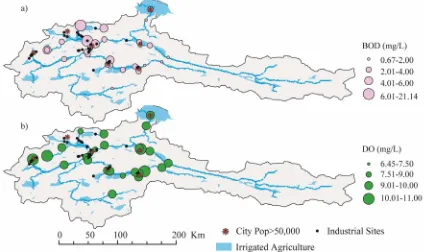
Spatial patterns of average BOD and DO values from 1995 to 2008 within the catchment are presented in the Figure 5. In the case of BOD, concentrations are gener-
ally low in the upper reaches of the river as would be expected in a largely natural upland in the catchment. However, below the major cities, such as Turhul and Amaysa, where effluent discharges dominate the stream water quality, these effluents increase BOD to reasonably high levels. These BOD levels are reinforced by the in- fluence of the Tersakan river downstream, where the in- tensive irrigated agriculture and industrial sites occur (Figure5(a)). Despite these high BOD levels, the DO is shown to be fairly high across the catchment, reflecting the natural reaeration in the river, where natural riffles and water turbulence enhance the reaeration process [37] (Figure5(b)). There is some evidence at two sites in the Tersakan river from spot data that low DO conditions (DO < 3 mg/L) prevail in October and this is normally associated with discharges from the sugar processing factories in late summer months, shortly after the sugar beet harvest. The waste products from sugar processing are known to have very high BOD concentrations and can cause major reductions in DO. The DO levels in these places are much lower than what can normally be tolerated by most fish species.
Nutrients (NH4
,
2
NO,NO3 and o- )
3
4
PO
Spatial patterns of average nutrient concentrations, NH4+, NO2
,
3
NO and o- 3 , are shown in Figure 4
PO
Figure 5. Spatial Patterns of (a) BOD and (b) DO within the catchment. Graduated symbols indicate the range of the values. Red asterisks indicate major cities with population greater than 50,000 and black dots indicate industrial sites.
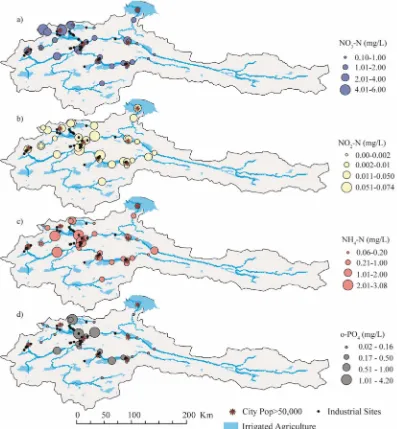
Overall NO3 concentrations are low across the catch
ment with the exception of the Tersakan river subcatch- ment, where irrigated agriculture and several indus- trial sites occur (Figure6(a)). The NO2 concentrations are at medium level and relatively uniform and reflect the denitrification of nitrate and nitrification of ammonia processes taking place down the river system (Figure 6(b)). The headwaters of the Yesilirmak River show rela- tively low 4 until the Çorum and Tersakan tributar-
ies join the main river, and these have relatively high
4 concentrations (Figure 6(c)). These higher am-
monia concentrations are derived from both point sources such as WWTPs or from agriculture. In terms of
o-NH
NH
3 4
PO,
the headwater of the Yesilirmak River has relatively low o- 4 concentrations (Figure 6(d)). This increases
downstream, which illustrates the impact of discharges from urban areas along the river course. A few sites which have very high o- concentrations (> 1.0 mg/L) appear to be downstream of the intensive indus-trial sites. The concentrations at these sites are largely controlled by point-source pollution.
3
PO
3 4
PO
The patterns of NO3 and o- as shown in Fig-
3
4
PO
ures 6 are similar to BOD, although they are also af-fected by the agricultural discharges from irrigated farm- land along the river system. The concentrations of NO3
and o- are higher near agricultural areas, reflecting the application of fertilizers and their drainage into the main river system.
3 4
PO
3.3. Temporal Trends of Water Quality
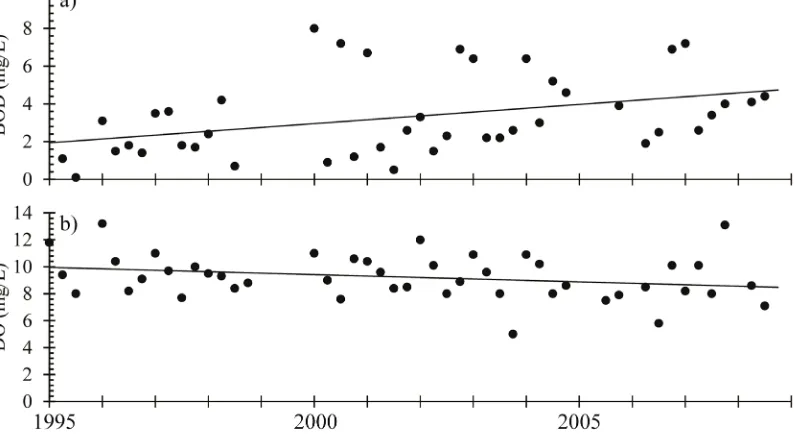
[image:8.595.309.538.627.737.2]An example of the time-series of BOD and DO at Duru- casu, downstream of the city of Amasya (Y3) is shown in Figure 7. There is a slight upward trend in BOD reflect- ing the increased population in the catchment and a slight decrease in DO over time, but the trends are not obvious. We, therefore, performed statistical trend analyses to determine the upward or downward trends and results of trend analyses at selected five locations along the Ye- silirmak River are shown in Table 3. BOD shows in- creasing trends at four locations from the head to the bottom of the river, which may reflect the population growth, industrialization and urbanization since 1990s. Although BOD and DO are negatively correlated, DO at most sites shows no clear trend except at most down-
Table 3. Results of trend analysis (1995-2008) of selected water quality parameters at five sites on the Yesilirmak River. U and D indicate upward and downward trends, respectively. X indicates no clear trend.
ID Station Name BOD DO NH4-N NO2-N NO3-N o-PO4
Y1 TOKAT U X X X D X
Y2 SÜTLÜCE X X X X D X
Y3 DURUCASU U X X X D X
Y4 SUAT UGURLU BARAJ U X D X D X
Figure 6. Spatial Patterns of (a) NO3-N, (b) NO2-N, (c) NH4-N, and (d) o-PO4 (mg/L) across the catchment. Graduated sym-
bols indicate the range of the values. Red asterisks indicate major cities with population greater than 50,000 and black dots indicate industrial sites.
stream site Y5. DO reduction could be due to changing temperature or reduced flows, as irrigation and dam storage schemes have reduced flows in the rivers. NO3
shows consistent decreasing trends over years at five locations, which might suggest the overall less nitrogen inputs into the river over the past 15 years or more nitrate loss from denitrification. There is no clear upward or downward trend of o- 3 at these five locations.
4
PO
3.4. Seasonality of Water Quality
The data (1995-2008) were also analyzed to assess the seasonal changes (Figure8). The seasonal trend of BOD is apparent at upstream sites Y1, Y2 and Y3 with high
Figure 7. Time-series of (a) BOD and (b) DO at Durucasu from year 1995 to 2008.
Figure 8. Seasonal changes of BOD, DO, +,
4
NH 2
NO ,
3
NO and 3- within the catchment.
4
PO
associated with discharges from the sugar processing factories in late summer months, shortly after the sugar
[image:10.595.99.497.239.668.2]cause major reductions in DO.
As with BOD and DO, NH4, NO2 and NO3 con- centrations are at their highest in winter and early spring, and then decline throughout the following months. How- ever, an increasing trend is seen in October. The annual variation of the NO3 concentration in the river is low- est in summer and then increases significantly in winter as soon as soils become wet, which flushes nitrogen from the catchment system. Lower concentrations in summer may reflect the in-stream denitrification process. As with warmer water temperatures and slower water movement in summer (i.e. increased residence times), there is a
greater rate of nitrate loss from denitrification. This is despite the summer lower flows and the reduced dilution of effluents.
o- behaves differently from other parameters. At sites Y2, Y4 and Y5,
o-3 4
PO
3 4
PO concentrations attain the
highest values in summer. This pattern is consistent with a lower dilution potential of summer flow for point (sewage effluent) source. This is noted in UK rivers [5]. On the contrary, at headwater Y1 site shows the highest concentration in January but lowest in summer. This suggests different controls of o- in the head- waters where point source pollution is relatively small.
3 4
PO
3 4
PO
Higher o- concentrations in the winter months might reflect the higher flushing of P load from the soil zone.
3 4
PO
3.5. Water Quality Classification System for Turkey and the EU (2004-2008)
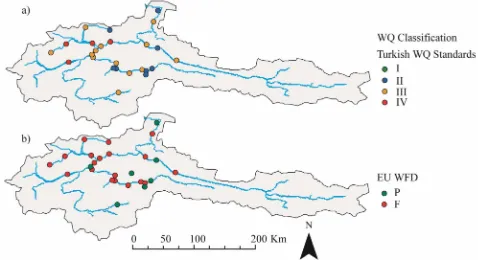
The water quality data has been used to assess the class of the river system as defined by the Turkish Water Qual-ity Classification system shown in Appendix II. Figure 9(a) shows the sampling sites and the different classes that these sites fall into. The majority of locations fall in class II or III and with a few in class IV mostly because of high NH4,
2
NO and o- 3 concentrations. This 4
PO
analysis shows that the river system is in relatively poor quality. In terms of the EU WFD standards, the river system is also in poor condition, as is shown in Figure 9(b), where more than half of the sites fail to meet the WFD requirements (marked as F). Sites with green dots are the ones passed EU standards (marked as P).
3.6. Implications of Our Study
Clearly, there is a need to improve the water quality in the Yesilirmak river system in order to bring the river up to the standards required to meet class I or class II of the Turkish environmental standards and to pass the EU WFD classification. As the water quality and classifica- tion analysis have shown, the river system is failing the Turkish standards, with 50% of the reaches of the river at the lower class III or class IV levels. Also 50% of the reaches are failing the EU WFD for water quality. Therefore researching appropriate approaches to improve
Figure 9. (a) The water quality status expressed in terms of the four Turkish Classes; (b) The water quality status in terms of he EU WFD standards.
[image:11.595.58.536.445.705.2]pollution control within the river system becomes crucial. A water quality modeling study has been published to assess the effectiveness of different strategies, including WWTWs, to improve water quality in the future [24].
In many countries across the EU, pollution results from both point sources such as sewage treatment works and from diffuse sources such as from agricultural runoff when excessive quantities of fertilizers are applied to crops. Diffuse nutrient inputs to aquatic systems in UK are regarded as a major contributor to eutrophication of surface waters [38] and point sources have historically been the main cause of water quality problems in Eng- land. Impacts from urban and rural point sources remain a serious problem with regard to surface water nutrient concentrations. The EU has instituted directives such as the Nitrates Directives and the Water Framework Direc- tives to control such sources of pollution and these are slowly being implemented across the EU. At the moment the effects of agricultural runoff are not that large in the Yesilirmak River as the pollution is more associated with urbanization and population increases. However, the dif- fuse runoff of nutrients is expected to become an in- creasing problem in the future as agriculture is expanded and intensified. Turkey should consider investigating nitrogen and phosphorus controls on agriculture now so that it is not faced with the major problems that the rest of the EU countries have faced since the 1970s. For ex- ample, if Turkey introduced Nitrogen and Phosphorus Vulnerable Zones for all agricultural areas to control fer-tilizer applications so that only the minimum quantities of fertilizer needed for crop growth is applied, this would save considerable national resources at a later stage, which could otherwise be required to control such pollu- tion. Such control measures would prevent the build-up of phosphorus in the river sediments, which will damage stream ecology, and also minimize the production of greenhouse gases such as nitrous oxide generated from the denitrification and nitrification processes in the river system.
4. Conclusions
This study has provided a comprehensive assessment of river water chemistry using an extensive dataset collected by DSI in the Yesilirmak River catchment in Northern Turkey. It presents spatial and long-term temporal and seasonal patterns of physical and chemical determinands at 33 sites across the catchment. The results suggest that mineral dissolution mostly controls the major dissolved elements, such as Ca2+, Mg2+, and . Atmospheric deposition is important in relationship to Cl3 − and Na+.
HCO
Human activity in the region has a significant imprint on BOD, DO and nutrient concentrations (N and P). Ele- vated BOD is mostly associated with urbanization and
population growth as well as sugar processing factories. Nitrate concentrations are generally low across the catch- ment except the Tersakan river sub-catchment in the wes- tern part of the region, where irrigated agriculture and se- veral industrial sites are located. Orthophosphate concen- trations are mainly linked to point sources, but agricul- ture and fertilizer application are also significant. River water chemistry (especially N and P concentrations) is highly variable both spatially and seasonally due to a complex set of interacting hydrological and biogeoche- mical processes.
According to the Turkish water quality classification system, the Yesilirmak River system is of medium qual- ity in terms of pollution (mostly between class II and III). Approximately half the river system fails the EU WFD. In order to change this situation, wastewater treatment becomes critical to improve the water quality signifi- cantly, although the river system still remains highly vulnerable to agricultural pollutions. With agriculture set to increase and intensify in future years, it is recom- mended that the Turkish Authorities investigate an agri- cultural pollution control system in order to ensure that fertilizer use is minimized. This will save considerable cost and effort at some future date, and mean that the water quality in terms of nutrients can be maintained at a high standard.
5. Acknowledgements
We would like to thank DSI State Hydraulic Works for providing us data for analysis.
REFERENCES
[1] R. C. Ferrier, A. C. Edwards, D. Hirst, I. G. Littlewood, C. D. Watts and R. Morris, “Water Quality of Scottish Riv- ers: Spatial and Temporal Trends,” Science of the Total Environment, Vol. 265, No. 1-3, 2001, pp. 327-342.
doi:10.1016/S0048-9697(00)00674-4
[2] C. Neal, H. P. Jarvie, A. Love, M. Neal, H. Wickham and S. Harman, “Water Quality along a River Continuum Sub- ject to Point and Diffuse Sources,” Journal of Hydrology, Vol. 350, No. 3-4, 2008, pp. 154-165.
doi:10.1016/j.jhydrol.2007.10.034
[3] T. V. Royer, M. B. David and L. E. Gentry, “Timing of Riverine Export of Nitrate and Phosphorus from Agricul- tural Watersheds in ILLINOIS: Implications for Reducing Nutrient Loading to the Mississippi River,” Environ- mental Science & Technology, Vol. 40, No. 13, 2006, pp. 4126-4131. doi:10.1021/es052573n
[4] P. J. A. Withers and E. I. Lord, “Agricultural Nutrient Inputs to Rivers and Groundwaters in the UK: Policy, En- vironmental Management and research Needs,” Science of the Total Environment, Vol. 282, No. 1, 2002, pp. 9-24. doi:10.1016/S0048-9697(01)00935-4
fluent Phosphorus: A Greater Risk to River Eutrophica- tion than Agricultural Phosphorus?” Science of the Total Environment, Vol. 360, No. 1-3, 2006, pp. 246-253.
doi:10.1016/j.scitotenv.2005.08.038
[6] C. Neal, H. P. Jarvie, M. Neal, A. J. Love, L. Hill and H. Wickham, “Water Quality of Treated Sewage Effluent in a Rural Area of the Upper Thames Basin, Southern Eng- land, and the Impacts of Such Effluents on Riverine Phos- phorus Concentrations,” Journal of Hydrology, Vol. 304, No. 1-4, 2005, pp. 103-117.
doi:10.1016/j.jhydrol.2004.07.025
[7] C. Neal, H. P. Jarvie, R. J. Williams, M. Neal, H. Wick- ham and L. Hill, “Phosphorus-Calcium Carbonate Satura- tion Relationships in a Lowland Chalk River Impacted by Sewage Inputs and Phosphorus Remediation: An Assess- ment of Phosphorus Self-Cleansing Mechanisms in Natu- ral Waters,” Science of the Total Environment, Vol. 282, 2002, pp. 295-310. doi:10.1016/S0048-9697(01)00920-2 [8] P. G. Whitehead, P. J. Johnes and D. Butterfield, “Steady
state and Dynamic Modelling of Nitrogen in the River Kennet: Impacts of Land Use Change Since the 1930s,” Science of the Total Environment, Vol. 282, 2002, pp. 417-434. doi:10.1016/S0048-9697(01)00927-5
[9] A. L. Heathwaite, “Multiple Stressors on Water Availabi- lity at Global to Catchment Scales: Understanding Human Impact on Nutrient Cycles to Protect Water Quality and Water Availability in the Long Term,” Freshwater Biol- ogy, Vol. 55, No. S1, 55, 2010, pp. 241-257.
doi:10.1111/j.1365-2427.2009.02368.x
[10] P. Quevauviller, “Adapting to Climate Change: Reducing Water-Related Risks in Europe—EU Policy and Research Considerations,” Environmental Science and Policy, Vol. 14, No. 7, 2011, pp. 722-729.
doi:10.1016/j.envsci.2011.02.008
[11] P. G. Whitehead, A. J. Wade and D. Butterfield, “Poten- tial Impacts of Climate Change on Water Quality and Ecology in Six UK Rivers,” Hydrology Research, Vol. 40, No. 2-3, 2009, pp. 113-122. doi:10.2166/nh.2009.078 [12] P. G. Whitehead, R. L. Wilby, R. W. Battarbee, M. Ker-
nan and A. J. Wade, “A Review of the Potential Impacts of Climate Change on Surface Water Quality,” Hydro- logical Sciences Journal, Vol. 54, No. 1, 2009, pp. 101- 123. doi:10.1623/hysj.54.1.101
[13] P. G. Whitehead, R. L. Wilby, D. Butterfield and A. J. Wade, “Impacts of Climate Change on In-Stream Nitro- gen in a Lowland Chalk Stream: An Appraisal of Adapta- tion Strategies,” Science of the Total Environment, Vol. 365, No. 1-3, 2006, pp. 260-273.
doi:10.1016/j.scitotenv.2006.02.040
[14] J. M. Murphy, D. M. H. Sexton, G. J. Jenkins, P. M. Boorman, B. B. B. Booth, C. C. Brown, R. T. Clark, M. Collins, G. R. Harris, E. J. Kendon, R. A. Betts, S. J. Brown, T. P. Howard, K. A. Humphrey, M. P. McCarthy, R. E. McDonald, A. Stephens, C. Wallace, R. Warren, R. Wilby and R. A. Wood, “UK Climate Projections Science Report: Climate Change Projections,” Met Office Hadley Centre, Exeter, 2009.
[15] F. Giorgi and P. Lionello, “Climate Change Projections for the Mediterranean Region,” Global and Planetary
Change, Vol. 63, No. 2-3, 2008, pp. 90-104.
doi:10.1016/j.gloplacha.2007.09.005
[16] H. P. Jarvie, E. Lycett, C. Neal and A. Love, “Patterns in Nutrient Concentrations and Biological Quality Indices across the Upper Thames River Basin, UK,” Science of the Total Environment, Vol. 282, 2002, pp. 263-294.
doi:10.1016/S0048-9697(01)00914-7
[17] P. J. Johnes, “Uncertainties in Annual Riverine Phospho- rus Load Estimation: Impact of Load Estimation Method- ology, Sampling Frequency, Baseflow Index and Catch- ment Population Density,” Journal of Hydrology, Vol. 332, No. 1-2, 2007, pp. 241-258.
doi:10.1016/j.jhydrol.2006.07.006
[18] C. P. Mainstone and W. Parr, “Phosphorus in Rivers— Ecology and Management,” Science of the Total Envi- ronment, Vol. 282, No. 1, 2002, pp. 25-47.
doi:10.1016/S0048-9697(01)00937-8
[19] OECD, “Environmental Performance Reviews Turkey,” OECD, Paris, 2008.
[20] OECD, “Environmental Performance of Agriculture in OECD Countries Since 1990,” OECD, Paris, 2008. [21] S. Filoso, L. A. Martinelli, R. W. Howarth, E. W. Boyer
and F. Dentener, “Human Activities Changing the Nitro- gen Cycle in Brazil,” Biogeochemistry, Vol. 79, No. 1-2, 2006, pp. 61-89. doi:10.1007/s10533-006-9003-0
[22] J. Xia, S. Cheng, X. Hao, R. Xia and X. Liu, “Potential Impacts and Challenges of Climate Change on Water Quality and Ecosystem: Case Studies in Representative Rivers in China,” Journal of Resources and Ecology, Vol. 1, No. 1, 2010, pp. 31-35.
[23] J. H. Christensen, B. Hewitson, A. Busuioc, A. Chen, X. Gao, I. Held, R. Jones, R. K. Kolli, W. T. Kwon, R. La- prise, V. Magaña Rueda, L. Mearns, C. G. Menéndez, J. Räisänen, A. Rinke, A. Sarr and P. Whetton, “Regional Climate Projections,” In: S. Solomon, D. Qin, M. Man- ning, Z. Chen, M. Marquis, K.B. Averyt, M. Tignor and H. L. Miller, Eds., Climate Change 2007: The Physical Science Basis. Contribution of Working Group I to the Fourth Assessment Report of the Intergovernmental Panel on Climate Change, Cambridge University Press, Cambridge, New York, 2007.
[24] M. Hadjikakou, P. G. Whitehead, L. Jin, M. Futter, P. Hadjinicolaou and M. Shahgedanova, “Modelling Nitro- gen in the Yesilirmak River Catchment in Northern Tur- key: Impacts of Future Climate and Environmental Change and Implications for Nutrient Management,” Sci- ence of the Total Environment, Vol. 409, No. 12, 2011, pp. 2404-2418. doi:10.1016/j.scitotenv.2011.02.038 [25] EU, “EU Water Framework Directive,” 2008.
http://ec.europa.eu/environment/water/water-framework/ [26] M. Moroglu and M. S. Yazgan, “Implementation of EU
Water Framework Directive in Turkey,” Desalination, Vol. 226, No. 1-3, 2008, pp. 271-278.
doi:10.1016/j.desal.2007.01.245
[28] S. Gurluk, “Turkey’s Challenges of River Basin Manage- ment and Implementation of the European Union Water Framework Directive,” Paper Presented in BALWOIS 2008 (Balkan Water Observation and Information Sys- tems for Balkan countries). Ohrid, 27-31 May 2008. [29] A. Kurunc, K. Yurekli and F. Ozturk, “Effect of Dis-
charge Fluctuation on Water Quality Variables from the Yesilirmak River Tarim Bilimleri Dergisi,” Journal of Agricultural Sciences, Vol. 11, No. 2, 2005, pp. 189-195. [30] M. C. Lekesiz, Y. Mesci and T. Yorulmaz, “Yesilirmak
River Basin Development Project Model,” International Conference on River Basin Management, Antalya, 22-24 March 2007.
[31] A. Kurunc, K. Yurekli and E. Yutseven, “Determination of Sudden Changes in Time Series of Yesilirmak River- Durucasu Water Quality Records,” Journal of Applied Sciences, Vol. 5, No. 1, 2005, pp. 122-126.
doi:10.3923/jas.2005.122.126
[32] A. Samsunlu, “Ruhr-Yesilirmak Watersheds: Infrastruc- ture Management and Implementations,” International Conference on River Basin Management, Antalya, 22-24 March 2007.
[33] EC, “European Atlas of the Seas,” 2010.
http://ec.europa.eu/maritimeaffairs/atlas/ index_en.htm
[34] J. Kundell, “Water Profile of Turkey,” In: C. J. Cleveland, Ed., Encyclopedia of Earth, Environmental Information Coalition, National Council for Science and the Environ- ment, Washington DC, 2009.
http://www.eoearth.org/article/Water_profile_of_Turkey [35] E. N. Soylu and A. Gonulol, “Phytoplankton and Seasonal
Variations of the River Yesilirmak, Amasya, Turkiye Turkish,” Journal of Fisheries and Aquatic Sciences, Vol. 3, No. 1, 2003, pp. 17-24.
[36] Official Gazette, “Turkish Water Pollution Control Regu- lation, No. 19919.4,” 1988, Ankara.
[37] S. C. Chapra, “Surface Water Quality Modeling,” Mc- Graw Hill, New York, 1997, p. 844.
[38] C. Neal and A. L. Heathwaite, “Nutrient Mobility within River Basins: A European Perspective,” Journal of Hy- drology, Vol. 304, No. 1-4, 2005, pp. 477-490.
doi:10.1016/j.jhydrol.2004.07.045
Appendix I. List of all monitoring stations in the catchment.
Map ID Location ID Site Name Longitude Latitude
Y2 14-07-00-003 YESILIRMAK-SÜTLÜCE 36.115324 40.436558
2 14-07-00-004 TERSAKAN ÇAYI-HAVZA ÇIKISI 35.665764 40.960601
Y3 14-07-00-006 YESILIRMAK-DURUCASU 36.02828 40.749029
4 14-07-00-007 KELKIT ÇAYI-FATLI 36.997674 40.477207
5 14-07-00-009 SALHAN ÇAYI-ÇAYBASI 35.380956 40.7148
6 14-07-00-011 KELKIT ÇAYI-ERBAA ÇIKISI 36.579834 40.693207
7 14-07-00-019 YESILIRMAK-ÇAYKÖY REGÜLATÖRÜ 35.775506 40.522755
8 14-07-00-021 ÇEKEREK IRMAGI-DERI FABRIKASI SONRASI 34.941022 40.535246
9 14-07-00-026 YESILIRMAK-MAYA FABRIKASI SONRASI 35.889644 40.68433
Y5 14-07-00-027 YESILIRMAK-ÇARSAMBA ÇIKISI 36.725779 41.204659
11 14-07-00-029 KELKIT ÇAYI-DERBENT ÇIFTLIGI 36.719026 40.658452
12 14-07-00-030 TERSAKAN ÇAYI-LADIK GÖLÜ REGÜLATÖR ÇIKISI 36.020398 40.919858
13 14-07-00-031 ÇEKEREK IRMAGI-ÇIRDAK 36.147344 40.008586
14 14-07-00-033 TERSAKAN ÇAYI-BOGAZKÖY 35.765822 40.727356
15 14-07-00-037 ÇORUM ÇAYI-SEYHOGLU 35.416835 40.451238
Y1 14-07-00-050 YESILIRMAK-TOKAT ÇIKISI 36.494174 40.340847
17 14-07-00-051 BEHZAT DERESI-YESILIRMAK ÖNCESI 36.555554 40.3233
18 14-07-00-063 ENGIZ DERESI-19 MAYIS BARAJI MEMBA 36.547993 40.267057
19 14-07-00-067 YESILIRMAK-GÜMENEK REGÜLATÖRÜ 36.639378 40.356018
20 14-07-00-073 YESILIRMAK-PAZAR ILÇESI KÖPRÜ 36.307612 40.288687
21 14-07-00-074 KELKIT ÇAYI-OSB SONRASI 36.558366 40.707202
22 14-07-00-075 ÇEKEREK IRMAGI-YESILIRMAK ÖNCESI 35.757962 40.562627
23 14-07-00-076 YESILIRMAK-AMASYA GIRISI ÇAGLAYAN KÖPRÜSÜ 35.810933 40.619084
24 14-07-00-079 TURHAL ÇIVRIL DERESI-ÇIVRIL BARAJI AKS YERI 36.112555 40.356016
25 14-07-00-080 TURHAL ÇIVRIL DERESI-ÇIVRIL REGÜLATÖRÜ 36.074642 40.36443
26 14-07-02-001 YESILIRMAK-ALMUS BARAJ ÇIKISI 36.900762 40.411418
Y4 14-07-02-008 YESILIRMAK-SUAT UGURLU BARAJ ÇIKISI 36.661595 41.043052
28 14-07-02-010 ABDAL IRMAGI-ÇAKMAK BARAJ ÇIKISI 35.156667 40.589626
29 14-07-02-068 DEGIRMENDERE-SALIPAZARI BARAJI ÇIKISI 35.156667 40.589626
30 14-07-10-015 MERZIFON KARADUMAN TESISLERI KUYUSU 35.63962 40.956499
31 14-07-10-016 MERZIFONPASA ARTEZYEN KUYUSU 35.495187 40.877815
32 14-07-10-017 GÜMÜSHACIKÖY BELEDIYESI IÇMESUYU KUYUSU 35.190928 40.88769
Appendix II. The Turkish Water Quality Classification Scheme from “The classification of
inland waters according to quality-Turkish water pollution control regulation-WPCR”
(Offi-cial Gazette, 1988) and the EU WFD criteria
(http://ec.europa.eu/environment/water/water-framework/). Highlighted water quality para-
meters are the ones discussed in details in this paper.
Water Quality Parameter Turkish Water Quality Classes EU WFD criteria
A) Physical and inorganic chemical parameter I II III IV
Temperature (deg C) 25 25 30 >30
pH 6.5 - 8.5 6.5 - 8.5 6.0 - 9.0 except 6.0 - 9.0 6.5 - 9.5
Dissolved oxygen (mg O2/L) >8 6 3 < 3 >5
Oxygen saturation (%) 90 70 40 < 40
Chloride ion Cl− (mg/L) 25 200 400 >400 250
Sulphate ion 2 4
SO (mg/L) 200 200 400 >400 250
Ammonium nitrogen NH4+-N (mg/L) 0.2 1 2 >2 0.39
Nitrite nitrogen NO2-N (mg/L) 0.002 0.01 0.05 >0.05 0.015
Nitrate nitrogen NO3
-N (mg/L)
5 10 20 >20 11.3
Totao phosphorus 3 (mg /L)
4
PO 0.02 0.16 0.65 >0.65
Total dissoluted substance (mg/L) 500 1500 5000 >5000
Color (Pt-Co unit) 5 50 300 >300
Sodium Na+ (mg/L) 125 125 250 >250 200
B) Organic parameter
Chemical oxygen need (KOI) (mg/L) 25 50 70 >70
Biological oxygen need (BOD) (mg/L) 4 8 20 >20
Total Organic carbon (mg/L) 5 8 12 >12
Total kjeldahn-nitrogen (mg/L) 0.5 1.5 5 >5
Oil and grease (mg/L) 0.02 0.3 0.5 >0.5
Surface active substances that react with
Methylene blue (ME) (mg/L) 0.05 0.2 1 >1.5
Phenolic substances (volatile) (mg/L) 0.002 0.01 0.1 >0.1
Mineral oils and derivatives (mg/L) 0.02 0.1 0.5 >0.5
Total pesticide (mg/L) 0.001 0.01 0.1 >0.1 0.0005
C) Inorganic pollution parameter
Mercury Hg (ug/L) 0.1 0.5 2 >2 1
Cadmium Cd (ug/L) 3 5 10 >10 5
Lead Pb (ug/L) 10 20 50 >50 10
Arsenic As (ug/L) 20 50 100 >100 10
Copper Cu (ug/L) 20 50 200 >200 2000
Chrome (total) Cr (ug/L) 20 50 200 >200
Chrome Cr6+ (ug/L) less than measurable 20 50 >50 50
Continued
Nickel Ni (ug/L) 20 50 200 >200 20
Zinc Zn (ug/L) 200 500 2000 >2000
Cyanide (total) CN (ug/L) 10 50 100 >100 50
Floride F− (ug/L) 1000 1500 2000 >2000 1500
Free chloride Cl2 (ug/L) 10 10 50 >50
Sulfide S2− (ug/L) 2 2 10 >10
Iron Fe (ug/L) 300 1000 5000 >5000 200
Manganese Mn (ug/L) 100 500 3000 >3000 50
Boron B (ug/L) 1000 1000 1000 >1000 1000
Selenium Se (ug/L) 10 10 20 >20 10
Barium Ba (ug/L) 1000 2000 2000 >2000
Aluminium Al (mg/L) 0.3 0.3 1 >1 0.2
Radioactivity (Bq/L)
Alfa-activity 0.5 5 5 >5
Beta-activity 1 10 10 >10
D) Bacteriological parameters
Fecal coliform (EMS/100 ml) 10 200 2000 >2000
![Table 2. Average Yesilirmak River water chemistry com- pared to average baseflow chemistry for rural, agricultural and urban/industrial rivers of the UK [39]](https://thumb-us.123doks.com/thumbv2/123dok_us/7793647.727077/7.595.59.285.315.505/average-yesilirmak-chemistry-average-baseflow-chemistry-agricultural-industrial.webp)