Munich Personal RePEc Archive
Fighting corruption when existing
corruption-control levels count : what do
wealth effects tell us?
Simplice A, Asongu
24 February 2012
Online at
https://mpra.ub.uni-muenchen.de/36901/
Fighting corruption when existing corruption-control levels count : what do
wealth effects tell us?
Simplice A. Asongu
E-mail: [email protected]
Tel: 0032 473613172
HEC-Management School, University of Liège.
Fighting corruption when existing corruption-control levels count : what do
wealth effects tell us?
Abstract
Why are some nations more effective at battling corruption than others? Are there
different determinants in the fight against corruption across developing nations? How do wealth
effects play-out when existing corruption-control levels matter in the corruption battle? To
investigate these concerns we examine the determinants of corruption-control throughout the
conditional distribution of the fight against corruption. The following broad findings are
established. (1) Population growth is a(an) tool(impediment) in(to) the fight against corruption in
Low(Middle) income countries. (2) Democracy increases (decreases) corruption-control in
Middle(Low) income countries. As a policy implication, blanket corruption-control strategies are
unlikely to succeed equally across countries with different income-levels and political wills in
the fight against corruption. Thus to be effective, corruption policies should be contingent on the
prevailing levels of corruption-control and income-bracket.
JEL Classification: C10; H10; K10; O10; O55
1. Introduction
There is growing attention in the realization among international development experts
that development requires above all, governance quality. Over the past decades, the issue of
corruption and the search for strategies to fight its corrosive effects have grown in importance as
a topic of public debate and a criterion by which civil society scrutinizes leadership. Advice on
sound policies, well intentioned incentives and aid efforts may not achieve their desired
objectives unless they are offered in an environment which stimulates self-sustaining growth and
development(Jain,2001). There is also growing realization that unsustainable policies do not
always emerge from a deficiency of knowledge about what best policies should be. Rather they
could emanate just as much from decision makers distorting economic policies for their own
interest(Coolidge & Rose-Ackerman, 1997; Grossman & Helpman, 1994; Krueger 1993a;
Krueger 1993b). Corruption is seen by many as one of the principal impediments to the
development of an efficient government system; since it is acknowledged as a “symptom that
something has gone wrong in the management of the state”(Rose-Ackeman,1999, p.9). Even the
public acknowledges at large that corruption is the greatest obstacle to economic
development(Jain, 2001). There is currently a stream of empirical assessments on the causes and
consequences of corruption. Though some consensus is slowly emerging on the determinants of
corruption across countries, a number of aspects remain unaddressed. There is lack of consensus
on the ability to measure corrupt activity and the difficulty of quantifying the impact of
institutions on fighting corruption(Billger & Goel, 2009). The focus of this work is the later
concern. Today policies in the fight against corruption espoused by national governments and
international organizations happen to be similar across countries. Yet the effectiveness of some
The present work contributes to the literature by focusing on the distribution of the
dependent variables(i.e. control of corruption). Corruption-control(hence CC) determinants and
governments’ efficacy in combating corruption maybe different across countries such that
corrupt and ‘clean’ countries respond differently to factors that stimulate the fight against
corruption. This hypothesis prompts the question of whether there are different determinants of
combating corruption in high CC countries as compared to least CC ones. Therefore if existing
levels of CC affect how various motives for the fight against corruption come into play, then
findings of this paper could have significant implications both for the literature and policy
orientation towards the battle against corrupt practices in Africa. It follows that instead of
emphasizing on groups of countries with common CC measures, policy could instead target
groups of countries with the same CC characteristics(high, low or average). The remainder of
the paper is presented as follows. Section 2 reviews existing literature. Data and methodology
are presented and outlined respectively in Section 3. Empirical analysis is covered in Section 4.
We conclude with Section 5.
2. Existing literature
2.1 Theoretical highlights
Borrowing from Jain(2001), corruption requires three preconditions: discretionary power
related to regulations(also see Rose-Ackeman, 1978), economic rents linked to power and
sufficiently marginal punishment(Dong et al.,2012). These are the effects of four main theories
of corruption. (1) Good and misguided governments establish systems that are very rigid. Venal
bureaucrats mould the rules. Corruption diminishes red-tape and if anything improves the
allocation of resources (Leff, 1964; Huntington, 1968). (2) Good and smart governments
regulations. Corruption reduces bureaucracy and deteriorates allocation efficiency (Laffont &
Tirole, 1993). (3) Greedy and smart governments make rules that are very lax and allow
bureaucrats more discretion than they should normally enjoy. There is absence of red-tape and
no need for any corrupt activity. Efficient allocation of resources suffers a great deal (Shleifer &
Vishny,1993). (4) Good and smart governments establish rules that make it tempting for the
bureaucrat to take money and turn-around the rules. A bureaucrat introduces red-tape in a bid to
bend the rules in a way that protects him/her. Corruption and red-tape move hand in hand.
According to Billger & Goel (2009), the theoretical basis for corruption studies also draw
from the larger literature on the determinants of criminal activity, where rational
individuals(bribe-givers, bribe-takers …etc) weigh the relative benefits and costs of
criminal(corrupt) acts(Becker, 1968). Potential benefits of corruption could include
disproportionate favors that monopolist bureaucrats could hand-out(Shleifer & Vishny, 1993) or
they may involve cutting(accelerating) bureaucratic red-tape(Guriev, 2004). The differential
levels of impatience(discount rates) across economic agents induce some to accept/offer bribes
and determine the size of the bribes. Potential costs of indulging in corrupt activity include the
cost of apprehension and punishment. Surviving literature does however allow for the possibility
that monitoring agencies could themselves be corrupt(Banerjee, 1997).
2.2 Types and levels of corruption: how the stakes involved can influence governance
Based on the context of this paper, it is irrelevant to center the debate on the issue of
whether corruption is inherently good or bad. It is more useful to cite which types of corruption
have the most corrosive effect on social/economic stability(development). Political leadership
plays a crucial role in promoting/discouraging(governing) corrupt activities. To effectively shape
corruption as a mere moral failing of politicians, bureaucrats and businessmen. Thus it is more
useful to consider it as a politico-economic phenomenon.
Corrupt activities are prevalent to some degree in all societies. In recent years however
political scientists have aggressively searched to understand the reason some nations and
societies are clearly more vulnerable to abusive political and economic opportunism than others.
In response they have suggested a number of typologies that indicate links between the
incidences of corruption and specific stages of political, economic and social developments
(Kpundeh,1998). With respect to some authors, the types and amounts of corruption vary in
accordance with a number of factors affecting the relationship between government and civil
society(Johnston, 1982). For the purpose of explicitly underlining the objective of our study, it is
useful to categorize the phenomenon into three frameworks: incidental, systematic and systemic
corruption, as summarized in Table 1(consistent with Kpundeh (1998)). Firstly, Incidental
corruption is typical of petty bribery and involves opportunistic individuals or small groups.
Within this framework, corruption is the exception rather than the rule. High-level private sector
actors and senior officials are seldom disturbed by such theft. Secondly, Systematic corruption is
organized, not necessarily pervasive or institutionalized but recurrent. It usually involves large
gains which are for the most part subject to popular scandals. Whereas it is entrenched and
functions with large a number of officials, intermediaries and entrepreneurs, this form of
corruption originates from high-level civil servants that recognize and exploit the illegal
ventures and opportunities in government departments and agencies. Hence, this practice is the
direct violation of the regulation and rule of law. Thirdly, Systemic corruption is pervasive,
institutionalized(perhaps condoned but not necessarily approved), and built into the economic
below a living threshold. In contrast to systematic corruption, it involves all levels of
[image:8.612.72.546.127.404.2]employment.
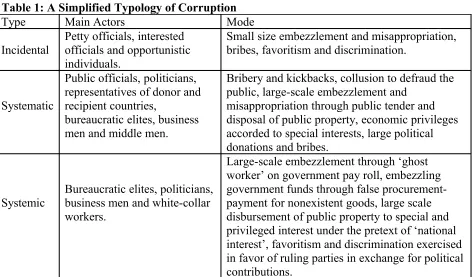
Table 1: A Simplified Typology of Corruption
Type Main Actors Mode
Incidental
Petty officials, interested officials and opportunistic individuals.
Small size embezzlement and misappropriation, bribes, favoritism and discrimination.
Systematic
Public officials, politicians, representatives of donor and recipient countries,
bureaucratic elites, business men and middle men.
Bribery and kickbacks, collusion to defraud the public, large-scale embezzlement and
misappropriation through public tender and disposal of public property, economic privileges accorded to special interests, large political donations and bribes.
Systemic
Bureaucratic elites, politicians, business men and white-collar workers.
Large-scale embezzlement through ‘ghost worker’ on government pay roll, embezzling government funds through false procurement-payment for nonexistent goods, large scale disbursement of public property to special and privileged interest under the pretext of ‘national interest’, favoritism and discrimination exercised in favor of ruling parties in exchange for political contributions.
Source: Kpundeh(1998)
Therefore from a theoretical standpoint the fight against corruption could be incidental,
systematic or systemic. However from a practical view, legislation against corruption often
encompasses the three types. Our paper focuses indifferently on the three categories of
corruption. This is because, where systemic corruption is present, systematic and incidental
corruption are already prevalent; which is the case of most African countries.
2.3 Governance and fight against corruption in Africa
A heated debate has raged on for years over Africa’s economic woes. Besides the
obvious problems of warfare, drought and disease, the usual suspect is economic
policy(Coolidge & Rose-Ackerman, 1997). Corruption remains one of the most daunting
major obstacle to economic progress, social welfare, service delivery and good governance in the
continent.
Borrowing from the United Nations Economic Commission for Africa(UNECA,2009,
p.1), it is estimated that in 2004, the continent lost more than $148 billion to corruption;
approximately 25% of its Gross Domestic Product(GDP). More so, the African Development
Bank(ADB,2006, p.7) suggests that 50% of tax revenue and $30 billion in aid for Africa ends up
in corrupt hands. With respect to the UNECA(2005), corruption ranked as one of the three most
serious national problems confronting African countries, the other two being poverty and
unemployment. According to the 2009 African Governance Report, corruption seems to have
worsened in many Africa countries (UNECA, 2009). Most governance institutions: executive,
legislative, judiciary and public service are deemed to be corrupt. In accordance with the report,
poor governance, lack of accountability and transparency, low level of democratic culture and
tradition, deficiency in citizen participation, lack of clear regulations, low level of institutional
control, extreme poverty and inequality could be cited as major causes of corruption. Civil
society is not even immune to the scourge. In addition, a blurred distinction between private and
public interests, inadequate accounting and auditing, over regulated bureaucracy and
deterioration of acceptable moral standards are all part of the problem.
Many African countries have adopted policy measures, enacted laws and established
institutions in attempts to address the issue. Still corruption continues to be a lingering concern
in governance and economic life. In this paper we attempt to explain determinants in the fight
against corruption. Its contribution to the literature is threefold. (1) By focusing on the
distribution of the dependent variable, we assess if corrupt and ‘clean’ countries respond
provide an assessment of CC conditional on the distribution of CC. (2) The use of much recent
data(2002-2010) based on majority(46) of African countries provides results with inclusive and
updated policy implications. (3) Disaggregation of the data-set into four homogenous panels,
reflecting income-levels(low, middle, lower-middle and upper-middle) could provide more
targeted policy implications.
Given both the herculean task of measuring the true level of corruption and the
substantial effort required in creating another index(which could be no better than existing
indices), two research avenues have been proposed(Billger & Goel, 2009). The first consists of
examining additional determinants of corruption (Treisman, 2000) whereas the second entails
employing different estimation techniques(McAdam & Rummel, 2004). The later strategy is the
object of this paper. This approach allows us to capture the subtle differences in the determinants
of CC across ‘clean’ and ‘dirty’ countries. Therefore an assessment throughout the conditional
distribution of the fight against corruption could substantially add to the extant body of
knowledge in the corruption development nexus.
3. Data and Methodology
3.1 Data
We examine a panel of 46 countries with updated data(2002-2010) from African
Development Indicators(ADI) of the World Bank(WB). To allow for more options in policy
implications, the data-set is disaggregated into income-levels(low, middle, lower-middle and
upper-middle). The endogenous variable is the ‘control of corruption’ indicator; consistent with
the corruption literature(Billger & Goel,2009; Okada & Samreth,2012; Asongu,2012). In this
paper we use five control variables: level of economic prosperity, population growth, democracy,
separately in the corruption literature(Bardhan,1997; Treisman,2000; Jain,2001; Aidt,2003;
Lambdorff,2006; Billger & Goel,2009). A significant bulk of research has shown that a
politico-economic approach stressing the importance of institutions is a powerful tool in understanding
corruption(Abed & Gupta,2002; Bradhan,1997; Rose-Ackerman,1997). Electoral rules and
structures substantially influence the corruption level(Kunicova & Rose-Ackeman,2005) and
countries tend to achieve an equilibrium position that is driven by the balance of political forces
and institutions(Bird et al.,2006; Bird et al.,2008). Beyond these empirical bases in the choice of
government-quality control variables, the theoretical underpinnings of the corruption literature
point to the central role of good-governance in the fight against the scourge. In plainer terms,
selection of variables is fully justified by theoretical and empirical literature. Corresponding
summary statistics(Appendix 1), correlation analysis(Appendix 2), variable definitions(Appendix
3) and presentation of countries(Appendix 4) are provided in the appendices.
Apart from good-governance determinants, borrowing from Billger & Goel
(2009,p.300), economic prosperity and democracy are standard determinants of CC. Economic
prosperity in the literature(Serra,2006) is observed to decrease corruption because from
common-sense to some extent economic theory bribe-takers and bribe-givers are lower in
wealthier nations, as the propensity to take bribe decreases when growth in national income is
equitably distributed. Political competition entrenched in democracy is more likely to exert an
appealing effect on the fight against corruption because elected officials are required to account
for policies and are sanctioned by the electorate if election promises are not kept. A major
election promise in majority of African countries is the fight against corruption. Government
quality enshrined in regulation quality, government effectiveness, rule of law, voice &
which lead to less corruption(Chowdhury, 2004; Goel & Nelson, 2005). The size of the
population is also likely to affect corruption, especially if demographic change is accompanied
with a higher degree of urbanization(Billger & Goel, 2009). A greater concentration of the
population in urban areas is likely to increase their discount rates and provide greater
opportunities for interactions between potential bribe-takers and bribe-givers. Conversely, a
highly concentrated urban population could indicate a greater chance of informal corruption
oversight (Billger & Goel, 2009).
3.2 Methodology
Borrowing from Billger & Goel (2009), to determine whether existing levels of CC
affect how various determinants in the battle against corruption come into play, we use quantile
regression. This approach enables us to investigate if the relationship between CC and the
exogenous variables differ throughout the distribution of the dependent variable(Keonker &
Hallock, 2001).
Previous studies on the determinants of corruption are based on estimation by Ordinary
Least Squares(OLS), which report parameter estimates at the conditional mean of corruption.
Whereas mean effects are certainly important, this study expands such findings using quantile
regression. In addition, one of the underlying assumptions of OLS regression is that the error
term and the dependent variable are normally distributed. However, quantile regression does not
require a normally distributed disturbance term. Thus, based on this estimation technique we are
able to carefully assess the determinants of CC throughout the conditional distribution with
particular emphasis on the best and worst fighters of corruption. Quantile regression( hence QR)
yields parameters estimated at multiple points in the conditional distribution of the dependent
& Goel, 2009; Okada & Samreth, 2012). The θ th quantile estimator of the endogenous variable
is obtained by solving for the following optimization problem.
{ } { } − − + −
∑
∑
′ ′ ∈ ≥ ′ ≥ ∈ ′∈ θβ β β θ β
β k i i i i i i
x y i i i x y i i i
R y x y x
: : ) 1 ( min (1)
Where θ ∈ ( 0 ,1). Contrary to OLS that is based on minimizing the sum of squared residuals,
with QR we minimize the weighted sum of absolute deviations. For example the 10th or 90th
quantiles(with θ =0.10 or 0.90 respectively) by approximately weighing the residuals. The
conditional quantile of yigiven xiis :
θ β
θ i i
y x x
Q ( / )= ′ (2)
where unique slope parameters are derived for each θ th quantile of interest. This formulation is
analogous to E(y/x)= xi′β in the OLS slope though parameters are estimated only at the
mean of the conditional distribution of the endogenous variable. For the model in Eq.(2) the
dependent variable yi is the CC indicator while xi contains a constant term, GDP growth,
population growth, democracy, regulation quality and government effectiveness. The quantile
estimation approach is more robust than the OLS approach in the presence of outliers when the
distribution of the dependent variable is a highly non-normal pattern(Okada & Samreth, 2012).
We also report findings for Least Absolute Deviations(LAD) which should correspond to those
of the 0.5th quantile for robustness purpose.
4. Empirical analysis
4.1 Low and Middle income countries
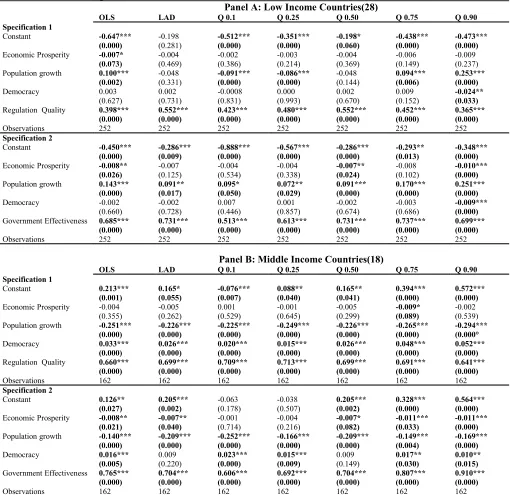
The findings presented in Table 2 entail OLS, LAD and QR estimates. While Panel A
LAD and separate quantiles in the conditional distributions of the endogenous variable. In
interpreting the signs of estimated coefficients, note should be taken of the fact that smaller
values(in conditional distributions) of the endogenous variable denote less CC.
The following could be established from the findings. (1) In Panel A, OLS regressions
show that while economic prosperity mitigates the control of corruption, population growth and
good-governance(regulation quality and government effectiveness) improve it. Corresponding
Panel B OLS results differ from those of Panel A in one dimension: population growth decreases
the fight against corruption. It follows that based on OLS, population growth is a tool for the
fight against corruption only in Low income countries. (2) Based on QR, in both Low and
Middle income countries, economic prosperity reduces incentives to CC with a higher magnitude
at higher quantiles: countries that are already taking the corruption fight seriously. (3) As
concerns QR estimates on population growth, while for Low income countries(hence LICs) the
magnitude of the positive effect of population growth on CC increases in tandem with incentives
to fight corruption, for Middle income countries(hence MICs), the negative effect of
demographic change on CC has no definite pattern(wave-like effect across the distribution). (4)
Whereas democracy diminishes CC in LICs(with the effect only significant at the 0.90th
quantile), the positive effect of democracy on CC in MICs is consistently significant across the
conditional distribution(though the magnitude of the effect is wave-like). (5) Government
effectiveness in either LICs or MICs improves CC with the magnitude increasing with the
distribution: that is as the battle against corruption increases. (6) Regulation quality ameliorates
CC in either LICs or MICs with a quasi-normal distribution with peaks at the 0.50th and 0.25th
quantiles for LICs and MICs respectively. (7) The LAD findings correspond to the 0.50th
Table 2:Corruption-Control: Low and Middle income countries
Panel A: Low Income Countries(28)
OLS LAD Q 0.1 Q 0.25 Q 0.50 Q 0.75 Q 0.90
Specification 1
Constant -0.647*** -0.198 -0.512*** -0.351*** -0.198* -0.438*** -0.473***
(0.000) (0.281) (0.000) (0.000) (0.060) (0.000) (0.000)
Economic Prosperity -0.007* -0.004 -0.002 -0.003 -0.004 -0.006 -0.009
(0.073) (0.469) (0.386) (0.214) (0.369) (0.149) (0.237)
Population growth 0.100*** -0.048 -0.091*** -0.086*** -0.048 0.094*** 0.253***
(0.002) (0.331) (0.000) (0.000) (0.144) (0.006) (0.000)
Democracy 0.003 0.002 -0.0008 0.000 0.002 0.009 -0.024**
(0.627) (0.731) (0.831) (0.993) (0.670) (0.152) (0.033)
Regulation Quality 0.398*** 0.552*** 0.423*** 0.480*** 0.552*** 0.452*** 0.365***
(0.000) (0.000) (0.000) (0.000) (0.000) (0.000) (0.000)
Observations 252 252 252 252 252 252 252
Specification 2
Constant -0.450*** -0.286*** -0.888*** -0.567*** -0.286*** -0.293** -0.348***
(0.000) (0.009) (0.000) (0.000) (0.000) (0.013) (0.000)
Economic Prosperity -0.008** -0.007 -0.004 -0.004 -0.007** -0.008 -0.010***
(0.026) (0.125) (0.534) (0.338) (0.024) (0.102) (0.000)
Population growth 0.143*** 0.091** 0.095* 0.072** 0.091*** 0.170*** 0.251***
(0.000) (0.017) (0.050) (0.029) (0.000) (0.000) (0.000)
Democracy -0.002 -0.002 0.007 0.001 -0.002 -0.003 -0.009***
(0.660) (0.728) (0.446) (0.857) (0.674) (0.686) (0.000)
Government Effectiveness 0.685*** 0.731*** 0.513*** 0.613*** 0.731*** 0.737*** 0.699***
(0.000) (0.000) (0.000) (0.000) (0.000) (0.000) (0.000)
Observations 252 252 252 252 252 252 252
Panel B: Middle Income Countries(18)
OLS LAD Q 0.1 Q 0.25 Q 0.50 Q 0.75 Q 0.90
Specification 1
Constant 0.213*** 0.165* -0.076*** 0.088** 0.165** 0.394*** 0.572***
(0.001) (0.055) (0.007) (0.040) (0.041) (0.000) (0.000)
Economic Prosperity -0.004 -0.005 0.001 -0.001 -0.005 -0.009* -0.002 (0.355) (0.262) (0.529) (0.645) (0.299) (0.089) (0.539) Population growth -0.251*** -0.226*** -0.225*** -0.249*** -0.226*** -0.265*** -0.294***
(0.000) (0.000) (0.000) (0.000) (0.000) (0.000) (0.000°
Democracy 0.033*** 0.026*** 0.020*** 0.015*** 0.026*** 0.048*** 0.052***
(0.000) (0.000) (0.000) (0.000) (0.000) (0.000) (0.000)
Regulation Quality 0.660*** 0.699*** 0.709*** 0.713*** 0.699*** 0.691*** 0.641***
(0.000) (0.000) (0.000) (0.000) (0.000) (0.000) (0.000)
Observations 162 162 162 162 162 162 162
Specification 2
Constant 0.126** 0.205*** -0.063 -0.038 0.205*** 0.328*** 0.564***
(0.027) (0.002) (0.178) (0.507) (0.002) (0.000) (0.000)
Economic Prosperity -0.008** -0.007** -0.001 -0.004 -0.007* -0.011*** -0.011***
(0.021) (0.040) (0.714) (0.216) (0.082) (0.033) (0.000)
Population growth -0.140*** -0.209*** -0.252*** -0.166*** -0.209*** -0.149*** -0.169***
(0.000) (0.000) (0.000) (0.000) (0.000) (0.004) (0.000)
Democracy 0.016*** 0.009 0.023*** 0.015*** 0.009 0.017** 0.010**
(0.005) (0.220) (0.000) (0.009) (0.149) (0.030) (0.015)
Government Effectiveness 0.765*** 0.704*** 0.606*** 0.692*** 0.704*** 0.807*** 0.910***
(0.000) (0.000) (0.000) (0.000) (0.000) (0.000) (0.000)
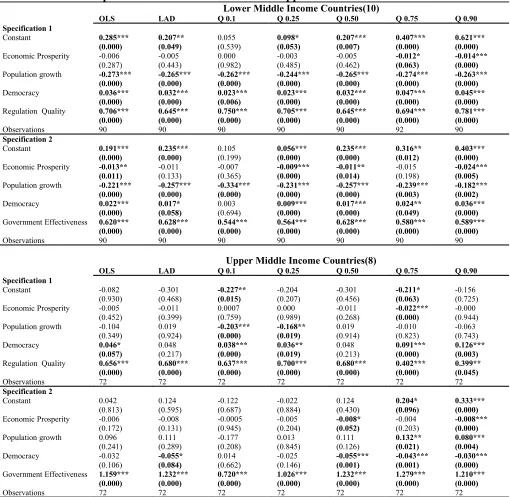
4.2 Lower middle income and Upper middle income countries
Table 3 below presents results for Lower Middle Income(LMI) and Upper Middle
Income(UMI) countries in OLS, LAD and QR estimates. Whereas Panel A presents results for
LMI countries, Panel B depicts findings for their UMI counterparts. OLS estimates provide a
baseline of mean effects and we compare the estimates of LAD and separate quantiles in the
conditional distributions of the endogenous variable. In the comparative analysis smaller
values(in conditional distributions) of the endogenous variable denote less CC.
The following could be established with respect to findings in Table 3. (1) For both Panel
A and Panel B, OLS regressions show that while economic prosperity and population growth
decrease CC, government quality dynamics (democracy, regulation quality and government
effectiveness) improve it. (2) Based on QR in both LMI and UMI countries, economic prosperity
reduces incentives to CC with a greater magnitude at higher quantiles: countries that are already
taking the corruption fight seriously. (3) Population growth is detrimental to CC, however the
pattern of the distribution is not definite(wave-like effect across the distribution). (4) Broadly,
democracy ameliorates CC both in UMI and LMI countries with a greater magnitude at higher
quantiles: countries with existing high CC levels. (5) Government effectiveness in either LMI or
UMI countries improve CC with the magnitude increasing with the conditional distribution up
to a certain level(0.50th quantile for LMI countries and 0.75th for UMI countries) before adopting
a wave-like distribution(for LMI countries) or decreasing(for UMI countries). (6) The positive
effect of regulation quality on CC is somewhat antagonistic: while for LMI countries it decreases
to the 0.50th quantile before increasing, for UMI countries it increases to the 0.25th quantile
before dropping progressively. (6)The LAD findings correspond to the 0.50th quantile estimates
Table 3: Corruption-Control: Lower middle and Upper middle income countries
Lower Middle Income Countries(10)
OLS LAD Q 0.1 Q 0.25 Q 0.50 Q 0.75 Q 0.90
Specification 1
Constant 0.285*** 0.207** 0.055 0.098* 0.207*** 0.407*** 0.621***
(0.000) (0.049) (0.539) (0.053) (0.007) (0.000) (0.000)
Economic Prosperity -0.006 -0.005 0.000 -0.003 -0.005 -0.012* -0.014***
(0.287) (0.443) (0.982) (0.485) (0.462) (0.063) (0.000)
Population growth -0.273*** -0.265*** -0.262*** -0.244*** -0.265*** -0.274*** -0.263***
(0.000) (0.000) (0.000) (0.000) (0.000) (0.000) (0.000)
Democracy 0.036*** 0.032*** 0.023*** 0.023*** 0.032*** 0.047*** 0.045***
(0.000) (0.000) (0.006) (0.000) (0.000) (0.000) (0.000)
Regulation Quality 0.706*** 0.645*** 0.750*** 0.705*** 0.645*** 0.694*** 0.781***
(0.000) (0.000) (0.000) (0.000) (0.000) (0.000) (0.000)
Observations 90 90 90 90 90 92 90
Specification 2
Constant 0.191*** 0.235*** 0.105 0.056*** 0.235*** 0.316** 0.403***
(0.000) (0.000) (0.199) (0.000) (0.000) (0.012) (0.000)
Economic Prosperity -0.013** -0.011 -0.007 -0.009*** -0.011** -0.015 -0.024***
(0.011) (0.133) (0.365) (0.000) (0.014) (0.198) (0.005)
Population growth -0.221*** -0.257*** -0.334*** -0.231*** -0.257*** -0.239*** -0.182***
(0.000) (0.000) (0.000) (0.000) (0.000) (0.003) (0.002)
Democracy 0.022*** 0.017* 0.003 0.009*** 0.017*** 0.024** 0.036***
(0.000) (0.058) (0.694) (0.000) (0.000) (0.049) (0.000)
Government Effectiveness 0.620*** 0.628*** 0.544*** 0.564*** 0.628*** 0.580*** 0.589***
(0.000) (0.000) (0.000) (0.000) (0.000) (0.000) (0.000)
Observations 90 90 90 90 90 90 90
Upper Middle Income Countries(8)
OLS LAD Q 0.1 Q 0.25 Q 0.50 Q 0.75 Q 0.90
Specification 1
Constant -0.082 -0.301 -0.227** -0.204 -0.301 -0.211* -0.156 (0.930) (0.468) (0.015) (0.207) (0.456) (0.063) (0.725) Economic Prosperity -0.005 -0.011 0.0007 0.000 -0.011 -0.022*** -0.000
(0.452) (0.399) (0.759) (0.989) (0.268) (0.000) (0.944) Population growth -0.104 0.019 -0.203*** -0.168** 0.019 -0.010 -0.063
(0.349) (0.924) (0.000) (0.019) (0.914) (0.823) (0.743) Democracy 0.046* 0.048 0.038*** 0.036** 0.048 0.091*** 0.126***
(0.057) (0.217) (0.000) (0.019) (0.213) (0.000) (0.003)
Regulation Quality 0.656*** 0.680*** 0.637*** 0.700*** 0.680*** 0.402*** 0.399**
(0.000) (0.000) (0.000) (0.000) (0.000) (0.000) (0.045)
Observations 72 72 72 72 72 72 72
Specification 2
Constant 0.042 0.124 -0.122 -0.022 0.124 0.204* 0.333***
(0.813) (0.595) (0.687) (0.884) (0.430) (0.096) (0.000)
Economic Prosperity -0.006 -0.008 -0.0005 -0.005 -0.008* -0.004 -0.008***
(0.172) (0.131) (0.945) (0.204) (0.052) (0.203) (0.000)
Population growth 0.096 0.111 -0.177 0.013 0.111 0.132** 0.080***
(0.241) (0.289) (0.208) (0.845) (0.126) (0.021) (0.004)
Democracy -0.032 -0.055* 0.014 -0.025 -0.055*** -0.043*** -0.030***
(0.106) (0.084) (0.662) (0.146) (0.001) (0.001) (0.000)
Government Effectiveness 1.159*** 1.232*** 0.720*** 1.026*** 1.232*** 1.279*** 1.210***
(0.000) (0.000) (0.000) (0.000) (0.000) (0.000) (0.000)
Observations 72 72 72 72 72 72 72
4.3 Discussion, policy implications and limitations
4.3.1 What do wealth effects tell us?
Two important factors that will play in Africa’s future are population growth and
good-governance. Accelerating demographic change remains an important concern in Africa today
with the continent’s emergence as one with the highest demographic growth rate, with the
population projected to double by 2036 and represent 20% of the World by 2050(Asongu &
Jingwa, 2011). The recent geopolitical landscape of the African continent, marked by the
Arab-Spring has centered around the perils of authoritarian regimes(Asongu, 2012). Thus population
growth, democratization and the fight against corruption constitute serious challenges to the
continent’s ability to emerge from poverty.
Our investigation on the incidence of wealth-effects in the fight against corruption when
existing corruption-control levels matter has yielded the following broad findings. (1) Based on
OLS and QR estimates, population growth is a tool for the fight against corruption only in Low
income countries with a higher magnitude at higher quantiles. This suggests that very poor
countries experiencing faster population growth rates could use this instrument positively in
improving good-governance. More so, LICs already taking the fight against corruption
seriously will benefit more from this tool than their counterparts still lax in combating the
scourge. (2) Population growth in MICs significantly mitigates the fight against corruption; this
is consistent with UMI as well as LMI countries. This implies, in wealthier African countries
population growth is accompanied with an increase in ‘bribe-taker bribe-giver interactions’ as
well a decrease in corruption oversight. (3) Democracy decreases CC in LICs, with a significant
effect at the highest quantile. In substance, it implies democratization in LICs doesn’t come
relative lack of financial means to set-up appropriate institutions. (4) Democratization is a tool in
the fight against corruption only in MICs, with significant effects across specifications and
distributions for the most part. This confirms the thesis that democracy requires a certain
threshold in national economic prosperity for effectiveness.
4.3.2 Further discussion and limitations
The battle against corruption remains an important priority in policy making bodies in the
African continent. Our findings suggest that OLS estimates correspond(stricto sensu) at times to
just a specific quantile of the conditional distribution. This difference implies that some policies
based on OLS should be reconsidered, especially across the best and worst fighters of corruption.
Thus our findings demonstrate that blanket CC policies are unlikely to succeed equally across
countries with different income-levels and political-wills in the fight against corruption.
Success of CC policies should be contingent on the prevailing levels of CC and income-bracket
as we have elucidated above. To be effective, CC initiatives should be tailored differently across
the best and worst corruption-fighting countries especially with respect to democracy and
population growth.
A great many African countries already have well established CC policies, yet their
implementation and enforcement is another issue and remains a matter of ‘political will’. The
following are some aspects that need to be accounted for if reform and policies we have
proposed are to yield fruits. (1) The battle against corruption cannot be a ‘one man show’ and
relegated uniquely to political leadership. Anti-corruption endeavors are effective if they are
inclusive, systematic and structured; that is to say integrating all institutions and
policies(investigation, prosecution research and prevention). Such institutionalization develops a
perceived as partisan concerns or ‘witch hunts’. (2) Administrations could establish public
confidence through regular updates in press conferences that outline strides that are being made
towards mitigating wrongdoing, increasing accountability and transparency. (3) The
independence of the anti-corruption body set-up by the powers that be is also paramount for the
success of reform strategies. In Hong-Kong and Singapore for instance, the effectiveness and
success of anti-corruption establishments are directly linked to their degree of autonomy. If the
independent entities are answerable to parliament instead of the head of state, this could improve
their effectiveness.
An important limitation to take into account is that studies of this kind depend quite a lot
on the integrity of the proxy for CC obtained from perception-based measures. Thus omitted
variables and media-effect may significantly influence perceptions on the fight against
corruption in a given country. However, as far as we know there are no better indicators of CC
than those from African Development Indicators of the World Bank.
5.Conclusion
Why are some nations more effective at battling corruption than others? Are there
different determinants in the fight against corruption across developing nations? How do wealth
effects play-out when existing corruption-control levels matter in the corruption battle? To
investigate these concerns we have examined the determinants of corruption-control throughout
the conditional distribution of the fight against corruption. The following broad findings have
been established. (1) Based on OLS and QR, population growth is a tool in the fight against
corruption only in Low income countries with a higher magnitude at higher quantiles. (2)
Population growth in Middle income countries significantly mitigates the fight against
Democracy decreases corruption-control in Low income countries, with a significant effect at the
highest quantile. (4) Democratization is a tool in the fight against corruption only in Middle
income countries, with significant effects across specifications and distributions for the most
part.
As a policy implication, blanket corruption-control policies are unlikely to succeed
equally across countries with different income-levels and political wills in the fight against
corruption. Thus to be effective, corruption policies should be contingent on the prevailing levels
of corruption-control and income-bracket as we have elucidated above. It follows that
control initiatives should be tailored differently across the best and worst
Appendices
Appendix 1: Summary Statistics
Variables Mean S.D Min. Max. Observations
Dependent Variable Control of Corruption -0.612 0.561 -1.694 1.086 414
Independent Variables
Economic Prosperity 4.602 5.254 -31.30 37.99 414
Population Growth 2.262 0.815 -0.143 4.477 414
Democracy 2.903 3.896 -8.000 10.000 414
Regulation Quality -0.651 0.617 -2.394 0.905 414
Government Effectiveness -0.703 0.603 -1.774 0.807 414
S.D: Standard Deviation. Min: Minimum. Max: Maximum.
Appendix 2: Correlation Analysis
CC RQ RL GE V& A PolS Demo GDPg Popg
1.000 0.753 0.867 0.865 0.628 0.648 0.452 -0.043 -0.292 CC 1.000 0.857 0.865 0.751 0.624 0.466 0.109 -0.224 RQ 1.000 0.907 0.700 0.756 0.510 0.063 -0.282 RL 1.000 0.699 0.644 0.483 0.036 -0.396 GE
1.000 0.582 0.750 0.050 -0.100 V& A 1.000 0.492 0.070 -0.194 PolS
1.000 0.073 -0.094 Demo 1.000 0.279 GDPg 1.000 Popg
CC: Control of Corruption. RQ: Regulation Quality. RL: Rule of Law. GE:Government Effectiveness. V& A: Voice & Accountability. PolS: Political Stability. Demo: Democracy. GDPg: GDP Growth. Popg: Population Growth
Appendix 3: Variable Definitions
Variables Signs Variable Definitions Source
Control of Corruption CC Control of Corruption(estimate) World Bank(WDI)
Government Effectiveness GE Government Effectiveness(estimate) World Bank(WDI)
Political Stability/ No Violence PolS Political Stability/ No Violence (estimate) World Bank(WDI)
Regulation Quality R.Q Regulation Quality (estimate) World Bank(WDI)
Rule of Law R.L Rule of Law(estimate) World Bank(WDI)
Voice and Accountability V & A Voice and Accountability (estimate) World Bank(WDI)
Economic Prosperity GDPg GDP growth rate(annual %) World Bank(WDI)
Population growth Popg Average annual population growth rate World Bank(WDI)
Democracy Demo Level of Institutionalized Democracy World Bank(WDI)
Appendix 4: Presentation of Countries
Instruments Instrument Category Countries Num.
Legal-origins
English Common-Law Botswana, The Gambia, Ghana, Kenya, Lesotho, Liberia, Malawi, Mauritius, Namibia, Sierra Leone, South Africa, Sudan, Swaziland, Uganda, Zambia, Tanzania, Zimbabwe.
17
French Civil-Law Algeria, Angola, Benin, Burkina Faso, Burundi, Cameroon,
Central African Republic, Chad, Congo Republic, Congo Democratic Republic, Djibouti, Egypt, Eritrea, Equatorial Guinea, Ivory Coast, Ethiopia, Gabon, Guinea, Guinea-Bissau, Libya, Madagascar, Mali, Mauritania, Morocco, Mozambique, Rwanda, Senegal, Togo, Tunisia.
29
Religions Christianity
Angola, Benin ,Botswana, Burundi, Cameroon, Central African Republic, Congo Republic, Congo Democratic Republic, Ivory Coast, Equatorial Guinea, Ethiopia, Eritrea, Gabon, Ghana, Kenya, Lesotho, Liberia, Madagascar, Malawi, Mauritius, Mozambique, Namibia, Rwanda, South Africa, Swaziland, Togo, Uganda, Zambia, Tanzania, Zimbabwe.
30
Islam Algeria, Burkina Faso, Chad, Djibouti, The Gambia, Egypt, Guinea-Bissau, Guinea, Libya, Mali, Mauritania, Morocco, Senegal, Sierra Leone, Sudan, Tunisia.
16
Income Levels
Low Income Benin ,Burkina Faso, Burundi, Central African Republic, Chad, Congo Republic, Congo Democratic Republic, Djibouti, Ethiopia, Eritrea, The Gambia, Ghana, Guinea-Bissau, Guinea, Kenya, Liberia, Madagascar, Malawi, Mali, Mauritania, Mozambique, Rwanda, Sierra Leone, Togo, Uganda, Zambia, Tanzania, Zimbabwe.
28
Middle Income Algeria, Angola ,Botswana, Cameroon, Egypt, Ivory Coast, Equatorial Guinea, Gabon, Lesotho, Libya, Mauritius, Morocco, Namibia, Senegal, South Africa, Sudan, Swaziland, Tunisia.
18
Lower Middle Income Angola, Cameroon, Egypt, Ivory Coast, Lesotho, Morocco, Senegal, Sudan, Swaziland, Tunisia.
10
Upper Middle Income Algeria, Botswana, Equatorial Guinea, Gabon, Libya, Mauritius, Namibia, South Africa.
8
Reference
Abed, G.T., & Gupta, S., (2002), Governance, corruption and economic performance.
Washington: International Monetary Fund.
African Development Bank(2006), “Combating Corruption in Africa: Issues and Challenges”.
Concept note paper for the 2006 Annual Meetings, Ouagadougou.
Aidt, T. S., (2003), “Economic analysis of corruption: a survey”, Economic Journal, 113, F632–
F652
Asongu, S. A., (2012), “On the effect of foreign aid on corruption”, MPRA Paper No.36545.
Asongu, S. A., & Jingwa, B. A., (2011), “Population growth and forest sustainability in Africa”,
MPRA Paper No. 35179.
Banerjee, A.V., (1997), “A theory of misgovernance”, Quarterly Journal of Economics, 112,
pp.1289-1332.
Bardhan, P., (1997), “Corruption and development: a review of issues”, Journal of Economic
Literature, 35, pp.1020-1046.
Becker, G.S., (1968), “Crime and punishment: an economic approach”, Journal of Political
Economy, 76, pp.169-217.
Billger, S. M., & Goel, R. K., (2009),“Do existing corruption levels matter in controlling
corruption? Cross-country quantile regression estimates”, Journal of Development Economics,
Bird, R. M., Martinez-Varquez, J., & Torgler, B., (2006), Societal institutions and tax effort in
developing countries. In J. Alm, J. Martinez-Vazquez & M. Rider(Eds.), The Challenges of tax
reform in the global economy(pp.283-338). New York: Springer.
Bird, R. M., Martinez-Varquez, J., & Torgler, B., (2008), “Tax effort in developing countries and
high income countries : The impact of corruption, voice and accountability”, Economic Analysis
and Policy, 38, pp. 55-71.
Bradhan, P., (1997), “Corruption and development: A review of issues”, Journal of Economic
Literature, 35, pp.1320-1346.
Chowdhury, S. K., (2004), “The effect of democracy and press freedom on corruption: an
empirical test”, Economic Letters, 85, pp.93-101.
Coolidge, J., & Rose-Ackerman, S.,(1997), “High-level rent-seeking and corruption in African
regimes”, World Bank Policy Research Working Paper No. 1780.
Dong, B., Dulleck, U., & Torgler, B., (2012), “Conditional Corruption”, Journal of Economic
Psychology, Article in Press.
Goel, R.K., & Nelson, M.A.,(2005), “Economic freedom versus political freedom: cross country
influences on corruption”, Australian Economic Papers, 44, pp.121-133.
Grossman, G. M., & Helpman, E., (1994), “Protection for sale”, American Economic Review,
84(4), pp.833-850.
Guriev, S., (2004), “Red tape and corruption”, Journal of Development Economics, 73,
pp.489–504.
Jain, A.K., (2001), “Corruption: A review”, Journal of Economic Surveys, 15, pp.71-121.
Johnston, M., (1982), Political Corruption and Public Policy in America. Monterey, CA:
Brooks-Cole, 1982.
Koenker, R., & Hallock, F.K.,(2001), “Quantile regression”, Journal of Economic Perspectives,
15, pp.143-156.
Kpundeh, S. J.,(1998), Political Will in Fighting Corruption. In Corruption and Integrity,
Improvement Initiatives in Developing Countries. UNDP, OECD.
Krueger, A. O., (1993a), Political Economy of Policy Reform in Developing Countries, Mass:
MIT Press.
Krueger, A. O., (1993b), “Virtuous and vicious cycles in economic development”, American
Economic Review, 83(2), pp.351-355.
Kunicova, J., & Rose-Ackerman, S.,(2005), “Electoral rules and constitutional structures as
constraints on corruption”, British Journal of Political Science, 35, pp.573-606.
Laffont, J., & Tirole, J., (1993), A Theory of Incentives in Procurement and Regulation, MIT
Press.
Lambsdorff, J.G.,(2006), “Causes and consequences of corruption: what do we know from a
cross-section of countries? In: Rose-Ackerman, S.(Ed.), International Handbook of the
Economics of Corruption. Edward Elgar, Cheltenham, UK, pp.3-51.
Leff, N. H., (1964), “Economic Development Through Bureaucratic Corruption”, The American
Behavior Scientist, 8(2), pp.8-14.
Economic Studies, 31, pp.509–523.
Okada, K., & Samreth, S.,(2012), “The effect of foreign aid on corruption: A quantile regression
approach”, Economic Letters, 11, pp.240-243.
Rose-Ankerman, S., (1978), Corruption: A study in political economy, New York: Academic
Press.
Rose-Ankerman, S., (1997). The political economy of corruption. In K.A. Elliott(Ed.),
Corruption and the global economy(pp; 31-60). Washington, D.C: Institute for International
Economics.
Rose-Ankerman, S., (1999), Corruption and government: causes, consequence and reform.
Cambridge: Cambridge University Press.
Serra, D., (2006), “Empirical determinants of corruption: a sensitivity analysis”, Public Choice,
126, pp.225-256.
Shleifer, A., & Vishny, R.W.,(1993), “Corruption”, The Quarterly Journal of Economics,
108(3), pp. 599-617.
Treisman, D., (2000), “The causes of corruption: a cross-national study”, Journal of Public
Economics, 76, pp.399-457.
United Nations Economic Commission for Africa(2005), “Measuring and Monitoring Progress
towards good governance”, African Governance Report II.
United Nations Economic Commission for Africa(2009), “Governance and the fight against
corruption in Africa”, Parliamentary documentation for the first meeting of the Committee on