Using Multivariable Linear Regression Technique
for Modeling Productivity Construction in Iraq
Faiq Mohammed Sarhan Al-Zwainy1, Mohammed Hashim Abdulmajeed2, Hadi Salih Mijwel Aljumaily3
1Department of Civil Engineering, College of Engineering, Al-Nahrain University, Baghdad, Iraq 2Ministry Industry and Minerals, State Industrial Design and Consultation Company (Sidcco), Baghdad, Iraq 3Department of Environmental Engineering, College of Engineering, Al-Mustansiriya University, Baghdad, Iraq
Email: [email protected]
Received June 2, 2013; revised July 2, 2013; accepted July 9,2013
Copyright © 2013 Faiq Mohammed Sarhan Al-Zwainy et al. This is an open access article distributed under the Creative Commons Attribution License, which permits unrestricted use, distribution, and reproduction in any medium, provided the original work is properly cited.
ABSTRACT
Productivity is a very important element in the process of construction project management especially with regard to the estimation of the duration of the construction activities, this study aims at developing construction productivity estimat-ing model for marble finishestimat-ingworks of floors using Multivariable Linear Regression technique (MLR). The model was developed based on 100 set of data collected in Iraq for different types of projects such as residential, commercial and educational projects. Which these are used in developing the model and evaluatingits performance. Ten influencing factors are utilized for productivity forecasting by MLR model, and they include age, experience, number of the assist labor, height of the floor, size of the marbles tiles, security conditions, health status for the work team, weather condi-tions, site condition, and availability of construction materials. One model was built for the prediction of the productiv-ity of marble finishing works for floors. It was found that MLR have the abilproductiv-ity to predict the productivproductiv-ity for finishing works with excellent degree of accuracy of the coefficient of correlation (R) 90.6%, and average accuracy percentage of 96.3%. This indicates that the relationship between the independent and independent variables of the developed models is good and the predicted values from a forecast model fit with the real-life data.
Keywords: Multivariable Linear Regression Techniques; Construction Productivity; Finishing Work; Coefficient of Correlation
1. Introduction
Productivity rates of construction trades are the basis for accurately estimating time and costs required to complete a project. Productivity could be defined as “the ratio of output of required quality to the inputs” for a specific pro- duction situation; in the construction industry, it is gen-erally accepted as “work output per man-hours worked”. Improved productivity helps contractors not only to be more efficient and profitable; knowing actual productiv-ity levels also helps them to estimate accurately and be more competitive during bidding for projects.
In response to the industry needs, the primary goal of this research was to conduct an accurate measurement of on-site construction productivity in Iraq through devel-oping regression models for predicting the productivity of finishing works for floors with marble. The structure of research is consisting of Research justifications, Re-search hypothesis, ReRe-search methodology, Literature re-
view, Factors affecting construction productivity, field data collection, regression models for productivity, vali- dation of models, Conclusion, recommendations and fu- ture research.
It is widely accepted that productivity measurement plays an important role in the construction management process. Productivity measurement provides the neces-sary data to analyze factors for project owners, tors, and management professionals to control construc-tion progress, estimate the cost of future construcconstruc-tion projects, and determine its competitiveness in the global market. In achieving these objectives, the researcher hoped that it could help the Iraq construction firms stay competitive and profitable in the global markets.
2. Research Justifications
1) There are different techniques currently used for construction productivity estimation at different stages of the project development process. Some of these methods suffer the major disadvantages of lack of precision, aged, slow and uncertainty.
2) Construction sector in Iraq needing for modern effi-cient construction productivity estimation techniques that have more advantages such as, being modern, fast, accu-rate, flexible and easy to use is of value.
3. The Research Hypothesis
The research hypothesis is formulated as “Multivariable Linear Regression (MLR) has strong modeling technique with optimization mechanism and effective recognition capabilities to estimate the production rates under any specific condition”.
4. Research Methodology
The research objectives were achieved by using the fol-lowing steps:
1) Literature review: A comprehensive literature re-view was conducted to provide the previous research studies related to the construction productivity and to understand the current Iraq construction industry. The review synthesized the findings from previous literature in textbooks, journal papers, research reports, conference proceedings, theses, dissertations, and Internet publica-tions, and methods of productivity data analyses. The review enabled the researcher to better understand the current status of the field research and to perform studies in both accuracy and practicability;
2) Data collection: The researcher conducted on-site construction productivity measurements in the Iraq. The data were collected from observation and recompiled to a spreadsheet format that is suitable for statistical data analysis by using computer software, such as Statistical Package for the Social Sciences (SPSS);
3) Data analysis and comparison: The data analysis were conducted by using the statistical software package, SPSS 19.0, for determining the productivity rate charac-teristics, and labor productivity. Various statistical analy-sis methods, including descriptive statistics, correlation, and nonparametric tests, were also used for modeling throughout the research;
4) Developed Model: Based on the data analyses’ re-sults, it will provide Multiple Linear Regression model to predicting productivity of marble finishing works for floors and discuses the results from training and testing this model;
5) Validation Model: This stage, which presented the validation of the MLR model;
6) Conclusions, recommendations and future research: Based on the results of the data analyses developed
model and validation model, conclusions and recom-mendations were provided for this research. The conclu-sions included the characteristics of the labor productiv-ity, production effectiveness. In addition, corrective ac-tions and future research were recommended for other researchers who are interested in further research on this topic.
5. Available Productivity Estimation
Techniques
Labor productivity estimates are often performed by in-dividuals using combinations of analytical techniques and personal judgment [1]; namely, the worker hour es-timates are usually obtained through direct interaction with a scheduler, the site manager or related sub-con- tractors who are knowledgeable enough to reflect the actual conditions of a project and its constituent activities [2]. These individuals often have a library of basic pro-ductivity rates which are adjusted and recalculated for each project [3], and always modify their productivity rates for each specific estimate [4]. On the other hand, differences in these productivity rates are always likely and normal [5].
A number of techniques for motion and time study such as time-lapse photography and video can be used along with statistics for analyzing and estimating con-struction-operation productivity [6]. Mathematical mod-els and discrete event simulation techniques can also be applied. This paper presents an alternative approach that utilizes the adaptively of multivariable linear regression to perform the complex mapping from environment and management conditions to operation productivity.
One of the most importance techniques is statistic- based called the multivariable linear regression. It at-tempts to map the relationships between the influential factors and the productivity with the explicit mathemati-cal functions. The mapping functions are initially pre-sumed and later evaluated. They could be linear tions (multivariable linear regression) or non-linear func-tions (multivariable non-linear regression). However, the statistical technique could oversimplify the relationships comparing with the neural network technique [7].
6. Previous Studies on the Construction
Productivity
In Iraqi construction sector, a few studies concerned with the subject of productivity construction. Al-Taweel and Saeed [33] measured the averages and standard per-formance times for work and labors productivity in some construction work items through site studying by using work study. Tahar [34] measured the standard productiv-ity for the employers for some construction work items by using the questionnaires styles distributed to different levels of management. The researcher can immobiliza-tion the productivity for (600) items for different works items in construction work. Abd-allah [35] studied a group of parameters which affect the application of in-centive schemes in the construction companies in Iraq. The effect of these parameters on productivity was stud-ied through the preparation of three questionnaire sets distributed to different levels of management. Al-Zwainy [36] used Back-propagation Feed-forward neural net-works for productivity estimation of the finishing net-works with stone tiles for building project.
In this study, the researcher will be comparing the re-sults of the two different methods to estimate productiv-ity of marble finishing works for floors; these two meth-ods are regression analysis and neural networks. For the subject of estimation construction productivity by neural networks has been completed as an independent research and published in the ARPN Journal of Engineering and Applied Sciences, by the same researcher [37]. In this research will be to predict construction productivity for the same work item using multiple linear regressions and then a comparison between the two methods for the pur-pose of determining the most accurate method.
7. Regression Analysis
Regression analysis is an extremely powerful tool that enables the researcher to learn more about the relation-ships within the data being studied. There are many texts that describe this technique, and the theory behind its use will not be discussed in detail here. The Simon [38] has found the text by Hogg and Ledolter [39] to be particu-larly useful.
In this instance multiple linear regression will be used to determine the statistical relationship between a re-sponse (e.g., actual productivity) and the explanatory variables (e.g., experience, age). The regression model requires a few assumptions. It is of the form
0 1 1 2 2 i
Y X X pXipi (1) where:
1, 2, ,
I n;
Yi is the response that corresponds to the levels of the explanatory variables X X1, 2, , Xp at the ith observa-tion.
0, , ,1 p are the coefficients in the linear rela-tionship. For a single factor (p = 1), 0 is the
inter-cept, and 1 is the slope of the straight line defined.
1, , ,2 n are errors that create scatter around the
linear relationship at each of the i = 1 to n observa-tions. The regression model assumes that these errors are mutually independent, normally distributed, and with a zero mean and variance σ2. It is important to rate that this sometimes difficult to achieve [38]. To make estimates of the coefficients in the regression model, the method of least squares is used for both its mathematical convenience and its ability to provide ex-plicit expressions for these estimates.
8. Factors Affecting Construction
Productivity
Identification and evaluation of factors affecting labour construction productivity have become a critical issue facing project managers for a long time in order to in-crease productivity in construction. Understanding criti-cal factors affecting productivity of both positive and negative can be used to prepare a strategy to reduce inef-ficiencies and to improve the effectiveness of project performance. Knowledge and understanding of the vari-ous factors affecting construction labour productivity is needed to determine the focus of the necessary steps in an effort to reduce project cost overrun and project com-pletion delay, thereby increasing productivity and overall project performance. Based on the study and survey, al- though many researchers have been done and produce the factors that affect productivity, there are still many productivity problems that remain unknown and need to be further investigated even in developed countries [40]. In addition, policies for increasing productivity are not necessarily the same in every country. And the critical factors in developing countries differ from that in devel-oping countries.
The methodology used in this research to determine the factors affecting the productivity of finishing flooring with marble, involves; Literature survey and Preliminary interviews.
The researcher conducted a number of personal inter-views with five (60) engineers who have extensive ex-perience in managing construction projects in Iraq. Some of these engineers work as a project manager, estimators, planners and site engineers, and they working with dif-ferent companies at the Ministry of Construction and Housing Iraqi. And all these engineers with experience not less than twenty years in the field of specialization.
respec-tively below.
The quantitative (objective) variables that can be mea- sured, depending on the unit of measurement, such as age is measured in years, experience is measured in years and floor height is measured in meters.
The qualitative (subjective) variables can be measured depending on the coding system, for example, the secu-rity conditions can be classifies to secusecu-rity and non-secu- rity and assigns them the value 1 and 2, respectively. Also the health status for work team which specifies as good, moderate and bad, it assigns them the values of 1, 2 and 3, respectively. While the weather condition; sunny (1), rainy (2). The site conditions can be classifies to complex and simple and assigns them the value 1 and 2, respectively. Where as the scale of 1 and 2 represent near and far, respectively about availability of construction materials.
9. Data Collection
[image:4.595.306.539.451.711.2]Researcher has identified that suitable method of data collection influenced the accuracy of the production rates values. However questionnaire survey is the most com-monly data collection method adopted by the researcher to collect information on factors and production There-fore, direct observation method has been selected for collecting the data in this research. Pilot study has been done by selecting ten construction projects in different parts of Iraq. Work sampling approach has been used to measure the production rates at site to calculate duration of activity on daily basis at specific time interval using stop watch. Researcher has been able to get fifteen (15) number of observation from each of ten (10) projects at
Table 1. The objective variables.
Objective variables Description Units
X1 Age Year
X2 Experience Year
X3 Number of the labor Number
X4 Height of the floor Length (meter)
X5 Size of the marbles tiles Area
Table 2. The subjective variables.
Subjective variables Description Units
X6 The security conditions Category
X7 The health status for the work team Category
X8 Weather conditions Category
X9 Site condition Category
X10 Availability of construction materials Category
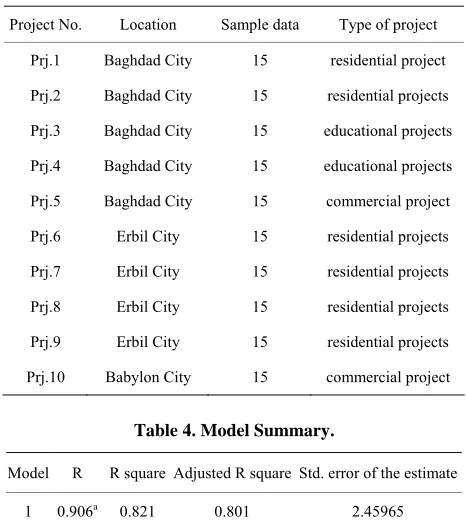
different intervals. Among ten projects five residential, commercial and educational projects are from Baghdad, four residential projects is from Arbil and one commer-cial project is from Babylon as shown in Table 3. There-fore total one hundred and fifty (150) number of data samples has been gathered.
10. Development of Multivariable Linear
Regression Model
Several functions can be used for studying the relation-ships among the variables of a given data which were stated previously at previous section. Multivariable Lin-ear Regression (MLR) is adopted in the resLin-earch since the MLR is the most widely used type and using the pro-ject characteristics (parameters) in a mathematical model to predict construction productivity.
The Statistical Product and Solutions Services (SPSS) software; Vertion. 19 is used to develop the model, and the results of the statistical analysis are shown in Table 4 and Table 5 below.
The correlation among input variables is tested; the results are shown in Table 4. The results of r (coefficient of correlation) and r2 (coefficient of determination) show that there is a high correlation between construction pro-ductivity and other input variables. This indicates a good relationship between dependent and independent vari-ables.
Table 3. Construction project visited for measuring labor productivity rates.
Project No. Location Sample data Type of project
Prj.1 Baghdad City 15 residential project
Prj.2 Baghdad City 15 residential projects
Prj.3 Baghdad City 15 educational projects
Prj.4 Baghdad City 15 educational projects
Prj.5 Baghdad City 15 commercial project
Prj.6 Erbil City 15 residential projects
Prj.7 Erbil City 15 residential projects
Prj.8 Erbil City 15 residential projects
Prj.9 Erbil City 15 residential projects
Prj.10 Babylon City 15 commercial project
Table 4. Model Summary.
Model R R square Adjusted R square Std. error of the estimate
1 0.906a 0.821 0.801 2.45965
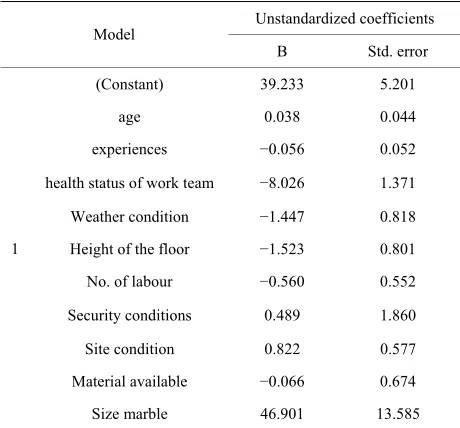
[image:4.595.57.284.502.607.2]Table 5. Uonstandard coefficients of variables.
Unstandardized coefficients Model
B Std. error
(Constant) 39.233 5.201
age 0.038 0.044
experiences −0.056 0.052
health status of work team −8.026 1.371
Weather condition −1.447 0.818
Height of the floor −1.523 0.801
No. of labour −0.560 0.552
Security conditions 0.489 1.860
Site condition 0.822 0.577
Material available −0.066 0.674 1
Size marble 46.901 13.585
The values above indicate that at least one of the model coefficients is nonzero. The model appears to be useful for predicting the construction productivity. This model included all the potential independent variables that have been identified. The model obtained is:
39 233 0 038 1 0 056 2 0 560 3 1 523 4 46 901 5 0 489 6
8 026 7 1 447 8 0 822 9 0 066 10
P . . X . X . X
. X . X . X
. X . X . X . X
(2)
where:
P: productivity of marble finishing works for floors as output (dependent) variable;
X1, X2, X3, X4, X5, X6, X7, X8, X9, X10: Input ( inde-pendent) variables are shown in Tables1 and 2.
11. Validation Model
There are several basic ways of validating a regression model. They are:
1) Statistical test on “r” value.
2) Collection of new data to check the model and its predictive ability for comparison of results with the ac-tual productivity of marble finishingworks for floorsand the predicted productivity values
11.1 Statistical Test on “R” Value
The following statistical tests were conducted on “R” (the coefficient of correlation) value for model 1, where
R2 = 0.821, N = 100:
1) Probable Error (P.E.) in “R” value
1 2
0 6745 R
P.E. .
N
P.E. = 0.01207355 therefore, R = 0.906 ± 0.01207355. According to Gupta [41]; the probable error is re-garded as a measure of significance of Karl Person’s co-efficient of correlation (R), and if the probable error is small (compared with R), correlation directly exists where R > 0.5.
Hence, the correlation of the studied productivity equation is existing.
2) Standard Error (S.E.) in “R” value 2
1 R
S.E. N
(4)
S.E. = 0.1906.
Hence, the correlation is accepted for R = 0.906, and 100 observations.
3) Test of significance
Gupta [41]; indicates that the correlation may be ac-cepted when R > 0.22 (for 100 observations).
Again, the correlation is accepted for R = 0.906, and 100 observations.
4) A simple method of testing whether “R” differs sig-nificantly from “zero”
Taking null hypothesis that there is no correlation be-tween the two variables, provided “N” is large:
3
N (5)
IF the value arrived at by this test is greater than the observed or computed value of correlation coefficient
(R < 3
N ) correlation is not significant [41];
3 3 0 3 0 906
100 . .
N (6)
Hence, coefficient of correlation can be taken as sig-nificant.
11.2. Collection of New Data to Check the Model and Its Predictive Ability
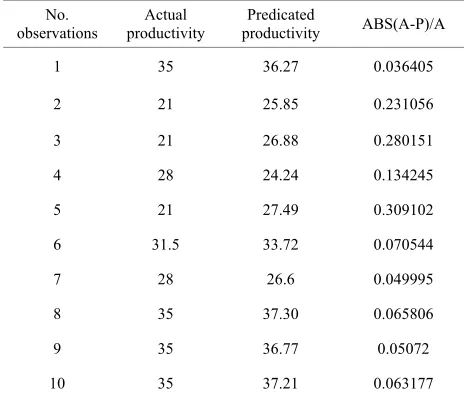
In this research, the second method is employed also. Ten new observations for each concerning variables were collected as shown in Table 6. These observations which were not included in the model calibration procedures were used as independent verification check. While the actual productivity of marble finishingworks for floors and the predicted values are presented in Table 7.
Table 6. Number of observations for each variable.
No. observations
Variables
1 2 3 4 5 6 7 8 9 10
X1 45 40 40 40 50 50 35 38 45 40
X2 20 15 20 20 18 18 15 22 35 35
X3 1 2 2 2 2 1 2 1 1 1
X4 1 1 1 2 1 2 1 1 1 1
X5 1 3 3 2 2 1 2 1 1 1
X6 4 3 3 3 3 4 3 4 4 3
X7 1 1 2 1 2 1 2 1 1 1
X8 1 1 2 1 2 1 2 1 1 1
X9 1 1 1 1 1 1 1 1 2 1
[image:6.595.55.287.369.569.2]X10 0.18 0.18 0.18 0.15 0.15 0.15 0.21 0.21 0.21 0.21
Table 7. The actual productivity and the predicted predi-cated.
No.
observations productivity Actual productivity Predicated ABS(A-P)/A
1 35 36.27 0.036405
2 21 25.85 0.231056
3 21 26.88 0.280151
4 28 24.24 0.134245
5 21 27.49 0.309102
6 31.5 33.72 0.070544
7 28 26.6 0.049995
8 35 37.30 0.065806
9 35 36.77 0.05072
10 35 37.21 0.063177
tivity of marble finishingworks for floors bysuggested productivity estimation function are closer to the actual productivity.
12. Accuracy of the Developed Multivariable
Linear Regression Models
The statistical measures used to measure the performance of the models included[41]:
1) Mean Absolute Percentage Error (MAPE),
1
MAPE n 100%
i
A E
n A
2) Average Accuracy Percentage (AA%)
AA% 100% MAPE (8)
[image:6.595.308.540.508.704.2]3) The Coefficient of Determination (R2); 4) The Coefficient of Correlation (R);
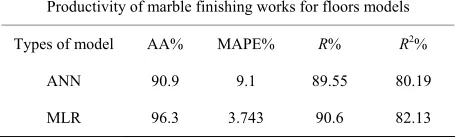
Table 8 shows a summary of the developed regression models in the study, the results of the comparative study are given in Table 8. The MAPE and Average Accuracy Percentage generated by MLR model were found to be (3.74%) and (96.3%) respectively. Therefore, it can be concluded that the MLR model show very good agree-ment with the actual measureagree-ments.
The comparison between the predicated and measured the productivity of marble finishing works for floors is plotted in Figure 1. It is clear from this figure, the ability of multivariable linear regression technique to predict the productivity of marble finishing works for floors for any of data set within the range data used in developing the multivariable linear regression approach.
The coefficient of determination (R2) is (82.13%), as shown in Figure 1, therefore it can be concluded that ANN models show very good agreement with actual measurements.
Comparison of Productivity Modeling between MLR Technique and ANN
Artificial Neural Networks (ANN) are sophisticated methods that are used to estimation the construction productivity in the construction sector, and the researcher using the results of a previous study prepared by Al- Zwainy et al. 2012, for the purposes of comparison with the results of this study. The estimation performances of
Table 8. Statistical measures results.
Measures MAPE% AA% R R2
Results 3.74 96.3 0.906 0.821
the two techniques are compared using four
measure-n this research, the followi
developing construction pro-du
gression (MLR) can be to
bles used ve
[image:7.595.58.286.668.737.2]the technique of Multivari
Table 9. Estimation performances of the MLR and ANN
Productivity of marble finishingworks for floors models
able L Regression was acc n ral
REFERENCES
[1] J. Portas and etwork Model for
Estimating Con ,” Journal of Con- ments as shown in Table 9. The results can be seen that
the MLR technique gives insignificantly better results than the NN technique in almost all comparisons. The findings showed that the two models were able to map the underlying relationship between the independent fac-tors and the construction productivity during and main-tained average accuracy percentages of 90.9% and 96.3% for neural nets and regression respectively. On the other hand, these results indicate that there is no significant difference in the average accuracy achieved by the two techniques. The high levels of accuracy obtained by the two models can be attributed to the high correlation coef-ficients between the construction productivity and the effect factors.
13. Conclusions
From the results presented i ng
conclusions can be made: 1) This study aimed at
ctivity estimating model for marble finishingworks of floors using multiple regression techniques. The model was developed based on 100 set of data collected in Iraq. Such types of models are very useful, especially in its simplicity and ability to be handled by calculator or a simple computer program.
2) Multivariable Linear Re used examine several variables at once and the interrela- tionships between them. And MLR has the ability to pre- dict the productivity of marble finishing works for floors with high degree of accuracy with 96.3% and the coeffi- cients of determination R2 for the developed models equal to 0.8213. This indicates that the relationship be- tween the independent and independent variables of the developed models is good and the predicted values from a forecast model fit with the real-life data.
3) In this research, ten influential varia de- loping construction productivity estimating model. Size marbles have most significant effect on the productivity of marble finishing works for floors equal to 46.901 as an unstandardized coefficients. While the other input vari- ables have moderate impact on the productivity such as health status of work team.
4) This study showed that
techniques.
Types of model AA% MAPE% R% R2%
ANN 90.9 9.1 89.55 80.19
MLR 96.3 3.743 90.6 82.13
inear more urate tha Neu
Networks, because the degree of accuracy reached 96.3% for Multivariable Linear Regression, while the degree of accuracy reached 96.3% for Neural Networks.
S. AbouRizk, “Neural N struction Productivity
struction Engineering and Management, Vol. 123, No. 4, 1997, pp. 399-410.
doi:10.1061/(ASCE)0733-9364(1997)123:4(399) [2] D. Arditi, O. B. Tokdemir and K. Suh, “Effect of
ing-of-Balance Scheduling,” International Journal of Pro- Learn- ject Management, Vol. 19, No. 5, 2001, pp. 265-277. doi:10.1016/S0263-7863(99)00079-4
[3] D. G. Proverbs, G. D. Holt and P. O. Olomolaiye, “A Comparative Evaluation of Planning Engineers’ Form- work Productivity Rates in European Construction,” Build- ing and Environment, Vol. 33, No. 4, 1998, pp. 181-187. doi:10.1016/S0360-1323(97)00035-8
[4] J. Christian and D. Hachey, “Effects of Delay Times on Production Rates in Construction,” Journal of Construc- tion Engineering and Management, Vol. 121, No. 1, 1995, pp. 20-26.
doi:10.1061/(ASCE)0733-9364(1995)121:1(20) [5] A. Kazaz and S. Ulubeyli, “A Different Approach
struction Labour in Turkey: Comparative Productivity Tocon- Analysis,” Building and Environment, Vol. 39, No. 1, 2004, pp. 93-100. doi:10.1016/j.buildenv.2003.08.004 [6] C. H. Oglesby, H. W. Parker and G. A. Howell, “Produc-
tivity Improvement in Construction,” McGraw-Hill Book
th Neural Networks,” Journal of Co., New York, 1989.
[7] R. Sonmez and J. E. Rowings, “Construction Labor Pro- ductivity Modeling wi
Construction Engineering and Management, Vol. 124, No. 6, 1998, pp. 498-504.
doi:10.1061/(ASCE)0733-9364(1998)124:6(498) [8] J. C. Kellogg, G. E. Howell and D. C. Taylor, “Hi
Model of Construction Productivity,” Journal of th erarchy
e Con-
w
uctivity,” Journal of Construction Engi- struction Division, Vol. 107, No. 1, 1981, pp. 137-152. [9] Business Roundtable, “Construction Productivity Meas-
urement,” Report No. A-1, Business Roundtable, Ne York, 1982.
[10] H. R. Thomas and I. Yiakoumis, “Factor Model of Con- struction Prod
neering and Management, Vol. 113, No. 4, 1987, pp. 626-639.
doi:10.1061/(ASCE)0733-9364(1987)113:4(623) [11] H. R. Thomas, W. F. Maloney, R. M. W. Horner
Smith, V. K. Handa and S. R. Sanders, “Modelin, G. R. g Con- struction Labor Productivity,” Journal of Construction Engineering and Management, Vol. 116, No. 4, 1990, pp. 705-726.
doi:10.1061/(ASCE)0733-9364(1990)116:4(705) [12] J. D. Borcherding, “Improving Productivity in Industrial
[13] J. D. Borcherding, S. J. Sebastian and N. M. Samelson, “Improving Motivation and Productivity on Large Pro-
rnal of Construction Engineering and jects,” Journal of the Construction Division, Vol. 106, No. 1, 1980, pp. 73-89.
[14] W. F. Maloney, “Productivity Improvement: The Influ- ence of Labor,” Jou
Management, Vol. 109, No. 3, 1983, pp. 321-334. doi:10.1061/(ASCE)0733-9364(1983)109:3(321) [15] C. H. Oglesby, H. W. Parker and G. A. Howell, “Pr
tivity Improvement in Construction,” McGraw-Hill,
oduc-ity,” Journal of the Construction Divi-
ivity—A Case Inc., New York, 1989.
[16] R. D. Logcher and W. C. Collins, “Management Impacts on Labor Productiv
sion, Vol. 104, No. 4, 1978, pp. 447-461.
[17] H. R. Thomas, V. E. Sanvido and S. R. Sanders, “Impact of Material Management on Product
Study,” Journal of Construction Engineering and Man-agement, Vol. 115, No. 3, 1989, pp. 370-384.
doi:10.1061/(ASCE)0733-9364(1989)115:3(370) [18] C. W. Ibbs and W. E. Allen, “Quantitative I
Project Change,” Source Document 108, Cons mpa
truction cts of
Industry Institute, University of Texas at Austin, 1995. [19] C. W. Ibbs, “Quantitative Impacts of Project Change:
Size Issues,” Journal of Construction Engineering and Management, Vol. 123, No. 3, 1997, pp. 308-311. doi:10.1061/(ASCE)0733-9364(1997)123:3(308)
[20] A. S. Hanna, J. S. Russell, T. W. Gotzion and E. V. Nord- heim, “Impact of Change Orders on Labor Efficiency for Mechanical Construction,” Journal of Construction En- gineering and Management, Vol. 125, No. 3, 1999, pp. 176-184.
doi:10.1061/(ASCE)0733-9364(1999)125:3(176) [21] H. R. Thom
Labor Productivity Due to Delivery Methods anas, D. R. Riley and V. E. Sanvido, “Loss ofd Wea-ther,” Journal of Construction Engineering and Man- agement, Vol. 125, No. 1, 1999, pp. 39-46.
doi:10.1061/(ASCE)0733-9364(1999)125:1(39) [22] W. Ibbs, “Impact of Change’s Timing on La
tivity,” Journal of Construction Engineering an bor Produc-
d Man- agement, Vol. 131, No. 11, 2005, pp. 1219-1229. doi:10.1061/(ASCE)0733-9364(2005)131:11(1219) [23] A. S. Hanna, C. K. Chang, J. A. Lackney and K. T. van, “Impact of Overmanning on Mechanical and S
Sulli- heet Metal Labor Productivity,” Journal of Construction En- gineering and Management, Vol. 133, No. 1, 2007, pp. 22-28. doi:10.1061/(ASCE)0733-9364(2007)133:1(22) [24] H. R. Thomas, C. T. Mathews and J. G. Ward, “Learning
Curve Models of Construction Productivity,” Journal of Construction Engineering and Management, Vol. 112, No. 2, 1986, pp. 245-258.
doi:10.1061/(ASCE)0733-9364(1986)112:2(245) [25] J. G. Everett and S. Farghal
for Construction Field Operations,” , “Learning Curve Predictors Journal of Construc- tion Engineering and Management, Vol. 120, No. 3, 1994, pp. 603-616.
doi:10.1061/(ASCE)0733-9364(1994)120:3(603) [26] J. P. Couto and
Learning Curve Effect on Highrise Floor Constru J. C. Teixeira, “Using Linear Model for
ction,”
Construction Management & Economics, Vol. 23, No. 4, 2005, pp. 355-364. doi:10.1080/01446190500040505 [27] A. M. Jarkas, “Critical Investigation into Applicability of
the Learning Curve Theory to Rebar Fixing Labor Pro- ductivity,” Journal of Construction Engineering and Ma- nagement, Vol. 136, No. 12, 2010, pp. 1279-1288. doi:10.1061/(ASCE)CO.1943-7862.0000236 [28] A. M. Jarkas and M. Horner, “Revisiting the Applic
ity of Learning Curve Theory to Formwork Labour abil-
Pro- ductivity,” Construction Management & Economics, Vol. 29, No. 5, 2011, pp. 483-493.
doi:10.1080/01446193.2011.562911 [29] H. R. Thomas and I. Zavrski, “Co
Productivity: Theory and Practice,” Jonstruction Baseline urnal of Construc- tion Engineering and Management, Vol. 125, No. 5, 1999, pp. 295-303.
doi:10.1061/(ASCE)0733-9364(1999)125:5(295) [30] H. R. Thomas and V. E. Sanvido, “Quantification of
Losses Caused by Labor Inefficiencies: Where Is the Elu-
truction Engineering and sive Measured Mile?” Construction Law and Business, Vol. 1, No. 3, 2000, pp. 1-14.
[31] W. Ibbs and M. Liu, “Improved Measured Mile Analysis Technique,” Journal of Cons
Management, Vol. 131, No. 12, 2005, pp. 1249-1256. doi:10.1061/(ASCE)0733-9364(2005)131:12(1249) [32] L. D. Nguyen and W. Ibbs, “Case Law and Variations
Cumulative Impact Productivity Claims,” Journal of Con-in
struction Engineering and Management, Vol. 136, No. 8, 2010, pp. 826-833.
doi:10.1061/(ASCE)CO.1943-7862.0000193 [33] N. Al-Taweel and M. A. Saeed, “Measuring
Times for Labors Productivity for a Number
Standard of Different
,” Msc. Thesis,
tor in Iraq,” Master
ing Stone
Using Floors
entists,” 2nd Edition, Macmillan,
es,” Journal of Construction Engineer-Work Items,” Journal in Engineering and Technology, Vol. 10, No. 2, 2005, 1991, pp. 249-256.
[34] A. J. Tahar, “Studying Labour Productivity for Some Working Items in Construction Projects
University of Technology, Iraq, 1995.
[35] A. Abd-allah, “Effect of Wages and Incentives on La-bours Productivity in Construction Sec
Thesis, University of Technology, Iraq, 1999.
[36] F. M. S. Al-Zwainy, “The Use of Artificial Neural Net-works for Productivity Estimation of finish
Works for Building Projects,” Journal of Engineering and Development, Vol. 16, No. 2, 2012, pp. 42-60. http://www.iasj.net/iasj?func=fulltext&aId=68252 [37] F. M. S. Al-Zwainy, A. R. Hatem and F. I. Huda, “
Artificial Neural Network for Finishing Works for with Marble,” ARPN Journal of Engineering and Applied Sciences, Vol. 7, No. 6, 2012, pp. 714-722.
http://www.arpnjournals.com/jeas/research_papers/rp_20 12/jeas_0612_714.pdf
[38] R. V. Hogg and J. Ledolter, “Applied Statistics for Engi-neers and Physical Sci
New York, 1992.
[39] S. D. Smith, “Earthmoving Productivity Using Linear Re- gression Techniqu
,” Jour- [40] A. Makulsawatudom and M. Emsley, “Critical Factors
Influencing Construction Productivity in Thailand nal of KMITNB, Vol. 14, No. 3, 2004, pp. 1-6.
[41] B. N. Gupta, “An Introduction to Modern Statistics,”