http://www.scirp.org/journal/cweee ISSN Online: 2168-1570
ISSN Print: 2168-1562
Application of SWAT to Assess the Effects of
Land Use Change in the Murchison Bay
Catchment in Uganda
Listowel Abugri Anaba
1, Noble Banadda
1, Nicholas Kiggundu
1, Joshua Wanyama
1, Bernie Engel
2,
Daniel Moriasi
31Department of Agricultural and Biosystems Engineering, Makerere University, Kampala, Uganda 2Department of Agricultural and Biological Engineering, Purdue University, West Lafayette, IN, USA
3USDA-ARS Grazing Lands Research Laboratory, El Reno, OK, USA
Abstract
The Soil and Water Assessment Tool (SWAT) is a versatile model presently used worldwide to evaluate water quality and hydrological concerns under varying land use and environmental conditions. In this study, SWAT was used to simulate streamflow and to estimate sediment yield and nutrients loss from the Murchison Bay catchment as a result of land use changes. The SWAT model was calibrated and validated for streamflow for extended periods. The Sequential Uncertainty Fitting (SUFI-2) global sensitivity method within SWAT Calibration and Uncertainty Pro-cedures (SWAT-CUP) was used to identify the most sensitive streamflow parame-ters. The model satisfactorily simulated stream discharge from the catchment. The model performance was determined with different statistical methods. The results showed a satisfactory model streamflow simulation performance. The results of ru-noff and average upland sediment yield estimated from the catchment showed that, both have increased over the period of study. The increasing rate of runoff can lead to severe and frequent flooding, lower water quality and reduce crop yield in the catchment. Therefore, comprehensive water management steps should be taken to reduce surface runoff in the catchment. This is the first time the SWAT model has been used in the Murchison Bay catchment. The results showed that, if all uncertain-ties are minimised, a well calibrated SWAT model can generate reasonable hydro-logic simulation results in relation to land use, which is useful to water and environ-mental resources managers and policy and decision makers.
Keywords
Land Use-Cover, Murchison Bay Catchment, SWAT, Calibration, Validation, Streamflow
How to cite this paper: Anaba, L.A., Ba-nadda, N., Kiggundu, N., Wanyama, J., En- gel, B. and Moriasi, D. (2017) Application of SWAT to Assess the Effects of Land Use Change in the Murchison Bay Catchment in Uganda. Computational Water, Energy, and Environmental Engineering, 6, 24-40.
http://dx.doi.org/10.4236/cweee.2017.61003
Received: November 1, 2016 Accepted: December 17, 2016 Published: December 20, 2016 Copyright © 2017 by authors and Scientific Research Publishing Inc. This work is licensed under the Creative Commons Attribution International License (CC BY 4.0).
http://creativecommons.org/licenses/by/4.0/
1. Introduction
Land use change can lead to undesirable effects on ecosystems [1]. Land use and land cover changes are significant causes of water, soil and air pollution [2], which negative-ly impacts the health of rivers within catchments. The effects of land use changes can be grouped into hydrologic, socio-economic, ecological and environmental [1]. Most river basins have undergone massive change over the past years due to various land use ac-tivities [3]. According to [4], land use and land cover transformations could lead to change in flow pattern of rivers due to temporal changes in the distribution of runoff.
Land use and land cover changes are very common in developing countries whose economies are mainly dependent on agriculture and with rapid human population growth [5]. Vegetation removal to prepare land for agriculture leaves soil susceptible to massive increase in soil erosion by wind and water. This reduces the fertility of the soil rendering it unsuitable for agricultural purposes, as well as transport large volumes of nitrogen, phosphorus, and sediments to streams which can lead to various negative impacts such as increased sedimentation, turbidity, eutrophication and coastal hypoxia of wetlands and rivers. The use of agrochemicals such as herbicides, pesticides, and in-organic fertilizers in modern-day agriculture has hugely contributed to increased levels of pollution in surface water bodies as well as contamination of groundwater through runoff and by way of leaching. This pollution in most cases is toxic to aquatic life [2] and humans. These impacts not only affect the immediate area but their effects can ex-tend to distant regions [3].
The Murchison Bay catchment in Uganda, which is a major contributor of water for the people in the capital city Kampala, has experienced a lot of land use-land cover transformations over the years. The change of land use from its natural vegetation has caused environmental degradation resulting from inadequate facilities for sewage and sanitation, poor drainage system, and increased industrial pollution and urban agricul-ture [6]. For instance, different studies [7]-[13] have reported the rising levels of pollu-tion and its increasing impact as a result of expansion of Kampala, wetland encroach-ment, poor agricultural practices and deforestation in parts of this catchment. Agricul-tural production in the immediate environs of Kampala has led to rapid devastation of green belts causing deforestation and has led to reduced soil water retention capacity and accelerated erosion [6]. Indiscriminate drainage of wetlands in the city environs for cultivation has also affected the water table. Drainage of wetlands has led them to lose their function to control floods, filter effluents and purification of waters before been discharged into Lake Victoria. As a result of these changes, the cost of treating water has become the major bottleneck to National Water and Sewerage Corporation (NWSC), an institution in charge of treating and supplying water to Kampala City inhabitants [8].
of different land use practices on water resources. The results of these models are used to help policy and decision makers determine cost-effective land management and conservation practices to sustain water resources for current and future populations under a changing climate [16] [17] [18]. One of such models is the Soil and Water As-sessment Tool (SWAT).
SWAT is a river basin scale and continuous time model that operates on daily time step. This model is designed to quantify and predict the impact of land management practices over long periods on water, sediment and agricultural chemical yields in large complex watersheds with varying soils, land use and management conditions [19] [20] [21]. Expanded routing and pollutant transport abilities including reservoir, point source, pond, wetland, septic tank effects and enhanced sediment routing routines have also been incorporated into the SWAT model. SWAT is a versatile model currently used worldwide to evaluate water quality and hydrological concerns in a number of va-rying watershed scales and environmental conditions [22] for abreast policy decision making and effective watershed management. Details of SWAT are in [21] [23].
Assessing the impacts of land use and land cover changes on hydrology forms the foundation for managing watershed and restoring its ecology [24]. In this study, the SWAT model was used to simulate streamflow and also to estimate the amount of se-diment yield and nutrients loss from the Murchison Bay Catchment as a result of land use-land cover changes.
2. Materials and Methods
2.1. Study Area
The Murchison Bay is an extension of Lake Victoria situated in the south-east of Kam-pala which lies between latitudes 00˚10'00"N - 00˚30'00"N and longitudes 32˚35'00'E - 32˚50'00"E with average elevation of 1224 m above sea level. The Bay which is divided into Inner and Outer Bay covers an area of about 60 km2. The Inner Murchison Bay is comparatively a semi-enclosed small water body with an area of 18.4 km2 and length of 5.6 km off the main part of Lake Victoria. The Murchison Bay watershed covers an av-erage combined catchment area of 282 km2 which consists of about 20% swamps and 80% upland [7] [10] with the largest catchment drainage inlet being the Nakivubo channel which passes through Kampala City. This study covers the largest watershed of the Murchison Bay that drains through the Nakivubo Channel (Figure 1). It covers an area of about 40.9 km2. The Nakivubo channel runs from the central populated Kam-pala district passing through slums, industrial settlements and markets before dis-charging its water to the Lake Victoria at Murchison Bay. The water in the channel is a mixture of secondary effluents from NWSC sewage treatment at Bugolobi within Kampala city and heavily polluted untreated wastewater from other parts of the city. There used to be a predominant papyrus wetland filtration system but it has been drained and turned into agricultural land or developed for commercial, industrial or residential purposes.
Figure 1. Map of Uganda showing the Murchison Bay Watershed.
mm in October with mean precipitation of about 1293 mm/year.
The soils of the Nakivubo swamp area are alluvial and lacustrine sands, silts, and clays overlying granite gneisses. Alluvial soils within the swamp range from semi-liquid organic material in the very upper layers of the emergent vegetation zones, through reddish ferruginous loams to clays [25].
2.2. Maintaining the Integrity of the Specifications
The input data used in the study included the Digital Elevation Model (DEM) of Cen-tral Uganda, land use-cover map of the Murchison Bay catchment, soil and hydro- meteorological data of the study area.
2.2.1. Digital Elevation Model (DEM)
A DEM for Central Region of Uganda at a resolution of 1 arc second (30 m × 30 m) was retrieved from the United States Geological Surveys (USGS) website
(http://gdex.cr.usgs.gov/gdex/). The DEM was used for automatic delineation of the
catchment and also to define the stream network and determine sub-basin parameters such as slope [26].
2.2.2. Land Use and Land Cover Data
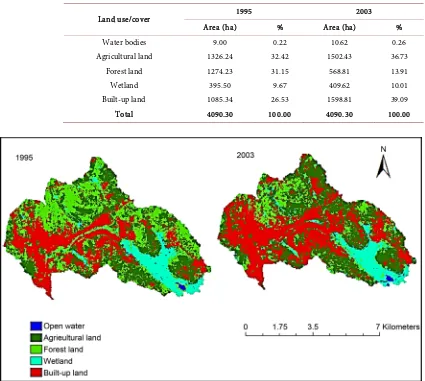
land use and land cover in the Murchison Bay catchment.
The major land use and land covers in 1995 were agricultural land (32.42%), forest-land (31.15%) and built-up forest-land (26.53%). However, by 2003, built-up forest-land became the most dominated land cover followed by agricultural land while forest land drastically declined. Figure 2 shows the various land use-land covers identified in the Murchison Bay catchment. The main cause of these changes can be attributed to rapid population growth around the catchment which increased by close to 50% between 1991 and 2002 [28]. According to [10], the rapid growth of Kampala is taking place at the expense of the environment which is highly correlated to the pollution level observed in the Lake Victoria.
2.2.3. Soil Data
[image:5.595.129.554.333.714.2]The soil map was obtained from Land and Water Resource, FAO soil database [29] and the description of the soils from [30]. The dominant soil associations in the Murchison Bay catchment are acric ferrasols, orthic ferrasols and dystrics gleysols. The soil physi-cal and chemiphysi-cal properties included were texture, soil hydrologic groups, maximum
Table 1. Characteristics of land use and land covers in the Murchison Bay catchment.
Land use/cover 1995 2003 Area (ha) % Area (ha) % Water bodies 9.00 0.22 10.62 0.26 Agricultural land 1326.24 32.42 1502.43 36.73
Forest land 1274.23 31.15 568.81 13.91 Wetland 395.50 9.67 409.62 10.01 Built-up land 1085.34 26.53 1598.81 39.09 Total 4090.30 100.00 4090.30 100.00
rooting depth, fraction of porosity, moist bulk density, available water capacity, satu-rated hydraulic conductivity, organic carbon content, electrical conductivity, USLE eq-uation soil erodibility factor, sand, silt and rock fragment contents.
2.2.4. Hydro-Meteorological Data
Hydrological simulation with the SWAT model requires weather data consisting of precipitation, maximum and minimum temperature, relative humidity, solar radiation and wind speed. These parameters were obtained from the National Centres for Envi-ronmental Prediction (NCEP) (http://globalweather.tamu.edu/) and NASA agro-cli- matology (http://power.larc.nasa.gov/cgi-bin/cgiwrap/solar/agro.cgi) for the period of 1995 to 2010. The weather data was collected from three stations outside and one sta-tion within the study area. Stream discharge data was obtained from the Directorate of Water Resource Management (DWRM) under Uganda’s Ministry of Water and Envi-ronment (MWE) at Entebbe. There is only one stream flow gauge in the Murchison Bay catchment located at the Railway Bridge culvert which is very close to the outlet of the delineated catchment at 32.63˚E and 0.30˚N. The observed stream flow data for the pe-riod from 1997 to 2007 was used for calibration and validation of the model, however, there were data gaps.
2.3. The SWAT Model Setup
The model uses readily available input data such as Digital Elevation Model (DEM), land use data, soil data and climatic data as described in Section 2.2. In this study, modelling of the hydrological process was carried out using the extension of SWAT for ArcGIS software called ArcSWAT [31].
ArcSWATv2012.10.1.18 was downloaded from the website for the model
(http://swat.tamu.edu/software/arcswat/) and installed in ArcGISv10.1. In the model
setup, the first step was to delineate the catchment using the DEM into several con-nected sub-basins. The sub-basins were further divided into smaller units called hydro-logic response units (HRUs). HRUs are lumped land areas within the sub-basin that are comprised of unique land cover, soil, slope and management combinations [21]. A total of 23 sub-basins and 247 HRUs were created. The HRUs were created by defining the thresholds of land use over sub-basin area at 5%, soil class over land use area at 5% and slope class over soil area at 5% using the multiple HRUs definition. The model was run on daily time step for a period of 16 years from 1995 to 2010 with a warm up period of two years.
2.4. Sensitivity Analysis
Table 2. Sensitivity analysis parameters.
Parameters Definition ALPHA_BF Base-flow alpha factor (days)
ALPHA_BNK Base-flow alpha factor for bank storage (dimensionless) CH_K2 Effective hydraulic conductivity in main channel alluvium (mm/h) CH_N2 Manning’s “n” value for the main channel
CN2 SCS runoff curve number (dimensionless) ESCO Soil evaporation compensation factor (dimensionless) GW_DELAY Groundwater delay (days)
GW_REVAP Groundwater “revap” coefficient (dimensionless)
GWQMN Threshold depth of water in the shallow aquifer required for return flow to occur (mm) RCHRG_DP Deep aquifer percolation fraction (dimensionless)
REVAPMN Threshold depth of water in the shallow aquifer for “revap” to occur (mm) SOL_AWC Available water capacity of the soil layer (mm H2O/mm soil)
SOL_BD Moist bulk density (Mg/m3)
SOL_K Saturated hydraulic conductivity (mm/h) SOL_Z Depth of soil (mm)
SURLAG Surface runoff lag coefficient (dimensionless)
flow parameters that were tested for their sensitivity. These are useful in estimating the amount of flow from a catchment [37].
2.5. Calibration and Validation of the Model
Calibration was accomplished by comparing the output of the SWAT model with the observed data at the same conditions [19] [38]. For calibration and validation, the semi-automated Sequential Uncertainty Fitting (SUFI-2) calibration method within the SWAT Calibration and Uncertainty Procedures (SWAT-CUP) was used. SWAT-CUP version 5.1.6.2 was used. SWAT-CUP [16] is a stand-alone calibration program devel-oped for SWAT that operates on Latin Hypercupe sampling procedures. Due to lack of observed data for sediment and nutrients, the model was calibrated and validated only for streamflow. The model was calibrated with observed daily discharge data for the pe-riod of 1997 to 2002 and validated for the pepe-riod of 2004 to 2008 since there was no observed data for 2003. Though, there were gaps in the observed data, the challenge was addressed by writing it in a format suggested by [36] that SWAT-CUP tool can read.
2.6. Evaluation of Model Performance
used to determine NSE, PBIAS, RSR and R2, respectively. Other details of these meas-ures such as their utility and satisfactory range of values are explained by Moriasi et al. [40].
(
)
(
)
2 1 2 1 1 n i i i n i i O S NSE O O = = − = − −∑
∑
(1)(
)
( )
1 1 100 n i i i n i i O S PBIAS O = = − ∗ =∑
∑
(2)(
)
(
)
2 1 2 1 n i i i n i i O S RSR O O = = − = −∑
∑
(3)(
)(
)
(
)
(
)
2 1 2 2 2 1 1 n i i i n n i i i iO O S S
R
O O S S
= = = − − = − ∗ −
∑
∑
∑
(4)where Oi is the observed daily discharge, Si is the simulated daily discharge, O is the average measured discharge, S is the average simulated discharge and n is the num-ber of observations.
3. Results and Discussion
3.1. Sensitivity Analysis of Stream Flow Parameters Results
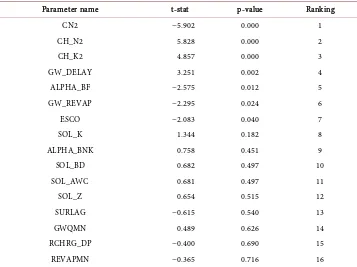
The global sensitivity analysis of 16 flow parameters (Table 2) showed that, only seven were very sensitive to flow. The rankings of the flow parameters are presented in Table 3 while the fitted values for the most sensitive parameters are indicated in Table 4. The most sensitive parameter was the SCS runoff curve number (CN2). The curve number estimates runoff based on the relationship between precipitation, hydrologic soil group and land uses. Other researchers [41] [42] [43] [44] have also found the SCS curve number to be the most sensitive streamflow parameter in modelling hydrology in their studies. The other sensitive parameters included the Manning’s n value for the main channel (CH_N2), effective hydraulic conductivity in the main channel alluvium (CH_K2) and groundwater delay time (GW_DELAY), baseflow alpha factor (ALPHA_BF), groundwater “revap” coefficient and the soil evaporation compensation factor (ESCO). Although, the rest of the parameters were found not to be sensitive to flow in the cat-chment as their p-values were greater than 5%, other studies [37] [39] [45] [46] [47] have found some of them to be sensitive in their studies. This is expected as conditions such as land use and land covers, soil characteristics and climatic factors vary from one catchment to the other.
3.2. SWAT Model Calibration and Validation Results
Table 3. Sensitivity rankings of streamflow parameters in the Murchison Bay catchment.
Parameter name t-stat p-value Ranking CN2 −5.902 0.000 1 CH_N2 5.828 0.000 2 CH_K2 4.857 0.000 3 GW_DELAY 3.251 0.002 4 ALPHA_BF −2.575 0.012 5 GW_REVAP −2.295 0.024 6 ESCO −2.083 0.040 7 SOL_K 1.344 0.182 8 ALPHA_BNK 0.758 0.451 9 SOL_BD 0.682 0.497 10 SOL_AWC 0.681 0.497 11 SOL_Z 0.654 0.515 12 SURLAG −0.615 0.540 13 GWQMN 0.489 0.626 14 RCHRG_DP −0.400 0.690 15 REVAPMN −0.365 0.716 16
Table 4. List of sensitive parameters and their calibrated values.
Parameter name Fitted value Minimum Maximum r__CN2.mgt 0.02 35 98 v__CH_N2.rte 0.12 −0.01 0.5 v__CH_K2.rte 165 −0.01 500 v__GW_DELAY.gw 75.11 0 500 v__ALPHA_BF.gw 0.57 0 1 v__GW_REVAP.gw 0.11 0.02 0.2
v__ESCO.hru 1 0 1
The extension (e.g., .mgt, .rte) refers to the SWAT input file where the parameter occurs. The qualifier (r__) re-fers to relative change in the parameter where the value from the SWAT database is multiplied by 1 plus a factor in the given range, while the qualifier (v__) refers to the substitution of a parameter by a value from the given range.
[image:9.595.195.553.388.514.2]Figure 3. Observed and simulated daily discharge for the Murchison Bay catchment during calibration (1997-2002).
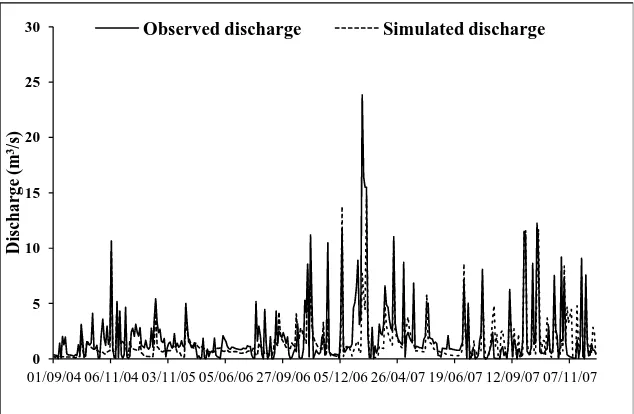
Figure 4. Observed and simulated daily discharge for the Murchison Bay catchment during the validation period (2004-2007).
Figure 5. Scatter plot of observed and simulated discharge for the calibration period (1997-2002).
0 2 4 6 8 10 12 14
09/10/97 06/05/98 03/11/98 11/06/99 08/11/99 06/04/00 13/07/01 10/12/01 07/10/02
D
isch
a
rg
e (
m
3/s)
Observed discharge Simulated discharge
0 5 10 15 20 25 30
01/09/04 06/11/04 03/11/05 05/06/06 27/09/06 05/12/06 26/04/07 19/06/07 12/09/07 07/11/07
D
is
ch
a
rg
e (
m
3/s
)
Observed discharge Simulated discharge
y = 1.167x - 0.249 R² = 0.759
0 2 4 6 8 10 12 14 16
0 2 4 6 8 10 12 14
O
bs
er
ved
d
isc
ha
rge
(m
3/s)
[image:10.595.230.517.552.702.2]Figure 6. Scatter plot of observed and simulated discharge for the validation period (2004-2007).
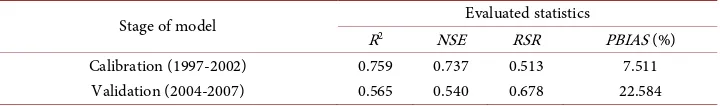
Table 5. Daily time step SWAT calibration and validation statistics.
Stage of model R2 NSE Evaluated statistics RSR PBIAS (%) Calibration (1997-2002) 0.759 0.737 0.513 7.511 Validation (2004-2007) 0.565 0.540 0.678 22.584
used as there were many missing days. The results also showed that, the model slightly underestimated flow during both the calibration and validation period as indicated by PBIAS values of approximately 8% and 23%, respectively. According to Moriasi et al. [40], a PBIAS greater than zero is an indication that the model underestimated flow. During the calibration period (1997 to 2002), the observed and simulated mean daily flows were 3.1 m3/s and 2.91 m3/s, respectively, while during the validation stage (2004- 2007), the observed and simulated mean daily flows were 1.94 m3/s and 1.50 m3/s, re-spectively.
Also, the underestimations could be attributed to uncertainties that exist in the catchment such as the wetland processes, quality of input data and wastewater dis- charge from point sources which could not be accounted for during the simulation. These plausible reasons including the limitations of using the SCS curve number (CN2) to compute estimate water budget componentshave also been noted by Abbaspour et al. [32] [48] and Betrie et al. [37] to be the cause of over and under prediction of flow. This observation agrees with that of Mutenyo et al. [43] and Qiu et al. [47] who recorded an underestimated streamflow discharge by the SWAT model. However, Qiu et al. [47] suggested that underestimation or overestimation [37] of streamflow discharge by the SWAT model is partly due to the use of curve number,which cannot give accurate pre- diction of runoff for days with several storms. Mutenyo et al. [43] attributed inaccurate simulation of streamflow discharge by the SWAT model to insufficient rain data. It is obvious that, if all these uncertainties are minimised, a well calibrated SWAT model can efficiently predict flow in the catchment for any management purpose.
3.3. Impact of Land Use and Cover Change in the Murchison Bay
Catchment
To evaluate the effects of land use and cover change, the SWAT model calibrated and
y = 1.0232x + 0.4028 R² = 0.5645
0 5 10 15 20 25 30
0 2 4 6 8 10 12 14 16
O
b
serv
ed
d
isch
a
rg
e (
m
3/s)
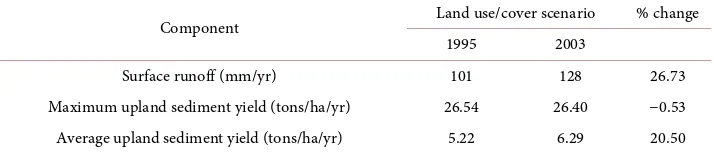
[image:11.595.194.554.284.337.2]validated for streamflow discharge was used to simulate different land use and cover scenarios on runoff and sediment yield. Land use covers at two different years thus 1995 and 2003 were used as input variables in the SWAT model in order to compare output as a result of their differences in land covers. The simulated results of surface runoff and sediment yield in the catchment of the Murchison Bay under different land use and land cover scenarios using the SWAT model are shown in Table 6. The results showed an increase in runoff and average upland sediment yield, from the catchment except maximum upland sediment yield which reduced very slightly between the two periods. Surface runoff increased from 101 mm/yr in 1995 to 128 mm/yr in 2003 representing 26.7%. This is attributed to the drastic land cover changes that occurred in the catchment. It highlights the effect of changes in land use and cover on hydrology in the catchment. Within the period, there was a sharp decline of forestland from 31.15% in 1995 to 13.91% while built-up land shot from 26.53% to 39.09%.
The observation agrees with the assertion by Nie et al. [24] and Tang et al. [49] that, an increase in urban set-up increases impervious surfaces and declining forest lands, which accelerates surface runoff. Similarly, [50] reported that an increase in annual surface runoff increased when forest lands were converted to urban areas and decreased during when forestland gained a significant expansion. Maalim et al. [51] also made similar observation, areas dominated by urban development has higher runoff and lower runoff in forested areas. On the other hand, different studies [14] [44] [52] have reported that an expansion in forestland and grasslands lead to a decrease in runoff. Although, there is general agreement among researchers that changes in streamflow is due to different types of forestry activities, such as afforestation that may lead to lower runoff generation, others suggest the amount of precipitation [44] [52] and climate change [53] partly play a role. The increase in built-up land within the period might have possibly created impervious layers which reduced infiltration and percolation of water to the shallow aquifers that caused surface runoff to increase. According to Diyer et al. [54], when industrial or urban development takes place, the new land use changes how water is transported and stored. The combination of constraints connected to compacted lands and impervious surfaces such as parking lots, roads, sidewalks, and roofs leads to reduced infiltration. This causes, for instance, reduced water quality, increased volume and velocity of runoff, increased occurrence and severity of floods, and loss of storage capacity and runoff water in natural vegetation.
[image:12.595.197.554.657.734.2]Surface Rrunoff is the carrier of all other components such as sediment, nutrient, pesticides, bacteria, agricultural waste, heavy metals, industrial solid and liquid waste that undesirably affects water quality. As surface runoff increases, it is evident that all the aforementioned components will correspondingly increase depending on the activities
Table 6. Estimated runoff and sediment under different land use and covers.
Component Land use/cover scenario % change 1995 2003
taking place in the catchment. However, the simulated results showed there was not much change in upland sediment yield over the period with increasing runoff. Upland sediment yield rather reduced by at least 0.50% between the two periods. This could still be attributed to the dynamics of land cover that happened at that time. Nevertheless, average upland sediment yield was about 20.50% higher in 2003 than that of 1995. This means that, some sub-basins within the catchment might have been exposed to massive degradation such as construction works and intensive agricultural activities than other sub-basins which resulted in higher sediment yield as runoff increased.
At a rate of 26.54 tons/ha/yr and 26.40 tons/ha/yr which translates to about 108,557 tons/yr and 107,984 tons/yr respectively, the sediment yield estimated in the catchment is greater than the results reported by Kimwaga et al. [55]. In the Simiyu catchment of the Lake Victoria basin, which is much larger than the Murchison Bay catchment, [55] reported a modelled estimate of sediment yield of 98,467 tons/yr though the actual measured sediment yield was 2,075,144 tons/yr. The discrepancy was attributed to the data used to run the model.
The average estimates of sediment yield from upland and runoff from the landscape as well as possible mass loadings from point sources in the Murchison Bay catchment is a clear indication of the deterioration level of water quality that ends up into the Lake Victoria. This is supported by [10] situation analysis report that increasing human population and all their associated economic and social activities have accelerated the rate of delivery of nutrients and caused eutrophication in Lake Victoria. However, it is anticipated that the values of the components estimated have changed tremendously as the catchment is now condensed with more settlements, industries and increased in population of Kampala city from 1.2 million in 2002 to 1.5 million in 2014 [28].
4. Conclusion and Recommendation
Acknowledgements
The authors wish to thank the METEGA Project and RUFORUM for their financial support.
References
[1] Ndulue, E.L., Mbajiorgu, C.C., Ugwu, S.N., Ogwo, V. and Ogbu, K.N. (2015) Assessment of Land Use/Cover Impacts on Runoff and Sediment Yield Using Hydrologic Models : A Re-view. Journal of Ecology and the Natural Environment, 7, 46-55.
https://doi.org/10.5897/JENE2014.0482
[2] Ellis, E. (2013) Land-Use and Land-Cover Change. In: Pontius, R., Eds., The Encyclopedia of Earth.
[3] Ayivor, J.S. and Gordon, C. (2012) Impact of Land Use on River Systems in Ghana. West African Journal of Applied Ecology, 20, 83-95.
[4] Kashaigili, J.J. (2008) Impacts of Land-Use and Land-Cover Changes on Flow Regimes of the Usangu Wetland and the Great Ruaha River, Tanzania. Physics and Chemistry of the Earth, 33, 640-647. https://doi.org/10.1016/j.pce.2008.06.014
[5] Tufa, D.F., Abbulu, Y. and Srinivasarao, G.V.R. (2014) Watershed Hydrological Response to Changes in Land Use/Land Covers Patterns of River Basin : A Review. International Journal of Civil, Structural, Environmental and Infrastructure Engineering Research and Development (IJCSEIERD), 4, 157-170.
[6] Matagi, S.V. (2002) Some Issues of Environmental Concern in Kampala, the Capital City of Uganda. Environmental Monitoring and Assessment, 77, 121-138.
https://doi.org/10.1023/A:1015860820467
[7] Akurut, M., Willems, P. and Niwagaba, C.B. (2014) Assessing the Influence of Lake Victoria Flux on the Inner Murchison Bay Water Quality. WIT Transactions on Ecology and the Environment, 182, 51-62. https://doi.org/10.2495/WP140051
[8] Banadda, E.N., Kansiime, F., Kigobe, M., Kizza, M. and Nhapi, I. (2009) Land Use-Based Nonpoint Source Pollution: A Threat to Water Quality in Murchison Bay, Uganda. Water Policy, 11, 94-105. https://doi.org/10.2166/wp.2009.106
[9] Haande, S., Rohrlack, T., Semyalo, R.P., Brettum, P., Edvardsen, B., Lyche-Solheim, A., Sørensen, K. and Larsson, P. (2011) Phytoplankton Dynamics and Cyanobacterial Domin-ance in Murchison Bay of Lake Victoria (Uganda) in Relation to Environmental Condi-tions. Limnologica-Ecology and Management of Inland Waters, 41, 20-29.
https://doi.org/10.1016/j.limno.2010.04.001
[10] JTR (2015) Development of a Pollution Management Strategy to Improve Long Term Wa-ter Quality Status in the Inner Murchison Bay, Lake Victoria & Initiate Implementation of Its Initiatives. Joint Technical Review Situation Analysis Report, 1-22.
[11] Mbabazi, J., Kwetegyeka, J., Ntale, M. and Wasswa, J. (2010) Ineffectiveness of Nakivubo Wetland in Filtering Out Heavy Metals from Untreated Kampala Urban Effluent Prior to Discharge into Lake Victoria, Uganda. African Journal of Agricultural Research, 5, 3431- 3439.
[12] MWE (2013) Framework and Guidelines for Water Source Protection. Framework for Wa-ter Source Protection, Ministry of WaWa-ter and Environment, Vol. 1, 1-75.
[13] Pandav, B., Choudhury, B.C. and Patnaik, S.K. (2002) Information Sheet on Ramsar Wet-lands—Bhitarkanika Mangroves. Ramsar, 1-8.
[15] Ahmad, H., Jamieson, R., Havard, P., Madani, A. and Zaman, Q. (2009) Evaluation of SWAT for a Small Watershed in Eastern Canada. 337-343.
[16] Abbaspour, K.C., Vejdani, M., Haghighat, S. and Yang, J. (2007) SWAT-CUP Calibration and Uncertainty Programs for SWAT. In: Oxley, L. and Kulasiri, D. Eds., MODSIM 2007 International Congress on Modelling and Simulation,Modelling and Simulation Society of Australia and New Zealand, 1596-1602.
[17] Moriasi, D.N., et al. (2015) Hydrologic and Water Quality Models: Key Calibration and Va-lidation Topics. Transactions of the ASABE, 58, 1609-1618.
https://doi.org/10.13031/trans.58.11075
[18] Van Liew, M.W., Arnold, J.G. and Bosch, D.D. (2005) Problems and Potential of Autocali-brating a Hydrologic Model. Transactions of the ASABE, 48, 1025-1040.
[19] Arnold, J.G., et al. (2012) SWAT: Model Use, Calibration, and Validation. American Socie-ty of Agricultural and Biological Engineer, 55, 1491-1508.
[20] Gassman, P.W., Reyes, M.R., Green, C.H. and Arnold, J.G. (2007) The Soil and Water As-sessment Tool: Historical Development, Applications, and Future Research Direction. American Society of Agricultural and Biological Engineers, 50, 1211-1250.
[21] Neitsch, S.L., Arnold, J.G., Kiniry, J.R. and Williams, J.R. (2011) Soil & Water Assessment Tool Theoretical Documentation Version 2009. Technical Report, Texas Water Resources Institute, College Station, 1-647.
[22] Gassman, P.W. and Yingkuan, W. (2015) IJABE SWAT Special Issue : Innovative Modeling Solutions for Water Resource Problems. International Journal of Agricultural and Biologi-cal Engineering, 8, 1-8.
[23] Arnold, J.G., Kiniry, J.R., Srinivasan, R., Williams, J.R., Haney, E.B. and Neitsch, S.L. (2012) Soil & Water Assessment Tool: Input/Output Documentation. Version 2012. TR-439, Texas Water Resources Institute, College Station, 1-650.
[24] Nie, W., Yuan, Y., Kepner, W., Nash, M.S., Jackson, M. and Erickson, C. (2011) Assessing Impacts of Landuse and Landcover Changes on Hydrology for the Upper San Pedro Wa-tershed. Journal of Hydrology, 407, 105-114. https://doi.org/10.1016/j.jhydrol.2011.07.012
[25] Kansiime, F. and Nalubega, M. (1999) Wastewater Treatment by a Natural Wetland: The Nakivubo Swamp, Uganda. PhD Thesis, Wageningen Agricultural University, Netheriand. [26] Ghoraba, S.M. (2015) Hydrological Modeling of the Simly Dam Watershed (Pakistan)
Us-ing GIS and SWAT Model. Alexandria Engineering Journal, 54, 583-594.
https://doi.org/10.1016/j.aej.2015.05.018
[27] Anderson, J.R., Hardy, E.E., Roach, J.T. and Witmer, R.E. (1976) A Land Use and Land Cover Classification System for Use with Remote Sensor Data. A Revision of the Land Use Classification System as Presented in US Geological Survey Circular 671, 1-41.
[28] UBOS (2014) National Population and Housing Census. Uganda Bureau of Statistics, Kampala, 1-73.
[29] FAO-UNESCO (2003) The Digital Soil Map of the World, Version 3.6. Land and Water Development Division, FAO, Rome.
[30] FAO-UNESCO (1977) FAO-UNESCO Soil Map of the World, 1:5000000: Africa. United Nations Educational, Scientific and Cultural Organization, Paris, 346.
[31] Winchell, M., Srinivasan, R., Di Luzio, M. and Arnold, J.G. (2013) Arcswat Interface for SWAT2012: User’s Guide. Blackland Research Center, Texas AgriLife Research, College Station, 1-464.
[32] Abbaspour, K.C., et al. (2007) Modelling Hydrology and Water Quality in the Pre-Al- pine/Alpine Thur Watershed Using SWAT. Journal of Hydrology, 333, 413-430.
[33] Das, S.K., Ng, A.W.M. and Perera, B.J.C. (2013) Sensitivity Analysis of SWAT Model in the Yarra River Catchment. 20th International Congress on Modelling and Simulation, Ade-laide, 1-6 December 2013, 1666-1672.
[34] Neitsch, S.L., Arnold, J.G., Kiniry, J.R., Srinivasan, R. and Williams, J.R. (2002) Soil and Water Assessment Tool User’s Manual, Version 2000. Texas TWRI Report TR-192, Texas Water Resources Institute, College Station, 1-412.
[35] Van Griensven, A., Meixner, T., Grunwald, S., Bishop, T., Diluzio, M. and Srinivasan, R. (2006) A Global Sensitivity Analysis Tool for the Parameters of Multi-Variable Catchment Models. Journal of Hydrology, 324, 10-23. https://doi.org/10.1016/j.jhydrol.2005.09.008
[36] Abbaspour, K.C. (2015) SWAT-Calibration and Uncertainty Programs (CUP)—A User Manual. Swiss Federal Institute of Aquatic Science and Technology, Eawag, Duebendorf, 1- 100.
[37] Betrie, G.D., Mohamed, Y.A., Griensven, A. and Srinivasan, R. (2011) Sediment Manage-ment Modelling in the Blue Nile Basin Using SWAT Model. Hydrology and Earth System Sciences, 15, 807-818. https://doi.org/10.5194/hess-15-807-2011
[38] Engel, B., Storm, D., White, M., Arnold, J. and Arabi, M. (2007) A Hydrologic/Water Qual-ity Model Application Protocol. Journal of the American Water Resources Association, 43, 1223-1236. https://doi.org/10.1111/j.1752-1688.2007.00105.x
[39] Costa, D., Avelino, R., Sára, S., Thomazini, L., Aurélio, M. and Caiado, C. (2015) Applica-tion of the SWAT Hydrologic Model to a Tropical Watershed at Brazil. Catena, 125, 206- 213. https://doi.org/10.1016/j.catena.2014.10.032
[40] Moriasi, D.N., Arnold, J.G., van Liew, M.W., Binger, R.L., Harmel, R.D. and Veith, T.L. (2007) Model Evaluation Guidelines for Systematic Quantification of Accuracy in Wa-tershed Simulations. Transactions of the ASABE, 50, 885-900.
https://doi.org/10.13031/2013.23153
[41] Getachew, H.E. and Melesse, A.M. (2012) The Impact of Land Use Change on the Hydrol-ogy of the Angereb Watershed, Ethiopia. International Journal of Water Sciences, 1, 1-7. [42] Gyamfi, C., Ndambuki, J.M. and Salim, R.W. (2016) Application of SWAT Model to the
Olifants Basin : Calibration, Validation and Uncertainty Analysis. Journal of Water Re-source and Protection, 8, 397-410. https://doi.org/10.4236/jwarp.2016.83033
[43] Mutenyo, I., Nejadhashemi, A.P., Woznicki, S.A. and Giri, S. (2013) Evaluation of SWAT Performance on a Mountainous Watershed in Tropical Africa. Hydrology Current Re-search, S14, 1-7.
[44] Zuo, D., Xu, Z., Yao, W., Jin, S., Xiao, P. and Ran, D. (2016) Assessing the Effects of Changes in Land Use and Climate on Runoff and Sediment Yields from a Watershed in the Loess Plateau of China. Science of the Total Environment, 544, 238-250.
https://doi.org/10.1016/j.scitotenv.2015.11.060
[45] Asres, M.T. and Awulachew, S.B. (2011) SWAT Based Runoff and Sediment Yield Model-ling: A Case Study of the Gumera Watershed in the Blue Nile Basin. Ecohydrology and Hy-drobiology, 10, 191-200. https://doi.org/10.2478/v10104-011-0020-9
[46] Gamvroudis, C., Nikolaidis, N.P., Tzoraki, O., Papadoulakis, V. and Karalemas, N. (2015) Water and Sediment Transport Modeling of a Large Temporary River Basin in Greece. Science of the Total Environment, 508, 354-365.
https://doi.org/10.1016/j.scitotenv.2014.12.005
[47] Qiu, L.J., Zheng, F.L. and Yin, R.S. (2012) SWAT-Based Runoff and Sediment Simulation in a Small Watershed, the Loessial Hilly-Gullied Region of China: Capabilities and Challenges. International Journal of Sediment Research, 27, 226-234.
https://doi.org/10.1016/S1001-6279(12)60030-4
(2015) A Continental-Scale Hydrology and Water Quality Model for Europe: Calibration and Uncertainty of a High-Resolution Large-Scale SWAT Model. Journal of Hydrology, 524, 733-752. https://doi.org/10.1016/j.jhydrol.2015.03.027
[49] Tang, Z., Engel, B.A., Pijanowski, B.C. and Lim, K.J. (2005) Forecasting Land Use Change and Its Environmental Impact at a Watershed Scale. Journal of Environmental Manage-ment, 76, 35-45. https://doi.org/10.1016/j.jenvman.2005.01.006
[50] Ngo, T.S., Nguyen, D.B. and Rajendra, P.S. (2015) Effect of Land Use Change on Runoff and Sediment Yield in Da River Basin of Hoa Binh Province, Northwest Vietnam. Journal of Mountain Science, 12, 1051-1064. https://doi.org/10.1007/s11629-013-2925-9
[51] Maalim, F.K., Melesse, A.M., Belmont, P. and Gran, K.B. (2013) Modeling the Impact of Land Use Changes on Runoff and Sediment Yield in the Le Sueur Watershed, Minnesota Using GeoWEPP. Catena, 107, 35-45. https://doi.org/10.1016/j.catena.2013.03.004
[52] Silveira, L. and Alonso, J. (2008) Runoff Modifications Due to the Conversion of Natural Grasslands to Forests in a Large Basin in Uruguay. Hydrological Processes, 23, 320-329.
https://doi.org/10.1002/hyp.7156
[53] Yan, B., Fang, N.F., Zhang, P.C. and Shi, Z.H. (2013) Impacts of Land Use Change on Wa-tershed Streamflow and Sediment Yield: An Assessment Using Hydrologic Modelling and Partial Least Squares Regression. Journal of Hydrology, 484, 26-37.
https://doi.org/10.1016/j.jhydrol.2013.01.008
[54] Diyer, M., Namrani, H. and Elkadiri, A. (2013) Land Use and Land Management Practices in Environmental Perspective. 1-81.
[55] Kimwaga, R.J., Bukirwa, F., Banadda, N., Wali, U.G., Nhapi, I. and Mashauri, D.A. (2012) Modelling the Impact of Land Use Changes on Sediment Loading into Lake Victoria Using SWAT Model : A Case of Simiyu Catchment Tanzania. The Open Environmental Engi-neering Journal, 5, 66-76. https://doi.org/10.2174/1874829501205010066
Submit or recommend next manuscript to SCIRP and we will provide best service for you:
Accepting pre-submission inquiries through Email, Facebook, LinkedIn, Twitter, etc. A wide selection of journals (inclusive of 9 subjects, more than 200 journals)
Providing 24-hour high-quality service User-friendly online submission system Fair and swift peer-review system
Efficient typesetting and proofreading procedure
Display of the result of downloads and visits, as well as the number of cited articles Maximum dissemination of your research work