Munich Personal RePEc Archive
A proxy approach to dealing with the
infeasibility problem in super-efficiency
data envelopment analysis
Cheng, Gang and Zervopoulos, Panagiotis
June 2012
Online at
https://mpra.ub.uni-muenchen.de/42064/
A proxy approach to dealing with the infeasibility problem in super-efficiency
data envelopment analysis
Gang Cheng
China Center for Health Development Studies, Peking University,
38 Xueyuan Rd, Beijing, China
Panagiotis D. Zervopoulos
China Center for Health Development Studies, Peking University,
38 Xueyuan Rd, Beijing, China
Department of Business Administration of Food and Agricultural Enterprises
University of Ioannina, 2 Georgiou Seferi St, Agrinio, Greece
Abstract
Super-efficiency data envelopment analysis (SE-DEA) models are expressions of the
traditional DEA models featuring the exclusion of the unit under evaluation from the
reference set. The SE-DEA models have been applied in various cases such as sensitivity and
stability analysis, measurement of productivity changes,outliers’ identification,and
classification and ranking of decision making units (DMUs). A major deficiency in the
SE-DEA models is their infeasibility in determining super-efficiency scores for some efficient
DMUs when variable, non-increasing and non-decreasing returns to scale (VRS, NIRS,
NDRS) prevail. The scope of this study is the development of an oriented proxy approach for
SE-DEA models in order to tackle the infeasibility problem. The proxy introduced to the
SE-DEA models replaces the original infeasible DMU in the sample and guarantees a feasible
models to the feasible DMUs.
Keywords: Data envelopment analysis (DEA); Super-efficiency (SE); Infeasibility;
1. Introduction
Data Envelopment Analysis (DEA) is a comparative efficiency measurement methodology put
forth by Charnes et al. (1978) that serves as a quantitative benchmarking technique. DEA draws on
linear programming for distinguishing the relatively efficient from the inefficient operational units
of a particular sample. Nevertheless, the distinction between efficient and inefficient units is not the
only present as there are further dissimilarities in the production process of the efficient units.
These dissimilarities are not detected by traditional DEA models.
Super-efficiency DEA (SE-DEA) models, initially developed by Banker et al. (1989), and
Andersen and Petersen (1993), are appropriate for identifying premium efficiency among efficient
units and ranking efficient DMUs. In the SE-DEA, the unit under evaluation is excluded from the
reference set, so that its efficiency may be greater than 100%.
A major drawback of the SE-DEA models is their infeasibility in defining super-efficiency scores
for some efficient DMUs under VRS technology. Several scholars (Dula & Hickman, 1997; Seiford
& Zhu, 1999; Xue & Harker, 2002) discussed the conditions for infeasibility in SE-DEA models
under VRS. Dula and Hickman (1997) and Seiford and Zhu (1999) proved the necessary and
sufficient conditions for infeasibility in the VRS SE-DEA model. Taking into account these
conditions, a number of methods have been developed to solve the infeasibility problem(Chen et al.,
2011; Chen, 2005; Cook et al., 2009; Lee et al., 2011; Lovell & Rouse, 2003; Ray, 2008).
In this paper, we propose a new proxy approach which successfully overcomes the infeasibility
problem. The novelty of the new approach is that it completely holds the original orientation of the
SE-DEA model (input-orientation or output-orientation) by identifying a virtual proxy unit in the
frontier. The proxy unit is located at the nearest point to the original infeasible efficient unit and it
has a feasible super-efficiency score.
The paper is organized as follows. Section 2 describes the infeasibility problem in input- and
output-oriented models. Section 3 presents existing VRS super-efficiency models and discusses
both the procedure applied for overcoming the infeasibility problem and the appropriateness of the
results of these models, in order to provide a basis for comparison between the existing models and
compares alternative approaches for tackling the infeasibility problem through a numerical
example. The numerical example is based on a real-world dataset found in Bal et al. (2010).
Conclusions are presented in the final section of the paper.
2. Infeasibility problem for SE-VRS model
2.1 Infeasibility for input-oriented SE-VRS model
The input-oriented VRS model for the evaluated DMUk can be formulated as (Banker et al., 1984):
m in
1
s.t. , 1, 2, ...,
n
j ij ik j
x x i m
1
, 1, 2, ...,
n
j rj rk j
y y r s
1 1 n j j
j 0 , j1, 2 , ...,n
(1)
For an efficient DMUk, the SE-VRS model becomes (Andersen & Petersen, 1993):
m in
1
s.t. , 1, 2 , ...,
n
j ij ik j
j k
x x i m
1, 1, 2 , ...,
n
j rj rk j
j k
y y r s
1 1 n j j j k
j 0 , j 1, 2 , ...,n (j k)
The necessary and sufficient condition for infeasibility in the input-oriented VRS SE-DEA is that
the evaluated DMU has at least one output greater than the convex combination formed by all the
other DMUs. In such a condition, the efficient DMUk cannot reach the frontier formed by the
remaining DMUs because the constraint for outputs in (2) is infeasible, i.e.
1
n
j rj rk j j k y y
is infeasible.A sufficient condition for infeasibility in the input-oriented VRS SE-DEA is that the evaluated
DMU has at least one output greater than the corresponding output for all the other DMUs.
2.2 Infeasibility for output-oriented SE-VRS model
The output-oriented VRS model can be formulated as:
m ax
1
. . , 1, 2, ...,
n
j ij ik j
s t x x i m
1
, 1, 2, ...,
n
j rj rk j
y y r s
1 1 n j j
j 0 , j1, 2 , ...,n
(3)
For an efficient DMUk, the SE-VRS model is:
m ax
1
. . , 1, 2 , ...,
n
j ij ik j
j k
s t x x i m
1
, 1, 2 , ...,
n
j rj rk j
j k
y y r s
1
1
n j j j k
j 0 , j1, 2 , ...,n (j k)
(4)
The necessary and sufficient condition for infeasibility in the output-oriented VRS SE-DEA is that
the evaluated DMU has at least one input less than the convex combination formed by all the other
DMUs. In such a condition, the efficient DMUk cannot reach the frontier formed by the rest of the
DMUs because the constraint for inputs in (4) is infeasible, i.e.
1
n
j ij ik j
j k
x x
is infeasible.A sufficient condition for infeasibility in the output-oriented VRS SE-DEA is that the evaluated
DMU has at least one input less than the corresponding input for all the other DMUs.
3. Modified SE-DEA models dealing with infeasibility
Lovell and Rouse (2003) proposed an oriented method for tackling the infeasibility problem of
traditional SE-DEA models. This method draws on a scaling procedure applied either to the inputs
(input orientation) or the outputs (output orientation) of the efficient units for which the calculation
of a super-efficiency score, based on traditional SE-DEA models, is infeasible. For the scaling
procedure, an arbitrarily selected factor that is sufficiently large (input orientation), or a sufficiently
small factor (output orientation) is utilized. The scaling procedure removes the unit from the
reference set to avoid any infeasibility problem. The super-efficiency score of the modified unit is
calculated after rescaling the assigned score.
The method introduced by Lovell and Rouse (2003) copes with the infeasibility problem. However,
concerns are raised about the desirability of the results of this method and the role of exogenous
intervention to the procedure (Chen et al., 2011; Cook et al., 2009; Ray, 2008). To be more precise,
the super-efficiency scores of the efficient DMUs with infeasible solutions are identical to the
scaling factor. Therefore, these particular results should not be interpreted while the target levels
for inputs and outputs are fictitious. The results obtained solely reflect an arbitrary choice of the
infeasible DMUs are assigned equal super-efficiency scores.
Chen (2005)’s model relies on the substitution of the inefficient units with their efficient
projections, under the assumption of variable returns to scale (VRS). Chen argues that infeasibility
is eliminated either in the input- or the output-oriented expression of super-efficiency models,
though, not in both simultaneously. As a result, both orientations should be applied to tackle the
infeasibility problem and calculate the overall super-efficiency score of a unit. The overall
super-efficiency score derives from the combination of the two SE-DEA orientations with suitable
weights. Chen’s method provides partial solution to the infeasibility problem of SE-DEA models
because in some cases it fails to define a feasible solution in both orientations (Chen et al., 2011;
Ray, 2008).
Cook et al. (2009) introduced an approach which proposes one-directional input-output movements
(i.e. decreases when input-orientation is applied, and increases in case of output-orientation) so that
the unit under evaluation that experiences infeasibility in super-efficiency models reaches the
frontier formed by the rest of DMUs. Lee et al. (2011) extended Cook et al.’s method by
introducing a two-stage method to achieve Cook et al.’s solution.
In addition to the above oriented solutions for infeasibility, Ray (2008) put forth a non-oriented
super-efficiency model drawing on the directional distance function introduced by Chambers et al.
(1996). Ray’s approach allows synchronous proportional output reductions and input expansions by
an unrestricted factor which is determined by the optimization procedure. Despite this particular
method resolving the infeasibility problem, it is not an oriented analysis.
Chen et al. (2011) proposed a combinatorial input- and output-oriented method that provides targets
for the evaluated DMU with radial movements of both inputs and outputs. The aggregated
super-efficiency score is defined as a ratio of optimal input- and output-oriented super-efficiency
components. Hence, it is the result of an optimization procedure without requiring arbitrary
selections on a factor. Chen et al., as Ray, introduce a non-oriented analysis for tackling the
4 A proxy approach to dealing with infeasibility of SE-VRS model
4.1 A proxy approach to input-oriented SE-VRS model
As discussed in the previous section, the essential reason for the infeasibility in the input-oriented
SE-VRS model is that the efficient DMUk does not belong to the output set S y
formed by the
remaining DMUs.
1 1
1
{ : , }
n n
j rj j
j j
j k j k
y
k y
y S y y
(5)The concept of the proxy approach is to find a virtual proxy unit for the efficient DMUk. The proxy
of the DMUk (xk,yk) is indicated by DMUk’ (xk’,yk’).The DMUk’ is the nearest point to DMUk at the
frontier, and its outputs yk’ belong to the output set S y
.
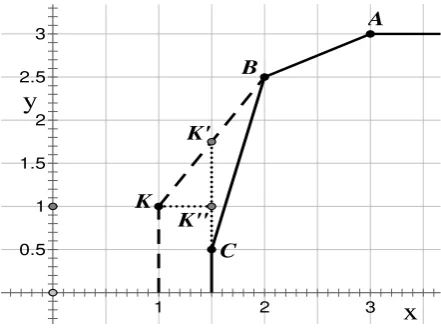
The process applied for determining the proxy of the efficient DMUk has two steps. In the first step,
an intermediate DMUk’’ (xk’’,yk’’) is defined. The intermediation process is expressed by a vertical
movement from point K to K’’ in Fig. 1, or, a scaling down of the output levels of DMUk holding
the inputs fixed. In this context, the first step of the proxy approach can be written as follows
m in
1 . . (1 )
n j rj j j k rk
y
s t y
1
1
n j j j k
, 0
j
(6)
The inputs and outputs of the intermediate DMUk’’ are defined by
''
ik ik
x x , yrk'' (1)yrk.
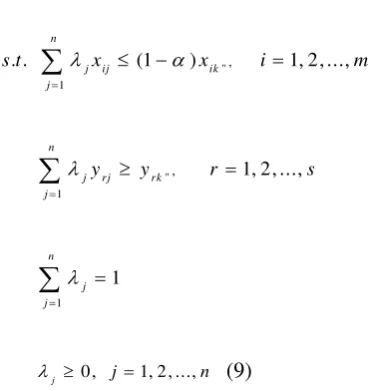
Having already identified the intermediate DMUk’’, we solve the following linear programming in
m ax
'' 1
,
. . (1 ) 1, 2, ...,
n
j ij ik
j
s t x x i m
'' 1 ,1, 2, ...,
n
j rj rk
j
y y r s
1 1 n j j
0, 1, 2, ...,
j j n (9)
The inputs and outputs of the proxy DMUk’ are defined as follows
'
(1
)
''ik ik
x
x
, yrk' yrk''. [image:10.595.72.257.96.292.2]The above discussion is expressed graphically by the horizontal movement from point K’’ to K’ in
Fig. 1.
If the efficient DMUk is feasible in the traditional SE-DEA model, its proxy DMUk’ will be the
same point as DMUk, i.e., there are neither vertical nor horizontal movements in the above two
steps.
At last, by replacing the original DMUk with its proxy unit DMUk’ in the sample and by solving the
following super-efficiency model we define a feasible super-efficiency score for every efficient
DMU ' 1 ' ' 1 ' 1 ' , ,
0 , 1, 2 , ..., ( ')
m in
. . 1, 2, ...,
1, 2, ...,
1
j
n
j ij ik
j
j k
n
j rj rk
j j k n j j j k
j n j k
s t x x i m
y y r s
1 2 3 4 3.5 3 2.5 2 1.5 1 0.5 ∙ ∙ ∙ ∙ ∙ K'∙ ∙ ∙ ∙ K'∙ ∙ ∙ ∙ ∙ ∙ ∙ y x K' K'' C K B A
Figure 1. Proxy approach to infeasibility in input-oriented SE-DEA
under VRS
4.2 A proxy approach to output-oriented SE-VRS model
In the output-oriented VRS SE-DEA model, infeasibility is present in case an efficient DMUk does
not belong to the input set Sx determined by the rest of DMUs.
1 1
1
{ : , }
n n
j rj j
j j
j k j k
x
k x
x S x x
(11)Similarly, a proxy of DMUk is defined, as indicated by DMUk’, whose inputs belong to the input set
Sx.
In the first step, an intermediate DMUk’’ (xk’’,yk’’) is identified after scaling up the inputs of DMUk
holding the outputs fixed. As illustrated in Fig. 2, the intermediate DMUk’’ is determined after a
rightward shift from K to K’’ so that the inputs of the intermediate DMUk’’ to be identical to the
lowest input level of the reference set. To achieve this, we solve the following linear programming
model
m in
1
. . (1 )
n
ik j ij
j j k
s t x x
1 1 n j j j k
, 0 j (12)
The inputs and outputs of the intermediate DMUk’’ are defined by
'' (1 )
ik ik
x
x , yrk'' yrk .In the second step, the proxy unit DMUk’ is identified by projecting the intermediate DMUk’’ to the
original frontier with the following programming
max
'' 1
,
. . 1, 2, ...,
n
j ij ik
j
s t x x i m
1
'',
(1 ) 1, 2, ...,
n
j rj rk
j
y y r s
1 1 n j j
j 0, j 1, 2, ...,n (13)
The above procedure is depicted by the upward movement from K’’ to K’ in Fig. 2.
The inputs and outputs of the proxy DMUk’ are defined by
' ''
ik ik
x
x
, yrk' (1)yrk''.Like the input-oriented proxy approach, DMUk’ replaces DMUk in the sample and is evaluated
against the super-efficiency reference set
m ax
' 1
'
. . , 1, 2, ...,
n
j ij ik
j
j k
s t x x i m
' 1
'
, 1, 2, ...,
n
j rj rk
j j k
y y r s
1 ' 1 n j j j k
j 0, j 1, 2, ..., (n j k') (14)
1 2 3
[image:13.595.180.401.263.428.2]3 2.5 2 1.5 1 0.5 ∙ ∙ ∙ ∙ ∙ K'∙ ∙ ∙ ∙ K'∙ ∙ ∙ ∙ ∙ ∙ ∙
y
x
K'' K' C A B KFigure 2. Proxy approach to infeasibility in output-oriented SE-DEA under VRS
5. Illustrative example
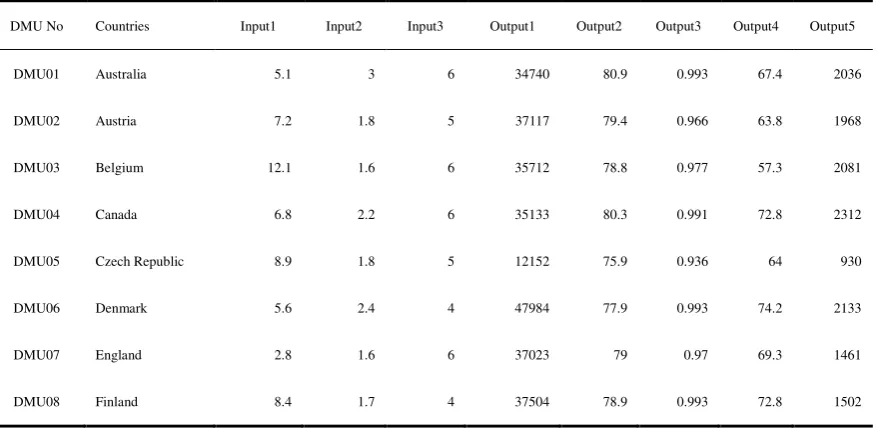
In Section 4, we apply our approach to a dataset used in Bal et al. (2010) (see Appendix 1). This
dataset consists of 30 OECD countries that utilize three inputs (Input 1: unemployment ratio
(2006), Input 2: rate of inflation (2005), and Input 3: infant mortality (2005)) in order to generate
five outputs (Output 1: national income per capita (US dollars, 2006), Output 2: human
development index: life expectancy from birth (2006), Output 3: human development index:
education index (2006), Output 4: contribution rate to labor force of female population (2006), and
Table 1. Super-efficiency measures
DMU Traditional SE-DEΑ Lovell & Rouse Ray Chen et al. Proxy Approach
Input-oriented
θ
Output-oriented
φ
Input-oriented
θ
Output-oriented
φ
Non-oriented
ψ θ φ
Non-oriented
ρ
Input-oriented
θ
Output-oriented
φ
1 Infeasible 0.9952 16.2222 0.9952 1.0048 1.0000 0.9952 1.0049 1.4385 0.9952
2 0.6707 1.0165 0.6707 1.0165 0.9837 0.6707 1.0000 0.6707 0.6707 1.0165
3 0.7347 1.0147 0.7347 1.0147 0.9853 0.7347 1.0000 0.7347 0.7347 1.0147
4 Infeasible 0.9991 16.2222 0.9991 1.0009 1.0000 0.9991 1.0009 1.1114 0.9991
5 0.6000 1.0572 0.6000 1.0572 0.9433 0.6000 1.0154 0.5909 0.6000 1.0572
6 Infeasible 0.9985 16.2222 0.9985 1.0015 1.0000 0.9985 1.0015 1.1451 0.9985
7 1.1550 Infeasible 1.1550 0.0575 1.1550 1.1550 1.0000 1.1550 1.1550 0.9984
8 Infeasible 0.9987 16.2222 0.9987 1.0013 1.0000 0.9987 1.0013 1.4826 0.9987
9 0.8732 1.0023 0.8732 1.0023 0.9978 0.8732 1.0000 0.8732 0.8732 1.0023
10 0.6000 1.0220 0.6000 1.0220 0.9781 0.6000 1.0042 0.5975 0.6000 1.0220
11 0.6000 1.0210 0.6000 1.0210 0.9793 0.6000 1.0082 0.5951 0.6000 1.0210
12 0.4281 1.0365 0.4281 1.0365 0.9635 0.4288 1.0031 0.4275 0.4281 1.0365
13 Infeasible Infeasible 16.2222 0.0575 1.5556 1.7290 0.8790 1.9670 1.9444 0.6947
14 Infeasible 0.9992 16.2222 0.9992 1.0008 1.0000 0.9992 1.0008 1.2780 0.9992
15 0.5253 1.0153 0.5253 1.0153 0.9847 0.5253 1.0000 0.5253 0.5253 1.0153
16 Infeasible 0.9879 16.2222 0.9879 1.0121 1.0000 0.9879 1.0122 5.2174 0.9879
17 Infeasible 0.7145 16.2222 0.7145 1.2005 1.0000 0.7145 1.3997 1.2642 0.7145
18 0.6392 1.0854 0.6392 1.0854 0.9159 0.6392 1.0615 0.6022 0.6392 1.0854
19 Infeasible 0.9984 16.2222 0.9984 1.0016 1.0000 0.9984 1.0016 1.7876 0.9984
20 0.7863 1.0042 0.7863 1.0042 0.9958 0.7863 1.0000 0.7863 0.7863 1.0042
21 Infeasible 0.7924 16.2222 0.7924 1.0831 1.0554 0.9162 1.1519 2.6922 0.7924
22 0.4971 1.0442 0.4971 1.0442 0.9558 0.4971 1.0000 0.4971 0.4971 1.0442
23 0.5000 1.0505 0.5000 1.0505 0.9496 0.5000 1.0227 0.4889 0.5000 1.0505
24 0.8006 1.0390 0.8006 1.0390 0.9615 0.8006 1.0231 0.7825 0.8006 1.0390
26 0.8540 1.0024 0.8540 1.0024 0.9976 0.8540 1.0000 0.8540 0.8540 1.0024
27 1.2573 0.9673 1.2573 0.9673 1.0286 1.0000 0.9673 1.0338 1.2573 0.9673
28 Infeasible Infeasible 16.2222 0.0575 1.3053 1.5485 0.9765 1.5856 4.1306 0.6485
29 0.2263 1.1527 0.2263 1.1527 0.8473 0.2263 1.1229 0.2016 0.2263 1.1527
30 Infeasible 0.6687 16.2222 0.6687 1.3313 1.0000 0.6687 1.4953 1.0227 0.6687
In Table 1, the second and third columns report super-efficiency scores measured by the traditional
input- and output-oriented SE-DEA models (2) and (4), respectively. Columns four and five
represent input- and output-oriented SE-DEA scores obtained by Lovell and Rouse (2003)’s
measure. The next column presents super-efficiency scores according to Ray (2008)’s approach.
Columns seven to nine report the movements of inputs and outputs and the super-efficiency scores,
as defined by Chen et al. (2011)’s measure. The final two columns illustrate the input- and
output-oriented super-efficiency scores yielded by the proxy approach.
The new approach successfully overcomes the infeasibility problem of the traditional SE-DEA
method in both orientations and its results are fully consistent with those of the traditional method
for feasible DMUs. The super-efficiency scores assigned to the infeasible DMUs by the proxy
SE-DEA model are displayed in bold numbers in the last two columns of Table 1. The new proxy
approach provides differentiated scores for every DMU enabling their ranking. To be more precise,
when input orientation is selected, the most efficient DMU among the thirty counties of the sample
is Japan (DMU 16) which obtains 5.2174, followed by Switzerland (DMU 28) with 4.1306, and
Norway (DMU 21) with 2.6922. When output orientation is applied, the most efficient country is
Switzerland (DMU 28), receiving a score of 0.6485, followed by the United States (DMU 30) and
Iceland (DMU 13), obtaining scores of 0.6687 and 0.6947, respectively.
The United States (DMU 30), which is a feasible DMU in the output-oriented traditional SE-DEA
method, is ranked No. 2, above the infeasible DMU 13 (i.e., Iceland). In addition, there are 5
feasible DMUs which are ranked higher than the infeasible DMU 7 (i.e., England). Such cases can
also be found in the results of the input-oriented proxy model. This reveals that infeasibility under
the traditional SE-DEA models does not always mean extreme super-efficiency. A similar
The input- and output-oriented proxy approach yields completely consistent super-efficiency scores
with the respective traditional SE-DEA models for every feasible unit. As a result, the new
approach provides rankings identical to that obtained by the traditional measures for the feasible
DMUs.
Lovell and Rouse (2003) method eliminates infeasibility but fails to provide an ordering procedure
for the DMUs deemed infeasible by the traditional SE-DEA models. For instance, under
input-oriented Lovell and Rouse’s measure, units that are deemed infeasible, according to
conventional SE-DEA measures, obtain a unique score of 16.2222; and under the respective
output-oriented measure, the three infeasible units are assigned a score of 0.0575. Both scores
reflect the scaling factor that is arbitrarily decided rather than the results of the super-efficiency
assessment process. Therefore, the obtained scores for the traditionally infeasible efficient DMUs
are unlikely to be interpreted. Additionally, this method yields consistent results for the DMUs that
are regarded as feasible by the traditional SE-DEA method. This is just because those feasible
DMUs are actually not involved in the scaling procedure. Essentially, Lovell and Rouse’s method is
applied exclusively to the infeasible DMUs.
Ray (2008) measure has a twofold interpretation referring both to inputs and outputs. For instance,
England obtains a super-efficiency score of 1.1550, which denotes that the inputs of this country
can be increased by 15.5% and its outputs reduced by 15.5% without affecting its efficiency status.
Acknowledging that this method is non-oriented, it is not desirable to compare its results with the
traditional SE-DEA and the Lovell & Rouse’s measures, which are oriented.
Similar to Ray’s measure, Chen et al. (2011) developed a non-oriented method which defines the
super-efficiency score (ρ) as a ratio of the input change (θ) to the output change (φ). Drawing on
the results obtained by Chen et al.’s method, Switzerland (DMU 28) is ranked second, receiving an
overall super-efficiency score (ρ) of 1.5856. By decomposing the super-efficiency score, we find
that Switzerland will remain efficient by scaling up its inputs by 54.85% and simultaneously
scaling down its outputs by 2.35%. The results yielded by Chen et al.’s method are not comparable
with those of the traditional SE-DEA models due to the incompatible orientation concepts that
The super-efficiency scores displayed in Table 1 are evidence of the incompatibility of Ray’s and
[image:17.595.60.520.162.763.2]Chen et al.’s measures with the traditional SE-DEA models.
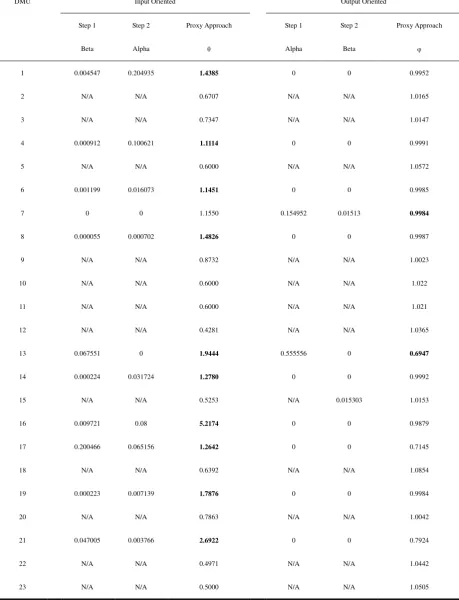
Table 2. Step-by-step results of the proxy approach
DMU Input Oriented Output Oriented
Step 1
Beta
Step 2
Alpha
Proxy Approach Step 1
Alpha
Step 2
Beta
Proxy Approach
θ φ
1 0.004547 0.204935 1.4385 0 0 0.9952
2 N/A N/A 0.6707 N/A N/A 1.0165
3 N/A N/A 0.7347 N/A N/A 1.0147
4 0.000912 0.100621 1.1114 0 0 0.9991
5 N/A N/A 0.6000 N/A N/A 1.0572
6 0.001199 0.016073 1.1451 0 0 0.9985
7 0 0 1.1550 0.154952 0.01513 0.9984
8 0.000055 0.000702 1.4826 0 0 0.9987
9 N/A N/A 0.8732 N/A N/A 1.0023
10 N/A N/A 0.6000 N/A N/A 1.022
11 N/A N/A 0.6000 N/A N/A 1.021
12 N/A N/A 0.4281 N/A N/A 1.0365
13 0.067551 0 1.9444 0.555556 0 0.6947
14 0.000224 0.031724 1.2780 0 0 0.9992
15 N/A N/A 0.5253 N/A 0.015303 1.0153
16 0.009721 0.08 5.2174 0 0 0.9879
17 0.200466 0.065156 1.2642 0 0 0.7145
18 N/A N/A 0.6392 N/A N/A 1.0854
19 0.000223 0.007139 1.7876 0 0 0.9984
20 N/A N/A 0.7863 N/A N/A 1.0042
21 0.047005 0.003766 2.6922 0 0 0.7924
22 N/A N/A 0.4971 N/A N/A 1.0442
24 N/A N/A 0.8006 N/A N/A 1.039
25 N/A N/A 0.3750 N/A N/A 1.0782
26 N/A N/A 0.8540 N/A N/A 1.0024
27 0 0 1.2573 0 0 0.9673
28 0.012261 0 4.1306 0.288889 0 0.6485
29 N/A N/A 0.2263 N/A N/A 1.1527
30 0.331259 0.271462 1.0227 0 0 0.6687
Detailed results of the proxy approach are presented in Table 2. In particular, columns two and
three demonstrate the movements of outputs (betas) and inputs (alphas) of both the infeasible and
the feasible efficient DMUs to their proxies when the input-oriented proxy SE-DEA model is
applied. The columns five and six display the movements of inputs (alphas) and outputs (betas) to
their proxies when the output-oriented proxy model is utilized. Note that there are no movements
for the feasible efficient DMUs, which means that the proxies of the feasible efficient DMUs are
themselves. The infeasible DMUs, as defined by the traditional SE-DEA models, are displayed in
bold numbers in Table 2.
Taking an example in the input-oriented proxy approach, Japan (DMU 16) is originally deemed
infeasible by the traditional input-oriented SE-DEA model. If it decreases its outputs by 0.97% and
scales down its inputs by 8%, its proxy can obtain a feasible super-efficiency score of 5.2174. For
feasible efficient DMUs, i.e., England (DMU 7) and Sweden (DMU 27), there is no need for input
and output adjustments. In such a case, the proxy unit is the same as the original one, and the proxy
approach will yield consistent super-efficiency scores as the traditional input-oriented SE-DEA
model.
Turning to an example in the output-oriented proxy approach, Switzerland (DMU 28) should scale
up its inputs by 28.89% without adjusting its output levels to find its proxy, and the proxy can get a
6. Conclusions
The current paper deals with the infeasibility problem that is present in traditional VRS SE-DEA
models. Our approach holds the original orientation of the SE-DEA model and identifies an optimal
virtual proxy unit that replaces the original infeasible DMU in the evaluation process. The proxy
unit is defined by applying a two-stage procedure which secures that the proxy unit is an optimal
derivative of the original unit. By applying the proposed method, 1) The proxy approach can yield
a super-efficiency score in cases where the traditional super-efficiency model is infeasible; and 2)
The proxy approach yields the same results as the traditional super-efficiency model when it is
applied to cases where the traditional super-efficiency model is feasible. The properties of the
proposed approach are presented in a numerical example. Utilizing a dataset found in Bal et al.
(2010), we demonstrate the advantages of the proxy approach over some existing methods
developed for tackling the infeasibility problem.
References
Andersen, P., & Petersen, N. C. (1993). A procedure for ranking efficient units in data envelopment analysis.
Management Science, 39, 1261-1265.
Bal, H., Örkcü, H. H., & Çelebioglu, S. (2010). Improving the discrimination power and weights dispersion
in the data envelopment analysis. Computers & Operations Research, 37, 99-107.
Banker, R. D., Charnes, A., & Cooper, W. W. (1984). Some models for estimating technical and scale inefficiencies in data envelopment analysis. Management Science, 30, 1078-1092.
Banker, R. D., Das, S., & Datar, S. (1989). Analysis of cost variances for management control in Hospitals.
Research in Governmental and Nonprofit Accounting, 5, 268-291.
Chambers, R. G., Chung, Y., & Färe, R. (1996). Benefit and Distance Functions. Journal of Economic Theory,
70, 407-419.
Charnes, A., Cooper, W. W., & Rhodes, E. (1978). Measuring the efficiency of decision making units.
European Journal of Operational Research, 2, 429-444.
496-504.
Chen, Y. (2005). Measuring super-efficiency in DEA in the presence of infeasibility. European Journal of Operational Research, 161, 545-551.
Cook, W. D., Liang, L., Zha, Y., & Zhu, J. (2009). A modified super-efficiency DEA model for infeasibility.
Journal of the Operational Research Society, 60, 276-281.
Dula, J. H., & Hickman, B. L. (1997). Effects of excluding the column being scored from the DEA envelopment LP technology matrix. Journal of the Operational Research Society, 48, 1001-1012. Lee, H.-S., Chu, C.-W., & Zhu, J. (2011). Super-efficiency DEA in the presence of infeasibility. European
Journal of Operational Research, 212, 141-147.
Lovell, C. A. K., & Rouse, A. P. B. (2003). Equivalent standard DEA models to provide superefficiency scores. Journal of the Operational Research Society, 54, 101-108.
Ray, S. C. (2008). The directional distance function and measurement of super-efficiency: an application to airlines data. Journal of the Operational Research Society, 59, 788-797.
Seiford, L. M., & Zhu, J. (1999). Infeasibility of super-efficiency data envelopment analysis models. Infor, 37, 174-187.
Xue, M., & Harker, P. T. (2002). Note: Ranking DMUs with infeasible super-efficiency DEA models.
Management Science, 48, 705-710.
[image:20.595.75.514.556.772.2]Appendix 1
Table A1. Input and output data of 30 OECD countries
DMU No Countries Input1 Input2 Input3 Output1 Output2 Output3 Output4 Output5
DMU01 Australia 5.1 3 6 34740 80.9 0.993 67.4 2036
DMU02 Austria 7.2 1.8 5 37117 79.4 0.966 63.8 1968
DMU03 Belgium 12.1 1.6 6 35712 78.8 0.977 57.3 2081
DMU04 Canada 6.8 2.2 6 35133 80.3 0.991 72.8 2312
DMU05 Czech Republic 8.9 1.8 5 12152 75.9 0.936 64 930
DMU06 Denmark 5.6 2.4 4 47984 77.9 0.993 74.2 2133
DMU07 England 2.8 1.6 6 37023 79 0.97 69.3 1461
DMU09 France 9.1 1.9 4 33918 80.2 0.982 62.4 2055
DMU10 Germany 9.2 2.3 5 33854 79.1 0.953 67.4 2424
DMU11 Greece 9.9 4.6 5 20327 78.9 0.97 56 1167
DMU12 Hungary 7.2 5.3 8 10814 72.9 0.958 53.5 705
DMU13 Iceland 1.8 4.8 4 52764 81.5 0.978 82.9 2103
DMU14 Ireland 4.3 4.7 6 48604 78.4 0.993 62.2 1436
DMU15 Italy 7.7 2.5 6 30200 80.3 0.958 50.1 1783
DMU16 Japan 4.4 1 4 35757 82.3 0.946 60.5 1822
DMU17 Luxembourg 4.2 1.1 5 80288 78.4 0.942 55.7 2215
DMU18 Mexico 3.6 5 25 7298 75.6 0.863 42.6 356
DMU19 New Zealand 3.7 2.7 6 26464 79.8 0.993 71.2 1424
DMU20 Netherlands 4.3 3.5 5 38618 79.2 0.988 69.5 2070
DMU21 Norway 3.5 1.3 4 64193 79.8 0.991 77.3 2330
DMU22 Poland 18.2 1.9 9 7946 75.2 0.951 57.6 496
DMU23 Portugal 7.6 3.5 6 17456 77.7 0.925 67.8 1237
DMU24 South Korea 3.7 2.8 5 16308 79 0.904 49.9 730
DMU25 Slovak Republic 11.7 3.3 8 8775 74.2 0.921 62.4 930
DMU26 Spain 9.2 3.1 5 27226 80.5 0.987 57.2 1218
DMU27 Sweden 5.8 2.2 3 39694 80.5 0.978 74.9 1746
DMU28 Switzerland 3.8 0.9 3 50532 81.3 0.946 75.3 2794
DMU29 Turkey 10.3 13.7 38 5816 71.4 0.812 26.5 255