Detecting Concentration of Analytes with
DETECHIP: A Molecular Sensing Array
Hannah Johnke, Gary Batres, Mark Wilson, Andrea E. Holmes, Sharmin Sikich Department of Chemistry, Doane College, Crete, USA
Email: [email protected]
Received July 27, 2013; revised August 27, 2013; accepted September 4, 2013
Copyright © 2013 Hannah Johnke et al. This is an open access article distributed under the Creative Commons Attribution License, which permits unrestricted use, distribution, and reproduction in any medium, provided the original work is properly cited.
ABSTRACT
DETECHIP is a detection system made of various sensors that has been shown to detect and discriminate between
small molecules of interest, including various illicit and over-the-counter drugs. Previously, detection was normalized to a single concentration of analyte. Now this detection assay can detect concentration differences in analytes via red, green, and blue color value changes and shifts in the UV-Vis spectra of the assay. To determine the concentrations dif- ferences, the exposed assays were scanned on a flatbed scanner and the images were analyzed for individual RGB val- ues with a custom macro in ImageJ, an image analysis program. Increasing concentrations of the analyte resulted in greater differences in color values between control and analyte wells. These differences showed a linear relationship to concentration change, some with correlation coefficients greater than 98%. This work expands the capability of DE- TECHIP to give information about the concentration of analyte when the analyte identity is known.
Keywords: Colorimetric Arrays; Sensors; Analyte Concentration; RGB Analysis; Drug Detection
1. Introduction
1.1. DETECHIP
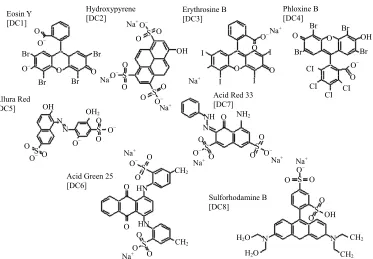
DETECHIP, short for detection chip, is a developing technology containing molecular sensors DC1-8 which discriminate between analytes via differential interac- tions with analytes resulting in colorimetric changes [1]. The molecular structures of molecular sensors DC1-DC8 are shown in Figure 1 [2,3]. This detection technique is a
simple assay that has been proven effective in detection of explosives in the field, performance-enhancing drugs in competitive sports, abused narcotics, and other small molecules of interest [4]. Colorimetric changes in DE- TECHIP are measured with computer analysis of assay images that is able to quantify red, green, and blue (RGB) color values, or by examination of UV-vis spectroscopy of control and analyte-treated solutions [4-6]. Recent work has focused on moving beyond analyte identifica- tion and toward analyte concentration determination. In particular, DETECHIP molecular sensors were examined by RGB image analysis and UV-vis spectroscopy to de- termine if concentration changes can be detected. DE- TECHIP detection of analyte concentration could pro- vide an alternative to costly, time-consuming methods and expands the capabilities of this detection technique.
Thus, it may be possible to apply these quantitative de- tection assays to applications in forensics, medicine, or homeland security [7-10].
1.2. Image Analysis of DETECHIP
Colorimetric changes exhibited upon addition of analytes to DETECHIP molecular sensors (DC1-DC8) can be detected by analyzing changes in RGB content in an image of the assay. RGB analysis is performed by an in-house modified macro that works with ImageJ (http://imagej.nih.gov/ij/). The macro measures indivi- dual red, green, and blue values in an image of a control solution and compares the values to an image of the analyte solution [9,10]. This analysis of DETECHIP has been very successful in determining the identity of analy- tes [1-3]. As seen in Figure2, an excerpt of a 96-well
Eosin Y [DC1] Hydroxypyrene [DC2] CH2 N CH2 N
H2O
H2O
CH2 S O O O Na+ HN O O HN
CH2
O
O S
O−
Na+ O−
Na+O
S O
N
NH O NH2
O S
O O−Na+
S O O O− Na+ S O
O OH
CI CI
CI O CI O Br O
Br Br
OH Br
O−
O−Na
+
O I
O O I I I O− Na+ OH O S
O O−
S
O−
Na+
O O
O S O
O− Na+ Br O Br Br O O− Br O−
O Na
+ OH N N S O OH2 O
S O−
O
O−
Acid Green 25 [DC6] Allura Red
[DC5]
Sulforhodamine B [DC8]
[image:2.595.113.486.82.341.2]Acid Red 33 [DC7] Erythrosine B [DC3] Phloxine B [DC4] O
Figure 1.Examples of DETECHIP sensors: Molecular structures of DC1-DC8 and their common chemical names.
R G B Control 65,535 40,595 35,082 Analyte 65,535 30,666 41,599 Code 0 1 1 Control 65,535 40,128 34,911 Analyte 65,535 31,023 41,548 Code 0 1 1 Contorl Analyte
DC
2
DC
1
Figure 2. Left—This image shows a visible color change in DC1 but not in DC2. Right—This table shows the resulting code for the given image after RGB analysis. The RGB values in the table represent the total red, green, or blue value for all the pixels in a set area of each well in the image. For DC2, the image analysis detects color change (as in- dicated by differences in the total color value) in the green and blue channels that the human eye cannot see.
Therefore, the red channel gives a code of “0”, whereas the blue and green channels give a code of “1”. Although DC2 does not show a visible color change, computer image analysis finds color changes in the green and blue channels, assigning a value of “1” for both channels. As human vision varies from person to person, the RGB analysis is more objective and less susceptible to human error. Unknown analytes are identified by comparing ex- perimental RGB codes to a previously established library of analyte codes. This master library is updated conti- nuously as more compounds are tested.
DETECHIP with RGB analysis is currently most sui- ted to analysis of compounds at a set concentration and because of this, analytes at alternative concentrations may produce different responses. UV-Vis spectroscopy
was also used in conjunction with the image analysis to evaluate if spectroscopic changes in λmax occur when
concentrations of analytes are varied. In this study, we show that concentration of analytes can be elucidated through changes in RGB values and with UV-Vis spec- troscopy. Ketamine and phenylalanine were selected as the analytes of interest due to their relevance in society. Ketamine has gained much popularity as a recreational drug due to its capability to induce dissociative amnesia [11]. Phenylalanine cannot be metabolized in patients with the genetic disorder phenylketonuria, and the food industry has started to label artificial sweeteners warning consumers of its phenylalanine content [12].
2. Materials and Methods
2.1. DETECHIP Plate Preparation
DETECHIP 96-well plates were prepared in a manner similar to previous procedures [1-3].
2.2. Analyte Solution Preparation
[image:2.595.59.286.374.452.2]nine solutions (CAS #150-30-1) were prepared in Ultra- Pure water at concentrations of 20, 40, 60, 80, and 100 mM. Results were analyzed with the same procedure as with ketamine. For UV-Vis analysis, ketamine solutions were prepared in UltraPure water at 5, 10, 20, 30, 45, 60, 80, and 90 mM concentrations.
2.3. RGB Analysis
V700 photo flatbed scanner was
2.4. UV-Vis Analysis
[image:3.595.57.543.620.737.2]pectroscopic changes produced
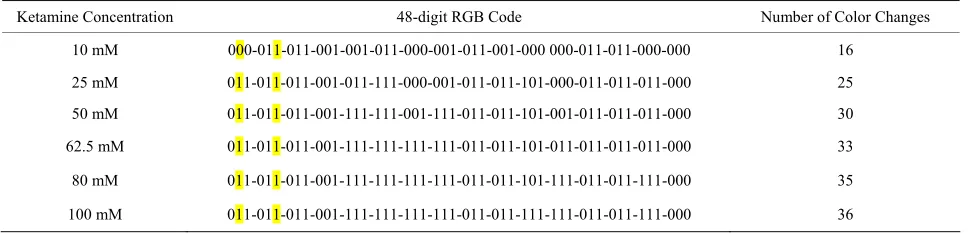
able 1. The unique 48-digit codes for DETECHIP with increasing concentrations of ketamine. Additional color changes,
ation 48-digit RGB Code Number of Color Changes
An Epson Perfection
used for RGB analysis. The settings for the scanner were Film (with Film Area Guide) document type, positive film type, 48-bit color, 400 dpi resolution, 8.00 × 10.00 inches document size, and Unsharp Mask on. Images were analyzed using a specialized computer program in ImageJ as previously described [1-3,10]. After much testing, the threshold value of 1000 proved to be optimal for sensitivity and selectivity of most analytes and pro- vided the best and most unique binary codes. If a lower threshold value was selected, too many wells indicated an unreliable color change. Thresholds greater than 1000 did not detect enough color changes. Responses from sensors and RGB codes were examined side by side in order to examine the effect of varying concentration on a specific RGB channel. Channels from sensors that dis- played a change in code from “0” to “1” as the concen- tration of ketamine increased were selected. The total color value for that channel in both analyte and control wells was obtained from the macro output, and the dif- ference was calculated by subtracting the specific channel color value of the analyte well from that of the control well. Three plates with three assays each were made, generating nine differences per data point which were averaged and plotted versus ketamine concen- tration.
In order to analyze the s
by ketamine interacting with DC1, a DETECHIP assay using only DC1 was prepared in a 96-well plate, with 150 µL of 400 mM phosphate buffer prepared in water (pH 7) and 30 µL of DC1 sensor (750 µM) added to every well. Then 120 mL of analyte solution or water (as the control) was added to each well, diluting the DC1 sensor concentration to 75 µM. Several assays were pre- pared using varying concentrations of ketamine (des- cribed in section 2.2) mixed with DC1 alongside control samples with no ketamine present. The resulting solu- tions were analyzed using a Cary-50 UV-Vis plate rea- der.
3. Discussion and Results
3.1. Concentration Determination through Image Analysis
For each concentration of ketamine tested from 10 mM to 100 mM, an identifying code was generated as shown in Table 1, with the unique identifying RGB code dif-
fering for each concentration. More color changes, or “1” s, develop with increased concentration of ketamine. For example, at 10 mM ketamine, there were 14 color changes observed, and for 25 mM there were 24 color changes. This trend continues until 34 color changes were observed for the highest concentration of 100 mM (Table1). Data sets for the green (DC1) and blue (DC2)
color channels were chosen because a trend in the total color values (either increasing or decreasing compared to control) was noticed with increasing concentration. These data sets were used to calculate average differ- ences between the total color values in analyte-treated and control wells. When the average difference of the green color value in DC1 was plotted against the concen- tration (Figure 3(a)), a linear relationship between the
two parameters occurred with a correlation coefficient of R = 0.99. This could reliably serve as a standard curve
T
highlighted in bold, develop as concentration of ketamine increases, although the concentration of sensor present remains constant. Digits of the code that are exhibited in the graphs in Figure 2 (DC1-green and DC2-blue) are highlighted in yellow, and represent increases or decreases in color change as concentration of ketamine increases. This may result in a change from a “0” to a “1” in the RGB code, if color change is small at lower concentrations and becomes more significant as centration increases, or can simply be represented by an increase in amount of color change if the code is a “1” for all con-centrations.
Ketamine Concentr
10 mM 000-011-011-001-001-011-000-001-011-001-000 000-011-011-000-000 16
25 mM 011-011-011-001-011-111-000-001-011-011-101-000-011-011-011-000 25
50 mM 011-011-011-001-111-111-001-111-011-011-101-001-011-011-011-000 30
62.5 mM 011-011-011-001-111-111-111-111-011-011-101-011-011-011-011-000 33
80 mM 011-011-011-001-111-111-111-111-011-011-101-111-011-011-111-000 35
(a) (c)
[image:4.595.85.515.78.419.2]
(b) (d)
Figure 3. Best linear fit of (a) D e blue channel; (c) DC1
gh
To c lts seen in the image analysis,
V-Vis spectra were obtained for solutions with and
C1 and ketamine in the green channel; (b) DC2 and ketamine in th
and phenylalanine in the green channel; and (d) DC2 and phenylalanine in the blue channel. All values were calculated by subtracting the green/blue values of the analyte wells from the control wells. The averages of these differences from six trials were then calculated and plotted against concentration of analyte.
or the determination of ketamine concentration. The U
f
same trend was observed for ketamine when its concen- tration was plotted against the difference in blue color
values in DC2 (Figure 3(b)). Similar to ketamine,
phenylalanine yielded a linear standard curve (R > 0.93) as well when its concentration was plotted against the difference in the green color value in DC1 and blue color value in DC2 (Figures3(c) and (d)). The red value did
not have significant color changes as concentration in-creased and was not used for the concentration studies of ketamine and phenylalanine (data not shown). Linear relationships were also found in other RGB channels such as the green channel in DC3 with ketamine and the blue channel in DC1 with phenylalanine (data not shown). These results demonstrate that linear standard curves can be obtained for various analytes in order to determine concentration of the analyte tested.
3.2. Concentration Determination throu UV-Vis Analysis
omplement the resu
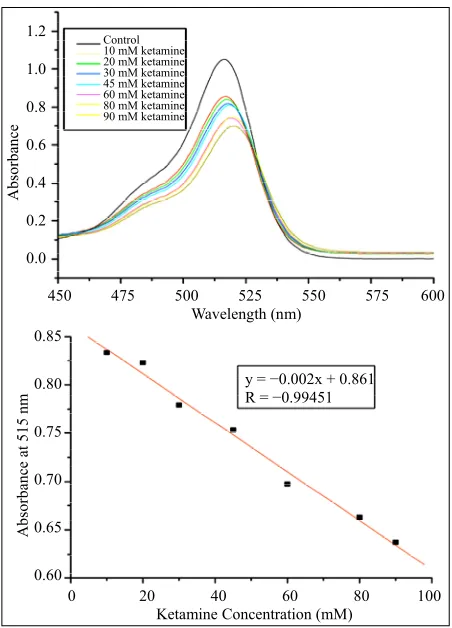
without the presence of analyte(s) at various concentra- tions and compared side by side. UV-Vis spectra of keta- mine at various concentrations (Figure 4, top) in the pre-
sence of DC1 showed two significant results as the con- centration of ketamine increased. The maximum absor- bance at around 516 nm decreased from A ≈ 1.05 to A ≈ 0.66, a decrease of more than 40%. Also, the maximum wavelength of absorbance at 516 nm for the control shif- ted 4 nm towards the red region to 520 nm. The spec- troscopic changes clearly indicate that there is a strong intermolecular interaction between ketamine and DC1, which becomes more evident as the concentration of ketamine increases. The same trend was observed for phenylalanine, with the maximum wavelength of absor- bance shifting approximately 3 nm as the concentration of phenylalanine was increased from 0 mM to 100 mM,
and the maximum absorbance decreasing from A ≈ 1.37
Control 10 mM ketamine 20 mM ketamine 30 mM ketamine 45 mM ketamine 1.2
1.0
60 mM ketamine 80 mM ketamine 90 mM ketamine
y = −0.002x + 0.861
R = −0.99451
0.85
0.80
0.75
0.70
0.65
0.60 0.8
0.6
0.4
0.2
0.0
Absorba
nce
A
bsorbanc
e at 515 nm
0 20 40 60 80 100 Ketamine Concentration (mM)
450 475 500 525 550 575 600 Wavelength (nm)
[image:5.595.59.285.83.397.2]1-5
Figure 4. Top—UV-Vis spectra of DC1 with varying centrations of ketamine, exhibiting a downwards shift in the peak of the spectrum as the concentration of ketamine was
nd of decreasing absorbance at 515 nm corre- tes to the linear color change of ketamine in
tity of the analyte is known, can be used to quantify concentration ketamine and phenylalanine. A linea
color and absorbance changes. Future work will involve
BRE Programs ources; the NSF F-EPSCoR-EPS-1004094
son, M. V. Wilson, M. Trauernicht and A. E. Holmes, “Improved Image Analysis of DETECHIP
Allows for Incr ination,”
Journal of Fo , No. 8, 2012, pp.
con-
increased. Each point on the spectra was calculated from an average of six trials. Bottom—Line of best fit representing the absorbance at 515 nm as ketamine concentration in- creases.
bottom), a linear trend was observed (R > 0.98). This linear tre
la DC1
(Figure 3(a)), confirming our initial hypothesis that
colorimetric changes in RGB code are accompanied by spectroscopic changes in absorbance values and shifts of the maximum wavelength.
4. Conclusion
In summary, when the iden DETECHIP assays
of analytes such as r
relationship between changing concentration and chang- ing RGB values was found for various DETECHIP sen- sors (DC1-DC3). A linear relationship in DC1 by UV- Vis spectroscopy was observed between ketamine con-centration changes and absorbance changes, indicating that intermolecular interactions (such as proton ex- change) of DETECHIP sensors and analytes dictate the
analyzing the changing code with concentration to relia- bly identify unknown analytes, regardless of concentra- tion. Absorbance changes and peak shifts will also be investigated as signatures for identification and concen- tration determination of analytes. This may lead to a DETECHIP assay that uses multiple, inexpensive tech- niques for small molecule identification.
5. Acknowledgements
This research was supported in part by the NIH, P20 RR0146469 (AEH and MW) from the IN
of the National Center for Research Res CHE-0747949 (AEH) and NS
(AEH, HJ, GB, SS).
REFERENCES
[1] A. Smith, A. Jack
eased Specificity in Drug Discrim
rensic Research, Vol. 3
. http://dx.doi.org/10.4172/2157-7145.1000161 [2] M. Lyon, M. V. Wilson, K. A. Rouhier, D. J. Symonsber-
gen, K. Bastola, I. Thapa, A. E. Holmes, S. M. Sikich and A. Jackson, “Image Analysis of DETECHIP®—A Mo-
lecular Sensing Array,” Advance in Intelligent and Soft Com- puting, Vol. 166, 2012, pp. 145-158.
http://dx.doi.org/10.1007/978-3-642-30157-5_16
[3] M. Lyon, M. V. Wilson, K. A. Rouhier, D. J. Symonsber- gen, K. Bastola, I. Thapa, A. E. Holmes, S. M. Sikich and A. Jackson, “Digital Image Analysis for DETECHIP®
Code Determination,” Signal and Image Processing: An International Journal, Vol. 3, No. 4, 2012, pp. 51-63. [4] L. Feng, C. J. Musto, J. W. Kemling, S. H. Lim and K. S.
Suslick, “A Colorimetric Sensor Array for Identification of Toxic Gases Below Permissible Exposure Limits,”
Chemical Communications, Vol. 46, No. 12, 2010, pp. 2037-2039. http://dx.doi.org/10.1039/b926848k
[5] L. Feng, C. J. Musto and K. S. Suslick, “A Simple and Highly Sensitive Colorimetric Detection Method for Gaseous Formaldehyde,” Journal of the American Chemi- cal Society, Vol. 132, No. 12, 2010, pp. 4046-4047. http://dx.doi.org/10.1021/ja910366p
[6] K. A. Rakow and K. S. Suslick, “A Colorimetric Sensor Array for Odour Visualization,” Nature, Vol. 406, NO. 6797, 2000, pp. 710-713.
http://dx.doi.org/10.1038/35021028
[7] M. C. Janzen, J. B. Ponder, D. P. Bailey, C. K. Ingison and K. S. Suslick, “Colorimetric Sensor Arrays for Vola- tile Organic Compounds,” Analytical Chemistry, Vol. 78, No. 11, 2006, pp. 3591-3600.
http://dx.doi.org/10.1021/ac052111s
[8] H. Lin and K. S. Suslick, “A Colorimetric Sensor Array for Detection of Triacetone Triperoxide Vapor,” Journal of the American Chemical Society, Vol. 132, No. 44, 2010, pp. 15510-15521.
[9] R. Burks, S. E. Pacquette, M. A. Guericke, M. V. Wilson, D. J. Symonsbergen, K. A. Lucas, and A. E. Holmes, “DETECHIP®: A Sensor for Drugs of Abuse,” Journal of Forensic Sciences, Vol. 55, No. 3, 2010, pp. 723-727.
.2010.01323.x http://dx.doi.org/10.1111/j.1556-4029
2
. 10-20.
[10] M. Lyon, J. Groathouse, J. Beaber, L. M. Turner, K. A. Rouhier, M. V. Wilson, D. J. Symonsbergen, S. M. Sikich and A. E. Holmes, “DETECHIP®: An Improved Molecu-
lar Sensing Array,” Journal of Forensic Research, Vol.
No. 126, 2012, pp. 1-7. ,
[11] S. A. Bergman, “Ketamine: Review of Its Pharmacology and Its Use in Pediatric Anesthesia,” Anesthesia Progress, Vol. 45, No. 1, 1999, pp
[12] Food Standards Agency, “Aspartame,” 2012.