Munich Personal RePEc Archive
The consumer empowerment index. A
measure of skills, awareness and
engagement of European consumers
Nardo, Michela and Loi, Massimo and Rosati, Rossana and
Manca, Anna Rita
European Commission, DG EU Joint Reseach Centre, IPSC, Ispra,
Italy
April 2011
Online at
https://mpra.ub.uni-muenchen.de/30711/
EUR 24791 EN - 2011
T
T
T
h
h
h
e
e
e
C
C
C
o
o
o
n
n
n
s
s
s
u
u
u
m
m
m
e
e
e
r
r
r
E
E
E
m
m
m
p
p
p
o
o
o
w
w
w
e
e
e
r
r
r
m
m
m
e
e
e
n
n
n
t
t
t
I
I
I
n
n
n
d
d
d
e
e
e
x
x
x
Michela Nardo, Massimo Loi, Rossana Rosati , Anna Manca
The mission of the JRC-IPSC is to provide research results and to support EU policy-makers in their effort towards global security and towards protection of European citizens from accidents, deliberate attacks, fraud and illegal actions against EU policies.
European Commission Joint Research Centre
Institute for the Protection and Security of the Citizen
Contact information
Address: Michela Nardo, European Commission, JRC, E. Fermi 2749, TP361, 21027 Italy E-mail: Michela.nardo@jrc.ec.europa.eu
Tel.: +39-0332-785968 Fax: +39-0332-785733
http://ipsc.jrc.ec.europa.eu/ http://www.jrc.ec.europa.eu/
composite indicators website: http://composite-indicators.jrc.ec.europa.eu/
Legal Notice
Neither the European Commission nor any person acting on behalf of the Commission is responsible for the use which might be made of this publication.
Europe Direct is a service to help you find answers to your questions about the European Union
Freephone number (*):
00 800 6 7 8 9 10 11
(*) Certain mobile telephone operators do not allow access to 00 800 numbers or these calls may be billed.
A great deal of additional information on the European Union is available on the Internet. It can be accessed through the Europa server http://europa.eu/
JRC 64349 EN
EUR 24791 EN
ISBN 978-92-79-19926-4 (print), 978-92-79-19927-1 (pdf) ISSN 1018-5593 (print), 1831-9424 (pdf)
doi: 10.2788/9102 (print), 10.2788/91744 (pdf)
Luxembourg: Publications Office of the European Union
© European Union, 2011
Reproduction is authorised provided the source is acknowledged
C
C
C
o
o
o
n
n
n
s
s
s
u
u
u
m
m
m
e
e
e
r
r
r
E
E
E
m
m
m
p
p
p
o
o
o
w
w
w
e
e
e
r
r
r
m
m
m
e
e
e
n
n
n
t
t
t
I
I
I
n
n
n
d
d
d
e
e
e
x
x
x
Nardo Michela
Loi Massimo, Manca Anna
Rosati Rossana
Joint Research Center – European Commission
Table of Content
Table of Content... 6
List of Tables... 8
List of Figures... 9
Executive summary... 11
1. Introduction... 14
2. The concept of Consumer Empowerment... 15
2.1 Consumer empowerment and markets... 15
2.2 Consumer empowerment: towards an operational definition... 17
2.3 The Consumer Empowerment Index and its components... 18
3. The dataset... 20
4. Statistical dimensionality of the framework... 22
4.1 Univariate analysis... 23
4.2 Multivariate analysis... 24
5. The Consumer Empowerment Index... 31
5.1 A set of weights for the Index... 31
5.2 Overview of the Index: scores and ranks... 32
5.3 Association of CEI with individual perceptions... 35
5.4 Influence of the design weights... 36
5.6 Association between the Index and its components... 38
6. Robustness of the results... 43
6.1 Robustness of the weighting based on experts’ elicitation... 43
6.2 Importance of each pillar... 45
7. Socio-economic aspects of consumer empowerment... 47
7.1 Gender... 48
7.2 Age... 49
7.3 Occupation... 49
7.4 Education... 52
7.5 Income... 53
7.6 Language spoken... 54
7.7 Internet use... 55
7.8 Perception of empowerment... 55
8. Conclusions... 59
9. Final tables... 61
References... 67
Appendix 1... 71
1. Structure of the Consumer Empowerment Index... 71
2. Construction of indicators... 72
3. Univariate analysis... 94
4. References... 101
Appendix 2... 102
1. Age distribution analysis histograms... 102
Appendix 3... 130
1. The concept of empowerment... 130
2. References... 132
Appendix 4. Socio-economic analysis (tables)... 135
2. Age... 137
3. Occupation... 141
4. Education... 158
5. Income... 161
6. Language spoken... 165
7. Internet use... 167
8. Perception of empowerment... 169
List of Tables
Table 1. Spearman correlation at the individual level (data multiplied by design weights)... 24
Table 2. Whole dataset: loadings of the principal components... 26
Table 3. Consumer skills: loadings of the principal components... 28
Table 4. Awareness of consumer legislation: loadings of the principal components... 29
Table 5: Consumer engagement: loadings of the principal components... 30
Table 6. Weights based on experts’ elicitation (0=minimum; 100=maximum)... 32
Table 7. Consumer Empowerment Index. Scores and ranks of the Index and its pillars... 33
Table 8. Scores for the 10 sub-pillars of the Consumer Empowerment Index... 35
Table 9. Correlation between CEI (pillars and sub-pillars) and individual perceptions... 36
Table 10: Consumer Empowerment Index. Scores of the Index and its pillars when design weights are not applied... 37
Table 11. Average rank difference (in absolute terms) between weighted and non-weighted data... 38
Table 12. Score correlation (country level) between indicators grouped in pillars... 39
Table 13. Correlation (country level) between indicators, pillars and the CEI scores... 40
Table 14. Correlation (country level) between sub-pillar, pillars and CEI scores... 41
Table 15. CEI ranks, maximum and minimum gain in ranks using all the Budget Allocation weights... 44
Table 16. Eliminating one pillar at a time: average (absolute) shift in ranks with respect to the baseline CEI... 45
Table 17. List of the most influential pillar for each country... 46
Table 18. CEI scores according to perceptions: difference with respect to respondents who fell to be confident, knowledgeable, and protected... 57
Table 19. Consumer Empowerment Index. Distance from EU-27 average. Scores and ranks of the Index and its pillars... 61
Table 20: Scores for the 22 questions of the CEI divided by pillar... 62
Table 21. Spearman rank correlation (individual level) between indicators, pillars and CEI ranks (in red values not significant at the 0.5% level)... 65
List of Figures
Figure 1. Framework and weights of the Consumer Empowerment Index (the budget allocation weights
for the three pillars are detailed in Table 6)... 19
Figure 2. Whole dataset: scree-plot of the principal components... 26
Figure 3. Consumer Skills: Scree-plot of the principal components... 27
Figure 4. Awareness of consumer legislation: scree-plot of the principal components... 28
Figure 5. Consumer engagement: scree-plot of the principal components... 29
Figure 6. Consumer Empowerment Index, distance from the EU-27 average... 34
Figure 7. Pillar values versus the ICE... 42
Figure 8. Box plot of CEI scores calculated with each set of weights obtained from Budget Allocation... 44
Figure 9. Eliminating one pillar at the time: box plot of the difference with the baseline... 46
Figure 10. EU-27 average scores for male (female) divided by the EU-27 average scores for the full sample ... 48
Figure 11. EU-27 average scores for level of education divided by the EU-27 average scores for the full sample... 49
Figure 12. EU-27 average scores for occupation divided by the EU-27 average scores for the full sample50 Figure 13. EU-27 average scores for education level divided by the EU-27 average scores for the full sample... 52
Figure 14. EU-27 average scores for income level divided by the EU-27 average scores for the full sample ... 53
Figure 15. EU-27 average scores for language spoken divided by the EU-27 average scores for the full sample... 54
Figure 16. EU-27 average scores for internet use divided by the EU-27 average scores for the full sample ... 55
Executive summary
The interest and debate on the notion of ‘consumer empowerment’ has been rapidly increasing during the
last decades. M. Monti in his report to the president of the European Commission “A new strategy for the
single market”1 places consumers and consumer welfare at the centre of next stage of the single market
(page 41). Wider choice, better information and an enhanced corpus of rights, protections and means of
redress are keywords of this view of consumer empowerment. On the other hand, the literature
emphasises the connections with skills, competences, and the abilities of the consumers stating that a
thorough knowledge of actual capacities, information and assertiveness of consumers is crucial for being
able to design and develop policies that effectively enhance consumer protection. At the European Level
the 2007-2013 EU Consumer Policy Strategy, while setting as a main objective “to empower EU
consumers”, also emphasizes the importance of a better understanding of how consumers actually behave,
advocating for the need of having real choices, accurate information, market transparency and the confidence that comes from effective protection and solid rights.2
It is to answer to these political needs that DG Health & Consumers and DG ESTAT lunched in 2010 a
Eurobarometer survey (Special Eurobarometer n. 342) on consumer empowerment aiming at collecting
internationally comparable data on (i) consumers’ basic numerical and financial skills, (ii) consumers’ level
of information on rights and prices, and (iii) consumers complaint and reporting behaviour, as well as
consumers’ experience with misleading or fraudulent offers. The dataset covers 29 countries (EU27 plus
Iceland and Norway) and had 56,470 respondents. The DG Health & Consumers together with the DG
Joint Research Center synthesized part of these data into a unique measure of consumer empowerment,
the Consumer Empowerment Index. The Index describes consumer empowerment along three main
dimensions: Consumer skills, Awareness of consumer legislation and Consumer engagement, acknowledging the multifaceted concept of empowerment.
This report describes the steps followed in the construction of the Index of consumer Empowerment. In
particular the definition of the theoretical framework, the quantification of categorical survey questions,
the univariate and multivariate analysis of the dataset, and the set of weight used for calculating the scores
and ranks of the Index. The report also discusses the robustness of the results and the relationship
between the Index and the socio-economic characteristics of the respondents in order to identify the
features of the most vulnerable consumers.
The Consumer Empowerment Index is a pilot exercise, aimed at obtaining a first snapshot of the state of
consumer empowerment as measured by the Eurobarometer survey. It is neither a final answer on
empowerment nor a comprehensive study on all the different facets of consumer empowerment, but
instead it is meant to foster the debate on the determinants of empowerment and their importance for
protecting consumers.
The Consumer Empowerment Index identifies Norway as the leading country followed by Finland, the
Netherlands and Germany and Denmark. The middle of the ranking is dominated by western countries
such as Belgium, France, and UK, with an average score 13% lower than the top five. At the bottom of
the Index are some Eastern and Baltic countries like Bulgaria, Lithuania, Poland, and Romania with a
score 31% lower on average (this gap reaches 40% and 38% in Awareness of consumer legislation and Consumer skills). A group of southern countries, Italy, Portugal, and Spain score poorly in the Index, especially in the pillar Consumer skills where the gap with the top performers reaches 30%.
The survey asked the respondents to express their opinion on whether, as consumers, they feel confident,
knowledgeable, and protected. The comparison between these perceptions and the Consumer
Empowerment Index shows that consumers who feel to be knowledgeable are also those who show
higher basic skills and better capacity to read logos and labels. Consumers who feel confident seem not to
read completely and carefully terms and conditions when signing contracts, while they seem to be more
interested in information on their rights as compared to non empowered consumers. Detriment and
redress is not significantly related to the perception of protection.
How can we construct an identikit of the most/least empowered consumers? A possibility is to study the
socioeconomic characteristics of the survey respondents. Below the main conclusions.
Gender. In all European countries but Norway male respondents score systematically better than
female in all pillars and the Consumer Empowerment Index even if 31.7% of them have the lead
in shopping decisions vis à vis the 68.4% of female respondents.
Age. The age of respondents plays an inverse role in their empowerment: younger generations
seem to be more skilled, aware and engaged than older generations, with the notable exception of
Italy where respondents in the age cohort over-54 are 16.4% more engaged than those in the age
Occupation. Overall the non active population is less empowered than active population, in 18 out
of 29 countries the least empowered are retired consumers, in 5 countries consumers not working
(either unemployed or looking after the home) and in 3 countries the least empowered are
unskilled manual workers. In all countries but Italy students are among the most empowered.
Education. Education has an important role in explaining empowerment. Lower levels of
empowerment are usually associated to low levels of education (ISCED 1-2). The highest gap is
found for Malta, the United Kingdom (UK) and the Czech Republic while the reverse is registered
only for Norway and Bulgaria where respondents with low education score respectively 19% and
10% more than higher educated respondents.
Income. Income seems to have an inverse relationship with engagement in Finland, the UK,
Ireland, Norway and Denmark: high income respondents (overall 26% of the sample analyzed)
result to be less engaged than respondents experiencing income shortages. The reverse holds for
the rest of EU countries, and especially for Bulgaria, Germany, Poland, Portugal, and Romania.
Income is not decisive in Cyprus, France, Iceland, Malta, and Spain.
Language spoken. The language spoken is not decisive for defining consumer engagement in most
of the surveyed countries, exceptions are Greece, Hungary and Italy where consumers speaking the
official language are 30% more empowered than those using a different language. The opposite
holds for Malta and the UK. As expected the dimension Consumer skills is driving the results in both directions (the only exception is the UK where consumers with a foreign language perform
well above the native speakers in all dimensions).
Internet use. Internet use seems to be related to empowerment: consumers with some experience
in using internet have higher scores in skills, awareness and engagement (with the exception of
Norway). The difference is large especially in Finland, where consumers not using internet are 50%
1.
Introduction
As largely recognized by the scientific literature, the empowerment of a consumer is a multifaceted
concept encompassing skills, competences and rights, as well as the ability of the consumer to gather and
use information and the capacity of the market to provide legal and practical protection devices. The EU
Consumer Policy Strategy 2007-2013, 'Empowering consumers, enhancing their welfare, effectively
protecting them' (COM(2007) 99 final), indicates that 'empowered consumers need real choices, accurate
information, market transparency and the confidence that comes from effective protection and solid
rights'. On the other hand, policy processes without tangible goalposts are meaningless.
It is to answer to these political needs that DG Health & Consumers and DG ESTAT lunched in 2010 a
Eurobarometer survey on consumer empowerment (Special Eurobarometer n. 342) aiming at collecting
internationally comparable data on three main aspects:
• Consumers’ skills: consumers’ basic numerical and financial skills as well as their knowledge of logos and symbols;
• Consumers’ level of information: consumers’ knowledge of their rights (awareness of unfair contractual terms, unfair commercial practices, guarantee rights, distance-purchasing rights, etc.),
of prices, of governmental and non-governmental institutions protecting them and of different
sources of information about consumer affairs;
• Consumers’ assertiveness: consumers complaint and reporting behaviour, as well as consumers’ experience with misleading or fraudulent offers.
The dataset resulting from this initiative covered 29 countries (EU27 plus Iceland and Norway), and
reached 56,470 consumers (on average 2,000 consumers per country) aged 15 and above.
Using this survey the DG Joint Research Center (together with DG Health & Consumers) constructed a
composite measure of consumer empowerment encompassing the plurality of aspects implied by the EU
policy Strategy.
The Consumer Empowerment Index (CEI) is a pilot exercise, aimed at obtaining a first snapshot of the
state of consumer empowerment as measured by the Eurobarometer survey. It is neither a final answer on
empowerment nor a comprehensive study on all the different facets of consumer empowerment, but
instead it is meant to foster the debate on the determinants of empowerment and their importance for
This report is structured as follows: the first part introduces the concept of consumer empowerment as
developed by the specialised literature over the last 20 years. Section 3 describes the dataset and how we
constructed the 22 indicators used in the Index. Sections 4 illustrates the statistical analysis of the dataset,
while Sections 5 and 6 present the Consumer Empowerment Index and discuss some statistical issues
related to the framework and its robustness, including the set of weights used. Section 7 relates the Index
to the socio-economic dimensions of the sample of consumer surveyed, like e.g. age, gender, income,
internet use, etc. The objective of this section is to portray the features of the most vulnerable consumers.
Section 8 concludes. Four Appendices complement the report detailing tables, data, statistical analysis and
country profiles.
2.
The concept of Consumer Empowerment
The interest and debate on the notion of ‘consumer empowerment’ has been rapidly increasing during the
last decades. The literature, while assuming rather than explicitly supplying an agreed framework for the
notion of consumer empowerment (Shaw, Brailsford, 2006), emphasises the connections with skills,
competences, rights and the abilities of the consumer on one hand, and with greater choice on the other
(Hunter, Harrison and Waite, 2006). Below we offer a brief (and necessarily incomplete) excursus into the
literature on consumer empowerment leaving for Appendix 3 a discussion on the general notion of
empowerment. A brief section on the operational definition of consumer empowerment concludes.
2.1
Consumer empowerment and markets
Social psychology and marketing literature are the main sources for the definition of consumer
empowerment, both referring to the strategic role of consumers vis à vis of producers and to the role of
information as an empowerment source.
In sociology Denegri-Knott, Zwick and Schroeder (2006) map the research on consumer empowerment
presenting three dominant explanatory models: consumer sovereignty, cultural power and discursive
power.
Under consumer sovereignty a consumer is empowered when he or she is free to act as rational and self-interested agent. [...] consumers combine resources and skills to make producers do what they would not do otherwise… (Denegri et all, 2006, page 963). Consumers' choices are thus positive instruments to direct and to correct the market,
page 955). An important feature of this approach is the relationship between consumer empowerment and
strategic behaviours. Following the game theoretic idea of a zero-sum game, power is distributed among
the 'players' of the market, where gains on one side consist in detriment for the opposite part: the measure
of empowerment is a 'function of assessing who influences whom more'. In this literature, empowerment
has a long tradition, dating back to Adam Smith's invisible hand theory (The Wealth of Nations, 1776). Offsprings of the sovereignty model relate empowerment to the level of consumers' ability, skills,
knowledge, motivations (Nelson, 2002; Pitt et all., 2002, Sirgy and Su, 2000); or relate empowerment to
actions in defence of consumers rights: class actions, boycott, movements against specific producers
(Friedman, 1996; Garret, 1987; Gueterbock, 2004).
In the cultural model the market is a place of conflict between consumers and producers where the later
try to condition and control consumers’ choices. Consumer empowerment resides not in the simple
capability to stand firm against these manoeuvring, but it implies a strategic behaviour, tactics to react to
buyers’ actions and motivations and processes whereby communities of various form resist and attempt to distinguish them from markets (Kozinets 2002, page 23 but also Kozinets et al., 2004). In this context quantitative studies to measure empowerment are less common, and cultural consumer power appears more connected to
ethnographic and phenomenological research, often based on direct evidence, observation and interviews.
Finally, the discursive model recognises a positive role to the interaction between consumers and
marketers, who are co-responsible of the market definition (Denegri-Knott, 2004; Hodgson, 2000; Holt,
2002). Here empowerment is the ability to construct discourse as a system […] determine(s) what is true or false […]
the ability to the consumer to mobilize discursive strategies to determine what can know and what actions can be undertaken… (Denegri et all, 2006, page 956). Researches in this field are interested in social, economic and juridical differences, cultures, and knowledge variety as drivers of empowerment or disempowerment.
Added value of this literature is the identification of the internalised norms, codes, and rules, which
represent the ‘normal’ consumer engagement.
The notion of consumer empowerment is also used in the marketing literature (Hunter and Garnefeld,
2008) to indicate both a subjective state/experience related to an increase in abilities (Wathieu et al., 2002)
or an objective condition related to greater information or understanding (Brennan and Ritters, 2004; Rust
and Olive, 1994). In this latter a wider choice, easier information access, and more generally higher
education are the premises to empowerment and have, as consequence, grater consumer involvement.
Wathieu et al. (2002) connect empowerment to consumer outcomes, and in particular, satisfaction. Does a
grater empowerment imply higher satisfaction? The evidence is mixed: Goldsmith, 2005; Henry, 2005; Pitt
et al, 2002 show that consumer empowerment is indeed an advantage for consumers while Dhar, 1997,
introspection and judgement efforts (Brennan, 2005; Wilson et al., 1993) as well as the increased costs in
terms of time necessary to make decisions (MacStavic, 2000).
Conger and Kanungo, 1988 in their definition of (individual) consumer empowerment as an enabling
process highlight (among other aspects) two crucial aspects of information as enabler of empowerment:
source credibility and information framing (referring to the positive or negative context of the message to consumers).
Pires et al. (2006), in the field of ICT, describe the transfer of power from the historical gatekeeper of the
market, the suppliers, to the consumers, new holders, or co-holders, of such a power, thanks to greater
availability and sophistication of choices. Consumer empowerment is not considered as the antithetic face
of producers defeat in the market-game. On the contrary suppliers’ strategies are a way to ‘regain control
over marketing process, that is, to manage the technological empowerment of consumers’. In this view,
consumer empowerment appears as profitable for the market on both the buyer and the producer side.
Finally Len Tiu Wright, presenting a special issue on consumer empowerment in 2006, suggests that
empowerment, and its experience, produces changes in consumers, who become less passive consumers in accepting whatever is offered by suppliers. She defines consumer empowerment, in marketing, as a mental state usually accompanied by a physical act which enables a consumer or a group of consumers to put into effect their own choices through demonstrating their needs, wants and demands in their decision-making with other individuals or organisational bodies in the marketplace. Consumer empowerment is intrinsically peculiar to the individual consumer psyche, […] but it has a beneficial effect in the short and long term of leading to improved business results (Wright et al., 2006, page 926). The management efforts to enhance market environments are considered by the authors as products of
consumer empowerment, in contrast with the more traditional visions based on exploiting and
manipulating by the firms. According to this view “ignorance” is the real danger.
2.2
Consumer empowerment: towards an operational definition
In the surveyed literature reported so far consumer empowerment remained an 'abstract' notion, lacking
both a formally agreed definition and an operational specification of parameters that would allow us to
measure it (also see Benchmarking the performance of the UK framework supporting consumer empowerment, 2008). It is clear that skills, competences, rights, information, consumer involvement should be part of this
operational definition. More difficult is to specify and measure the capacity of the market to provide legal
According to the EU Consumer Policy Strategy 2007-20133, empowered consumers need real choices,
accurate information, market transparency and the confidence that comes from effective protection and solid rights (page 5). Moreover, it is recognised as a major objective that of ensuring the effective application of the rules notably through enforcement cooperation, information, education and redness (page 6). The concept of consumer empowerment seems therefore to build on knowledge, skills and assertiveness, while it is accepted that it can derive from
different sources, including consumer education, valuable information, and institutional regulations.
In particular the following elements seem to be important for a definition of empowerment:
− consumers should be aware of their decisions when buying (e.g. terms and conditions, comparing prices, products' labels);
− consumers should be able to get information on their rights;
− consumers should have access to advocacy and redress mechanisms.
These three elements are those surveyed by Eurobarometer and captured in the Consumer Empowerment
Index.
To the extent that consumer empowerment is outcome driven, the public authority ought to be capable of
identifying features of the market which impede the realisation of consumer benefits or cause consumer
detriment, and put in place the necessary tools to deal with such problems: empowered consumers are thus capable of making informed choices, which in turn requires a consumer empowerment regime to put in place the tools for consumers to secure the best possible outcome for themselves […] (Benchmarking the UK Framework Supporting Consumer Empowerment, page 30).
2.3
The Consumer Empowerment Index and its components
The Consumer Empowerment Index is a composite measure constructed from a set of 56,470 individual
data gathered from the Special Eurobarometer n°342. The structure of the Index is reported in Figure 1.
We consider 22 indicators grouped in 3 main dimensions of empowerment: (1) Consumer skills, (2)
Awareness of legislation on consumer rights and (3) Consumer engagement. The index has a pyramid structure: the Index is the weighted average of three pillars (Skills, Awareness and Engagement). Each pillar is the
weighted average of a variable number of sub-pillars and finally each sub-pillar is made by various
indicators constructed from the survey questions. Weights are either decided by the experts of DG Health
& Consumers or obtained via the Consumer Market Expert group (see section 5.1).
3COMMUNICATION FROM THE COMMISSION – EU Consumer Policy strategy 2007-2013 - 'Empowering consumers,
The first pillar measuring Consumers Skills uses 6 questions divided into 2 sub-pillars: Basic Skills and Logos and Labels. The pillar aims at measuring the ability to perform basic arithmetic operations deemed necessary for consumers to make informed purchase decisions. It includes basic financial skills as the
capacity to identify the best interest rate for a saving or deposit account, or the calculation of a yearly
interest on a loan as well as the consumers ability to interpret packaging information (nutritional or “best
before” dates). The correct identification and interpretation of various commonly used EU logos related
to consumer information and protection is also included in this pillar.
The pillar Awareness of consumer legislation gathers together 7 indicators grouped in 3 sub-pillars: Unfair practices, Cooling off period, and Guaranteed period. The pillar describes the actual knowledge of consumers of several pieces of EU consumer legislation related to unfair commercial practices, length of guarantee rights
[image:20.595.50.477.366.731.2]validity, cooling-off period in distance or doorstep selling.
Figure 1.Framework and weights of the Consumer Empowerment Index (the budget allocation weights for the three pillars are detailed in Table 6)
Pillar Sub-pillar Indicator
QA42: Recognize cheaper product (0.25) QA43: Find the best interest rate (0.3) QA44: Calculate the interest on a loan (0.45) QA45: Correct interpretation of "grams of fat" (0.2) QA46: Find expiring date for a product (0.3) QA47(b): Recognize correctly logos (0.5) QA8: Rule for illegal advertisement (0.33) QA11: Rule for gifts received by post (0.33) QA13: Rule for advertising prices (air tickets) (0.33) QA6: Rule for money back guarantee (0.33) QA9: Rule for the purchase of car insurance (0.33) QA10: Rule for door-to-door sales (0.33) Guaranteed period (0.2) QA7: Rule for commercial guarantees
QA17: Comparisons when purchasing a good (0.5) QA18: Actual behavior in comparing products (0.5) Reading terms and conditions (0.2) QA14-15: Reading terms and conditions
QA16: Knowledge of consumer organizations (0.33)
QA40: Knowledge of programs related to consumer rights (0.33) QA41: Actual behavior in obtaining info on consumer rights (0.33) QA25: Tendency to communicate negative experiences (0.5) QA26: Tendency to communicate positive experiences (0.5)
Detriment and redress (0.2)
Combination of the questions QA27, QA28, QA31, QA36, and QA37: actual behavior when experimenting problems for which there is a legitimate cause for complaint
Comparing products (0.2)
Tendency to talk (0.2)
Cons
um
er
enga
gem
ent
Interest in consumer Information (0.2)
C
onsum
er Skills
Basic skills (0.5)
A
w
ar
enes
s o
f c
ons
um
er
le
gis
lation
Unfair commercial practices (0.4)
Consumer engagement is the most heterogeneous pillar as it refers to many different aspects of consumer behaviour. The Attitude in comparing products (2 indicators) aims at measuring the effort consumers make in obtaining information on products. Reading specialized consumer magazines, using internet, visit different
shops, or just talking with friends and family are some of the available options. This sub-pillar also
includes the consumer attention to price differences. The sub-pillar Consumers habits when reading terms and conditions (2 questions combined in one indicator) aims at capturing consumers’ behaviour when signing contracts: do they read carefully and completely terms and conditions? If not, why?
The sub-pillar Interest in obtaining information on consumer rights (3 indicators) measures the pro-active attitude of consumers when looking for information on their rights or when following specialized TV (radio)
programmes. It also includes the knowledge of organizations protecting consumer rights. The sub-pillar
Tendency to talk (2 indicators) aims at capturing consumer attitude to talk about negative and/or positive experiences. This is the only aspect of consumer empowerment we could not extensively survey in the
literature. Finally the sub-pillar Detriment and redress is related to consumers’ attitude when experiencing a problem causing a legitimate case for complaint. This was the most difficult sub-pillar to construct, due to
the structure of filtered questions (see Appendix 1 for details). Finally we have chosen to combine 5
questions describing the actions taken by consumer when experiencing problems.
The attribution of numerical scores to each question has been done in tight collaboration with DG Health
& Consumers. All the details of the construction of the indicators starting from the survey questionnaire
can be found in Appendix 1.
3.
The dataset
The Special Eurobarometer n°342 contains about 70 questions on Consumer empowerment and on the
socio-economic characteristics of the respondents. The questionnaire has been administered to 56471
respondents in 29 countries (EU 27 member states plus Iceland and Norway) through face-to-face
interviews.
The data were collected over two waves: the first wave was held from 26 February to 17 March 2010 and
involved 28.304 consumers; the second wave took place from 12 March to 1 April 2010 and covered of
28.167 consumers.
From the complete questionnaire we chose 27 questions to compile 22 indicators measuring different
1. when it was impossible to relate the question to a measure of empowerment (e.g. QA12: have you
personally brought airline tickets over the last 12 months? Or QA23: Over the past 12 months did
you buy or order any good or service over the internet?);
2. when the question depended on the use/not use of internet. For example QA21 and QA22: did
you red the conditions when you purchased a good or a service over the internet? If not, why? The
answer of this question depended on the use of Internet. More than 1/3 of the sample (those not
using internet) could not answer, so the inclusion of this question in the Index would have implied
discarding a substantial part of the sample.
3. when the questions were related to the socio-economic background of respondent.
To take into account the information contained in these questions (especially for cases 2 and 3) we
extracted sub-samples of respondents, those possessing the desired characteristics, e.g. education, age, use
of Internet, etc., and we calculated the Index evaluating the differences in scores and ranks with respect to
the full sample.
Original questions were all in an ordinal scale4, most of them dichotomous5. Some questions implied a
multiple choice and some others contained filters (e.g. if the respondent answers category 1 and 6 in
question X, then he/she is interviewed in question Y, if the respondent answers category 2,3,4, 5 in
question X then he/she is interviewed in questions Z). Whenever possible we combined the filtered
questions to construct a unique indicator able to resume all available options. This happened for QA14
and QA15 and for QA27, 28, 31, 36, 37. Together with DG Health & Consumer, we assigned scores to
each question. Scores vary within [0, 10] with 10 associated to the correct answer and 0 associated to the
wrong answer. The details of the codification of questions are in Appendix 1.
In the Eurobarometer survey the sample design used in each country was not able to give all the
individuals in the population aged 15 and above precisely the same chance of selection (all surveys share
this problem). Therefore raw data had to be corrected to avoid under or over representation of certain
group of respondents, e.g. retired people, male/female, respondents living in cities or in the countryside,
etc. The company conducting the survey provided a set of design weights to correct for the different
probabilities of selection. This set of individual design weights therefore theoretically corrects each country
sample for the following features: (i) stratification of the sample with respect to the reference population
4 Usually allowing answers of type: High, Medium, Low.
5 Dichotomous data are data from outcomes that can be divided into two categories (e.g. female/male, yes/no), where each
(the population aged 15 and over) in terms of age and gender; (ii) sample characteristics in terms of
geographical location of the respondents.
It was not clear to which extent the design weights supplied corrected for the population size in order to
make European countries comparable. Lacking this information, we opted for not adding any other design
weight to our figures to correct for the representativeness of each country in Europe. European Average is
thus calculated as the simple arithmetic average of the values by country (themselves calculated starting
from raw figures weighted with design weights).
Notice that the design weights should not be confused with the set of weights attached to each indicator
to obtain the composite. The first set of weights corrects a biased sample, whereas the second set is a
measure of the importance (or trade-off) of each indicator in the composite and will be discussed in the
following sections.
After applying the design weights to the dataset raw data were no longer distributed between 0 and 10 so
we had to rescale the sample. We used the max-min scaling (i.e. for each question and each individual
score we subtracted the sample minimum and divided by the sample range). Notice that the min and the
max used were those of the whole dataset (and not the min and max of each country). This is to avoid
equating average respondents in poorly scoring countries with exceptionally highly scoring respondents in
virtuous countries. The dataset so normalised had all individual scores ranging from 0 to 100. Each
country score has been calculated taking the sample average of all country’s individual values. Sample
average has been preferred to the median (or to other measures of central tendency) because it rewards
higher performances.
4.
Statistical dimensionality of the framework
As explained by the OECD-JRC handbook on constructing composite indicators (OECD-JRC 20086),
there exists an “ideal sequence” of steps to construct a composite indicator, from the development of a
theoretical framework to the analysis of detailed data, once the indicator is built.
A preliminary univariate and multivariate analysis is the first step in assessing the suitability of the dataset
and it is useful to understand the implications on ranks and scores of the methodological choices, e.g.
weighting and aggregation, used during the construction of the composite indicator. In particular
univariate analysis allows the assessment of each indicator with respect to e.g. missing data, outliers, the
presence of skewness and kurtosis. This statistical check aims at finding anomalies in indicators that could
influence the analysis (like the presence of outliers that could bias calculations). Multivariate analysis (and
especially Principal Component Analysis) helps the analyst to decide whether the nested structure of the
composite indicator is well-defined and if the set of available individual indicators is appropriate to
describe the phenomenon.
This section presents the results of the univariate analysis and of the principal component analysis
conducted to attest the validity of the structure (pillars, sub-pillars and indicator-association). Further
details are in Appendix 1.
4.1
Univariate analysis
Univariate analysis is essentially carried out to discover anomalous pattern in each indicator. In this dataset
missing data are not an issue since missingness is related to the nested structure of the questionnaire.
In the Index 13 out of 22 indicators are dichotomous and assume values 0 or 10, this generates in most of
the cases skewed distributions highly concentrated either towards ten or zero. In the pillar Skills the
indicators (all dichotomous but one) assume value 10 (the maximum value) for more than 81% of the
observations in the sample. Questions QA9 and QA41 are equal to zero in 75% and 87% of the cases
respectively and QA8 is equal to ten in 75% of cases. Questions QA42, QA43 and QA46 are equal to ten
in above 80% of the cases (the high concentration of the values is reflected by the low standard deviation
and coefficient of variation). This raises some concerns on the informative power of these indicators and,
as consequence, on the low range of variability for the composite. Appendix 1 shows the plots of all
indicators.
The distribution of the indicators is non-homogenous across countries. In the pillar Skills Bulgaria behaves
differently with respect to the other countries in question QA47B. Peculiar behaviour is found in Poland
(QA46), Portugal (QA44), Romania (QA44 and 47B) and Spain (QA45). In the Pillar Awareness strongly
peculiar distributions have not been detected, while in the pillar Engagement Norway and Iceland shows a
different behaviour in QA25 like Poland and The Netherlands in question QA26. The distribution of each
4.2
Multivariate analysis
Multivariate analysis, and in particular Principal Components Analysis is used to compare the theoretical
[image:25.595.50.431.191.456.2]framework with the statistical “framework” emerging in the dataset analysed.
Table 1. Spearman correlation at the individual level (data multiplied by design weights)
Skills QA42 QA43 QA44 QA45 QA46 QA47
QA42 1 0.583 0.417 0.426 0.585 0.431
QA43 0.583 1 0.406 0.391 0.553 0.390
QA44 0.417 0.406 1 0.339 0.363 0.378
QA45 0.426 0.391 0.339 1 0.528 0.399
QA46 0.585 0.553 0.363 0.528 1 0.440
QA47 0.431 0.390 0.378 0.399 0.440 1
Awareness QA8 QA11 QA13 QA6 QA9 QA10 QA7
QA8 1 0.135 0.291 0.238 0.046 0.090 0.150
QA11 0.135 1 0.089 0.138 0.121 0.096 0.081
QA13 0.291 0.089 1 0.204 0.029 0.072 0.117
QA6 0.238 0.138 0.204 1 0.175 0.327 0.248
QA9 0.046 0.121 0.029 0.175 1 0.245 0.107
QA10 0.090 0.096 0.072 0.327 0.245 1 0.179
QA7 0.150 0.081 0.117 0.248 0.107 0.179 1
Engagemen t
QA17 QA18 QA14_15 QA16 QA40 QA41 QA25 QA26 QA_ALL
QA17 1 0.321 0.215 0.303 0.198 0.120 0.226 0.257 0.187
QA18 0.321 1 0.201 0.237 0.251 0.141 0.200 0.231 0.161
QA14_15 0.215 0.201 1 0.134 0.132 0.073 0.106 0.107 0.123
QA16 0.303 0.237 0.134 1 0.226 0.158 0.135 0.185 0.153
QA40 0.198 0.251 0.132 0.226 1 0.135 0.148 0.197 0.145
QA41 0.120 0.141 0.073 0.158 0.135 1 0.091 0.112 -0.008
QA25 0.226 0.200 0.106 0.135 0.148 0.091 1 0.612 0.131
QA26 0.257 0.231 0.107 0.185 0.197 0.112 0.612 1 0.166
QA_ALL 0.187 0.161 0.123 0.153 0.145 -0.008 0.131 0.166 1
Red: values not significant at 5%
Principal component analysis (PCA) is a statistical technique that linearly transforms an original set of
indicators into a substantially smaller set of uncorrelated factors, the principal components, while retaining
as much as possible of the variation present in the dataset. 7 The principal components theoretically
portray the latent factors hidden in the dataset. PCA is therefore appropriate in a framework where a
composite aims at capturing multidimensional aspects of an undefined concept like consumer
empowerment. Ideally a framework is confirmed if the number of latent factors is equal to the number of
pillars/sub-pillars of the index. Likewise a pillar/sub-pillar dimension is confirmed if a unique latent
dimension is found. In the case of the Consumer Empowerment Index we could not perform this latter
analysis because sub-pillars do not contain enough indicators; we conducted a PCA on the whole set of
indicators and on the pillars using the standard correlation matrices on the dataset weighted with design
weights.
7 A description of PCA can be found in J, E., Jackson (2003), A user’s guide to principal Components, Wiley series in probability and
statistics, John Wiley & Sons, Hoboken, New Jersey. See also Joliffe, I.T., (2002). Principal Component Analysis (2nd edition). New
Before using individual data to perform the PCA we checked for the existence of linear correlation at the
individual level (i.e. using individual data, see Table 1). The Spearman rank correlations of the whole
dataset are all significant at the 5% level except few cases (QA-all with QA41 and QA14-15 with QA9).
Yet, the correlations are low (below 0.33) especially within the pillars Awareness and Engagement,
negatively influencing the results of the PCA.
The analysis has been performed also on the whole dataset and at the pillar level for raw data without
design weights with the aim of assessing the impact of the weighting design on the latent dimensions of
the Index.
a.
Whole dataset
The principal component analysis on the data without design weights (henceforth raw data) reveals the
presence of 7 relevant factors explaining only 47.4% of the variance of the dataset.8 Ideally, therefore, PCA
identifies 7 latent dimensions whereas CEI counts 3 pillars and 10 sub-pillars. The low percentage of the
variance explained (due to the low overall correlation of the dataset) explains the low performance of
PCA. The first factor alone accounts for 13.9% of the total variance while the remaining factors explain
between 6.9% (second component) and 4.4% (seventh component) of the total variance (Figure 2.a).
The same analysis repeated on the data multiplied by design weights reveals the existence of 5 relevant
factors accounting for 47.36% of the variance of the dataset. The application of the design weights, while
marginally changing the number of factor (all explaining a low percentage of variance) improves the
relevance of the remaining ones, especially the first factor that now accounts for 26.1% of the total
variance. The remaining factors explain between 6.1% (second component) and 4.8% (fifth component)
of the total variance (Figure 2.b).
The inspection of the loading factors (Table 2)9 reveals that, independently of the dataset used (with or
without design weights), the indicators have significant and autonomous explanation power: although the
signs of the loadings corresponding to the first component (that is the component accounting for most of
the variance) are the same for all the indicators, confirming that indicators correlate in the same direction
with the most important latent dimension. The loadings are low, especially for QA14-15, reflecting the low
correlation within the dataset, so the PCA is not decisive to infer the structure of the whole CEI.
Figure 2. Whole dataset: scree-plot of the principal components
2.a) Data without design weights 2.b) Data multiplied by design weights
3.1 1.5 1.4 1.3 1.2 1.1 .97 .5 1 1. 5 2 2. 5 3 E ige nv al ues
1 2 3 4 5 6 7 8 9 10 11 12 13 14 15 16 17 18 19 20 21 22 Component number 5.7 1.3 1.2 1.1 1.0 0 2 4 6 E ige nv al ues
[image:27.595.50.257.386.652.2]1 2 3 4 5 6 7 8 9 10 11 12 13 14 15 16 17 18 19 20 21 22 Component number
Table 2. Whole dataset: loadings of the principal components
2.a) Data without design weights 2.b) Data multiplied by design weights
Comp1 Comp2 Comp3 Comp4 Comp5 Comp6 Comp7
QA42 0.27 ‐0.08 ‐0.27 0.04 0.11 0.18 ‐0.17 QA43 0.23 ‐0.04 ‐0.24 ‐0.02 0.20 0.21 ‐0.29 QA44 0.30 ‐0.13 ‐0.21 0.10 ‐0.03 0.17 ‐0.20 QA45 0.29 ‐0.02 ‐0.35 0.02 ‐0.10 ‐0.17 0.34 QA46 0.26 0.02 ‐0.35 0.04 ‐0.01 ‐0.25 0.44 QA47B 0.35 ‐0.03 ‐0.17 0.03 ‐0.05 0.02 0.07
QA8 0.06 0.04 0.19 ‐0.01 0.50 0.34 0.28
QA11 0.13 ‐0.16 0.06 ‐0.06 ‐0.07 0.52 ‐0.05
QA13 0.11 0.03 0.06 0.04 0.50 0.14 0.25
QA6 0.26 ‐0.20 0.22 ‐0.28 0.04 ‐0.18 0.05
QA9 0.17 ‐0.26 0.22 ‐0.30 ‐0.15 0.04 ‐0.06 QA10 0.22 ‐0.27 0.26 ‐0.32 ‐0.10 ‐0.16 ‐0.07
QA7 0.17 ‐0.17 0.29 ‐0.14 0.10 ‐0.15 0.27
QA17 0.23 0.09 0.12 0.26 ‐0.18 ‐0.11 ‐0.18
QA18 0.18 0.11 0.27 0.33 0.05 0.01 ‐0.07
QA14_15 0.05 0.07 0.17 0.41 0.18 ‐0.33 ‐0.03 QA16 0.25 ‐0.09 0.10 0.27 ‐0.22 0.05 ‐0.12
QA40 0.19 0.08 0.26 0.21 0.12 ‐0.01 ‐0.10
QA41 0.16 0.08 0.25 0.23 ‐0.29 0.13 0.26
QA25 0.17 0.61 0.04 ‐0.30 ‐0.06 0.02 ‐0.07 QA26 0.23 0.56 0.07 ‐0.28 ‐0.03 ‐0.01 ‐0.07 QA_27_ALL 0.11 ‐0.08 ‐0.08 ‐0.08 0.41 ‐0.42 ‐0.41
Comp1 Comp2 Comp3 Comp4 Comp5
QA42 0.29 ‐0.01 ‐0.20 ‐0.04 ‐0.12 QA43 0.27 ‐0.01 ‐0.22 ‐0.04 ‐0.08 QA44 0.24 0.10 ‐0.14 ‐0.04 ‐0.31 QA45 0.25 ‐0.02 ‐0.19 ‐0.15 ‐0.25 QA46 0.29 ‐0.07 ‐0.20 ‐0.05 ‐0.12 QA47B 0.29 0.01 ‐0.08 ‐0.08 ‐0.20
QA8 0.18 ‐0.06 ‐0.14 0.18 0.35
QA11 0.14 0.21 0.00 ‐0.09 ‐0.13
QA13 0.17 ‐0.07 ‐0.22 0.19 0.30
QA6 0.23 0.26 0.09 ‐0.11 0.23
QA9 0.13 0.40 0.20 ‐0.23 0.15
QA10 0.18 0.39 0.20 ‐0.20 0.22
QA7 0.16 0.26 0.15 0.08 0.31
QA17 0.24 ‐0.07 0.12 0.13 ‐0.13
QA18 0.23 ‐0.08 0.14 0.27 0.03
QA14_15 0.11 ‐0.11 0.01 0.56 0.11
QA16 0.21 0.13 0.17 0.18 ‐0.29
QA40 0.19 ‐0.04 0.19 0.27 0.07
QA41 0.12 ‐0.03 0.53 0.21 ‐0.26
QA25 0.21 ‐0.49 0.23 ‐0.34 0.17
QA26 0.23 ‐0.44 0.23 ‐0.31 0.19
QA_27_ALL 0.17 0.02 ‐0.37 0.05 0.26
9 A factor loading is the correlation coefficient between the indicator and the factor. The squared factor loading is the percent
b.
Pillar-level analysis
Consumer skills
The pillar Consumer Skills displays an acceptable level of correlation (Table 1). This is reflected in the
results of the principal component analysis conducted on the raw data. PCA suggests the existence of 2
relevant factors explaining respectively 35.8% and 16.5% (in total the 52.2%) of the variance of the
dataset. Given that this pillar is composed by 2 sub-pillars the finding seems to confirm the framework of
the index. Design weights, however, induce some manipulation in the dataset; the PCA on the data
multiplied by design weights, in fact, indicates the presence of only one principal component explaining
51.9% of the variance (Figure 3).
The loading factors between the indicators and the first principal component have the same signs in both
datasets confirming that these indicators correlate in the same direction with the most important latent
factor (Table 3). A perfect matching between the statistical and the theoretical frameworks would entail
the two components loading principally the respective indicators (QA42,43,44 in the first and the rest in
the second). This is partially the case. Table 3a shows that indicators QA43 (belonging to the Basic skills
sub-pillar) and QA46 (covered by the Logos and labels sub-pillar) loads with the same principal
component suggesting that they explain the same latent characteristic of consumer empowerment.
Furthermore, this table displays a good correlation between the question QA47 and the first principal
component. Finally, the same analysis on the weighted data, could be an argument for not breaking this
pillar down into sub-pillars (Table 3b). Overall the statistical analysis confirms the structure of this pillar
for the raw data. Results for data with design weights are less clear pointing to the existence of a unique
relevant latent dimension.
Figure 3. Consumer Skills: Scree-plot of the principal components
3.a) Data without design weights 3.b) Data multiplied by design weights
2.1
.98
.5
1
1.
5
2
2.
5
E
ige
nv
al
ues
1 2 3 4 5 6
Component number
3.1
.5
1
1.
5
2
2.
5
3
E
ige
nv
al
ues
1 2 3 4 5 6
Table 3. Consumer skills: loadings of the principal components
3.a) Data without design weights 3.b) Data multiplied by design weights
Comp1 Comp2
QA42 0.40 0.37
QA43 0.35 0.51
QA44 0.42 0.29
QA45 0.44 ‐0.46
QA46 0.40 ‐0.56
QA47B 0.44 ‐0.04
Comp1
QA42 0.42
QA43 0.40
QA44 0.37
QA45 0.40
QA46 0.43
QA47B 0.42
Awareness of consumer legislation
In this pillar the Spearman correlation at the individual level is much less pronounced. The PCA on the
raw data shows a number of principal components – 3 – that is identical to the number of its sub-pillars.
The variance explained by this 3 principal components ranges between 23.9% of the first and 14.1% of the
third (overall, they account for 53.8% of the total variance). In the case of the weighted data, only two
principal components are detected accounting for 44.8% of the total variance (the first explains 29.7% of
the variance).
Furthermore, the analysis of the loading factors suggests that the indicator QA11 has an autonomous
behaviour, being loaded alone by one factor (Table 4).
All together, these findings highlight that the theoretical framework of the pillar is confirmed with the
[image:29.595.100.212.146.257.2]usual caveats due to design weights presented above
Figure 4. Awareness of consumer legislation: scree-plot of the principal components
4.a) Data without design weights 4.b) Data multiplied by design weights
1.7
1.1
.98
.6
.8
1
1.
2
1.
4
1.
6
E
ige
nv
al
ues
1 2 3 4 5 6 7
Component number
2.1
1.1
.5
1
1.
5
2
E
ige
nv
al
ues
1 2 3 4 5 6 7
Table 4. Awareness of consumer legislation: loadings of the principal components
4.a) Data without design weights 4.b) Data multiplied by design weights
Comp1 Comp2 Comp3
QA8 0.14 0.67 0.16
QA11 0.25 0.03 0.84
QA13 0.15 0.66 ‐0.12
QA6 0.52 ‐0.04 ‐0.23
QA9 0.44 ‐0.23 0.25
QA10 0.52 ‐0.22 ‐0.13
QA7 0.39 0.09 ‐0.35
Comp1 Comp2
QA8 0.34 0.54
QA11 0.30 0.04
QA13 0.31 0.61
QA6 0.49 ‐0.11
QA9 0.36 ‐0.43
QA10 0.44 ‐0.39
QA7 0.37 ‐0.01
Consumer engagement
The principal component analysis of this pillar detects 4 relevant factors (this pillar has 5 sub-pillars in the
CEI) in the raw dataset explaining 58.2% of the variance, ranging from 22.9% of the first component to
10.7% of the fourth one. The same technique identifies 3 principal components in the weighted dataset
accounting for 53.9% of the variance, ranging between 29.7% of the first component to the 11.3% of the
third one (Figure 5).
The indicators QA14-15 and QA27_ALL seem to be stand-alone and are loaded in separate factors (both
indicators are constructed starting from filtered questions). The loading factors analysis conducted on both
datasets (raw and weighted data), while confirming the aggregation of the indicators QA25 and QA26 into
an independent sub-pillar, it suggests some degree of communality between the indicators QA41 (covered
by the sub-pillar on Interest in information) and QA27_ALL (the Detriment and redress sub-pillar) into
the same sub-pillar (Table 5).
Figure 5. Consumer engagement: scree-plot of the principal components
5.a) Data without design weights 5.b) Data multiplied by design weights
1.9
1.3
1.1
.96
.5
1
1.
5
2
E
ige
nv
al
ues
1 2 3 4 5 6 7 8 9
Component number
2.7
1.2 1.1
.5
1
1.
5
2
2.
5
E
ige
nv
al
ues
1 2 3 4 5 6 7 8 9
Overall the statistical analysis confirms the framework in the case of raw data. Less in the case of weighted
data suggesting a relevant impact of the design weights.
Table 5: Consumer engagement: loadings of the principal components
5.a) Data without design weights 5.b) Data multiplied by design weights
Comp1 Comp2 Comp3 Comp4
QA17 0.37 0.26 ‐0.02 ‐0.21
QA18 0.33 0.28 0.03 0.24
QA14_15 0.14 0.29 0.27 0.78
QA16 0.30 0.37 ‐0.10 ‐0.45
QA40 0.32 0.24 0.14 ‐0.07
QA41 0.29 0.22 ‐0.47 0.06
QA25 0.45 ‐0.54 0.00 0.09
QA26 0.50 ‐0.48 0.05 0.01
QA_27_ALL 0.07 0.06 0.82 ‐0.28
Comp1 Comp2 Comp3
QA17 0.40 0.15 0.01
QA18 0.38 0.20 0.01
QA14_15 0.21 0.35 0.22
QA16 0.33 0.32 ‐0.14
QA40 0.33 0.21 ‐0.02
QA41 0.24 0.18 ‐0.66
QA25 0.39 ‐0.59 ‐0.03
QA26 0.42 ‐0.53 0.00
5.
The Consumer Empowerment Index
5.1
A set of weights for the Index
Central to the construction of a composite index is the need to combine in a meaningful way different
dimensions measured on different scales. This implies a decision on which weighting model will be used
and which procedure will be applied to aggregate the information. Weights should ideally be selected
according to an underlying and agreed, or at least clearly stated, theoretical framework. Weighting imply a
“subjective” evaluation, which is particularly delicate in case of complex, interrelated and multidimensional
phenomena. The menu of weighting methods is rather large and increasing with the creativity of the
practitioners. Ideally, weights should reflect the contribution of each indicator to the overall composite.
Different weights may be assigned to component series in order to reflect their economic significance
(collection costs, coverage, reliability and economic reason), statistical adequacy, cyclical conformity, speed
of available data, etc.
Most composite indicators rely on equal weighting, i.e., all indicators are given the same weight. This could
correspond to the case in which all indicators are “worth” the same in the composite. Statistical models
such as principal components analysis or factor analysis (Nicoletti et al., 2000) or benefit of the doubt (Melyn and Mosen, 1991, and Cherchye et al., 2004) can be used to weight individual indicators. Alternatively,
participatory methods that incorporate various stakeholders -- experts, citizens and politicians -- can be used to assign weights. This is the way followed in the Consumer Empowerment Index.
We decided in agreement with the DG Health & Consumers to follow a two-step procedure. The set of
weights within each pillar (detailed Figure 1), have been chosen by DG Health & Consumers experts. The
weights of the main three pillars (Skills, Awareness and Engagement) instead have been elicited using a
participatory approach, whereby a group of experts are asked to provide this information. This technique
is known as Budget Allocation.10 By using the Budget Allocation technique we intended to provide a more
systematic representation of experts’ opinion tempering the temptation of presenting the Index as
“objective”. The reader should bear in mind that, no matter which method is used, weights are essentially
value judgments and have the property to make explicit the objectives underlying the construction of a
To elicit the set of weights used in the CEI, we asked each of the 20 participants of the Consumer Market
Expert Group to allocate 100 points to the three dimensions of consumer empowerment. This produced
20 different sets of weights and obliged us to find a measure of central tendency to construct an “official”
weight for the CEI (see Table 6). The small sample size suggested the use of the median instead of the
average of the 20 sets of values, as it is less sensitive to outliers as compared with other measure of central
tendency. In any case the median is very similar to the mean, so similar to produce about the same scores
and exactly the same ranks. More interesting is the range of variation of the weights. Provided that no
expert gave 0 points to any dimension (Skills, Awareness and Engagement) the minimum weight ranged
between 15 and 20 and the maximum between 50 and 60. The implication of this variability will be
discussed in the section dedicated to the robustness of the Index, where all the 20 set of weights are used
to calculate alternative scores and ranks for the CEI.
Table 6. Weights based on experts’ elicitation (0=minimum; 100=maximum)
Cons
um
er
sk
ills
Awa
ren
ess o
f
co
ns
um
er
leg
isla
tio
n
Cons
um
er
en
gage
m
ent
average 32.07 32.72 35.22
median 32 30 34
stdev 9.21 10.78 10.79
min 20 20 15
max 60 60 50
5.2
Overview of the Index: scores and ranks
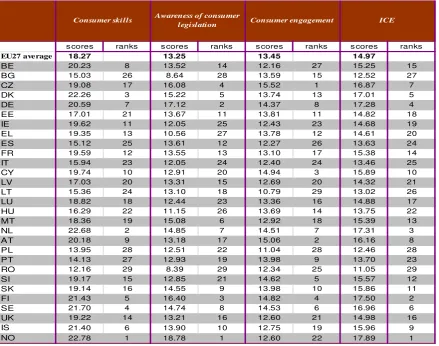
Table 7 presents the scores and ranks for the Consumer Empowerment Index. Norway leads the group of
surveyed countries, followed by Finland and the Netherlands, Germany and Denmark (close together in
terms of scores). At the opposite end Romania, Poland, and Bulgaria with a score 31% lower on average.
Norway has the best score in the pillars Consumer skills and Awareness of consumer legislation but occupy the 22nd position in the pillar Consumer Engagement due to its poor performance in Reading terms and conditions and
its below average performance in Tendency to talk and Detriment and redress (Table 8). Notice however that countries’ scores of the pillar Consumer Engagement are closer together than those of the remaining two pillars: In the first two pillars the worst three countries have an average score 38% and 40% lower than the
upper 5, while this difference is 27% in the third pillar. Being so close, small differences in the score of
two countries could result in high differences in their rank.
Furthermore, for all countries, the scores of the first pillar are higher than the scores of the remaining two
pillars. This is due to the high scores obtained by all countries in questions QA42, QA43, QA46 (EU27
10 For further details on the methodology please refer to the website http://composite-indicators.jrc.ec.europa.eu/ on the
average of 22.91, 22.93, and 23.45 respectively, see Table 20 at the end of the document) and the low
scores obtained in the questions QA10 and QA16 (EU27 average of 9.76 and 9.61 respectively) but
especially in questions QA41 (EU average of 3.37) and QA9 (EU average of 6.01). In all three pillars the
range of variability is rather small: countries’ scores are concentrated between 8 and 23.
Probably the best way to compare Consumer Empowerment is making 100 the EU27 average and
calculating the distance of each country from this average. Figure 6. Consumer Empowerment Index,
distance from the EU-27 average presents the results (the corresponding Table 19 is at the end of the
document). The best performers have a score up to 20% higher than the EU27 average, while the low
performers have up to 26% less. Awareness is the pillar where this gap is higher (reporting up to 42%
higher and 37% lower), followed by Skills (reporting up to 25% higher and 33% lower). Engagement is
where country performance is more uniform with 15% higher for best performers and 20% lower for low
[image:34.595.51.491.354.700.2]performers.
Table 7. Consumer Empowerment Index. Scores and ranks of the Index and its pillars
s cores ranks s cores ranks s cores ranks s cores ranks
EU27 average 18.27 13.25 13.45 14.97
BE 20.23 8 13.52 14 12.16 27 15.25 15
BG 15.03 26 8.64 28 13.59 15 12.52 27
CZ 19.08 17 16.08 4 15.52 1 16.87 7
DK 22.26 3 15.22 5 13.74 13 17.01 5
DE 20.59 7 17.12 2 14.37 8 17.28 4
EE 17.01 21 13.67 11 13.81 11 14.82 18
IE 19.62 11 12.05 25 12.43 23 14.68 19
EL 19.35 13 10.56 27 13.78 12 14.61 20
ES 15.12 25 13.61 12 12.27 26 13.63 24
FR 19.59 12 13.55 13 13.10 17 15.38 14
IT 15.94 23 12.05 24 12.40 24 13.46 25
CY 19.74 10 12.91 20 14.94 3 15.89 10
LV 17.03 20 13.31 15 12.69 20 14.32 21
LT 15.36 24 13.10 18 10.79 29 13.02 26
LU 18.82 18 12.44 23 13.36 16 14.88 17
HU 16.29 22 11.15 26 13.69 14 13.75 22
MT 18.36 19 15.08 6 12.92 18 15.39 13
NL 22.68 2 14.85 7 14.51 7 17.31 3
AT 20.18 9 13.18 17 15.06 2 16.16 8
PL 13.95 28 12.51 22 11.04 28 12.46 28
PT 14.13 27 12.93 19 13.98 9 13.70 23
RO 12.16 29 8.39 29 12.34 25 11.05 29
SI 19.17 15 12.85 21 14.62 5 15.57 12
SK 19.14 16 14.55 9 13.98 10 15.86 11
FI 21.43 5 16.40 3 14.82 4 17.50 2
SE 21.70 4 14.74 8 14.53 6 16.96 6
UK 19.22 14 13.21 16 12.60 21 14.98 16
IS 21.40 6 13.90 10 12.75 19 15.96 9
NO 22.78 1 18.78 1 12.60 22 17.89 1
ICE Consumer skills Awareness of consumer