http://www.scirp.org/journal/jcc ISSN Online: 2327-5227
ISSN Print: 2327-5219
A GASVM Algorithm for Predicting
Protein Structure Classes
Longlong Liu, Mingjiao Ma*, Tingting Zhao
Department of Mathematical Sciences, Ocean University of China, Qingdao, China
Abstract
The research methods of protein structure prediction mainly focus on finding effec-tive features of protein sequences and developing suitable machine learning algo-rithms. But few people consider the importance of weights of features in classifica-tion. We propose the GASVM algorithm (classification accuracy of support vector machine is regarded as the fitness value of genetic algorithm) to optimize the coeffi-cients of these 16 features (5 features are proposed first time) in the classification, and further develop a new feature vector. Finally, based on the new feature vector, this paper uses support vector machine and 10-fold cross-validation to classify the protein structure of 3 low similarity datasets (25PDB, 1189, FC699). Experimental results show that the overall classification accuracy of the new method is better than other methods.
Keywords
Protein Structural Classes, Protein Secondary Structure, Genetic Algorithm, Support Vector Machine
1. Introduction
For today’s advances in bioinformatics, one of the main tasks is the prediction of pro-tein structure in post-genome era of genomic research [1]. Improving the classification accuracy of the spatial structure of proteins not only helps to understand protein func-tion but also helps to understand how proteins perform biological funcfunc-tions [2]. De-pending on the difference of secondary structure alignment and topology fragment in protein sequence, Levitt and Chothia divided a protein sequence into four structural classes: all-α, all-β, α β/ and α β+ [3]. The current classification prediction
al-gorithms are mostly concentrated on these four structural classes prediction.
How to cite this paper: Liu, L.L., Ma, M.J. and Zhao, T.T. (2016) A GASVM Algo-rithm for Predicting Protein Structure Classes. Journal of Computer and Commu-nications, 4, 46-53.
http://dx.doi.org/10.4236/jcc.2016.415004
Current methods for protein structure prediction are mainly focus on finding effec-tive features of protein sequences and developing suitable machine learning algorithms. The former kind of research is mostly based on the amino acid composition [4] and pseudo-amino acid composition [5], which considered that similar sequences have sim-ilar protein structures. But the prediction results are easily affected by the sequence si-milarity. For example, the prediction accuracy of a high similarity dataset is 95% while the prediction accuracy of a low similarity dataset may be only 40% - 60%. Because the relationship between protein structures is most associated with protein secondary structure, someone proposed methods based on protein secondary structure and pro-tein functional domain to predict propro-tein structure [6]. Experiments show that for low similarity datasets this method also has a high prediction accuracy. After extracting ef-fective features, you can use a variety of classification algorithms to classify the ex-tracted feature vector, such as Neural networks [7], Support vector machines [8], Baye-sian classification [9], rough set theory [10], Fuzzy classification [11], Logit Boost clas-sifier [12], Information about the differences method [13], etc. Thus, an appropriate machine learning algorithm is very important to the prediction.
2. Materials and Methods
In this section, first, give the methods for extracting 16 features from the protein sec-ondary structure to compose a 16-dimensional feature vector; second, change every protein sequence of 3 low similarity datasets (25PDB, 1189 and FC699 dataset) to a 16-dimensional feature vector; finally, classify the 16-dimensional feature vectors by GASVM algorithm.
2.1. Materials
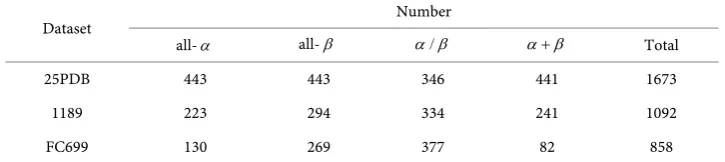
To evaluate the proposed method and facilitate its comparison with other existing me-thods, 3 widely used benchmark datasets 25PDB [13], 1189 [9] and FC699 [16] with sequence similarity lower than 25%, 40% and 40% respectively were selected. The compositions of 3 datasets were shown in Table 1.
2.2. 16-Dimensional Feature Vector
[image:2.595.193.556.620.701.2]Through PSIPRED [14] software, each amino acid residue of protein sequences can be mapped to one kind of the following three secondary structural elements: H (Helix), E (Strand), and C (Coil). In this paper, let SSS denote secondary structure sequence and
Table 1. Compositions of 3 datasets.
Dataset Number
all-α all-β α β/ α β+ Total
25PDB 443 443 346 441 1673
1189 223 294 334 241 1092
no-C-SSS denote the sequence that was removed coil structure from secondary struc-ture sequence. Let N and N' denote the length of SSS and the length of no-C-SSS
respectively. For convenience, the 16-dimensional feature vector which is extracted from protein secondary structure is denoted by P=
{
x x1, 2,,x16}
. The method toex-tract the feature vector will be described in more detail.
1) The first two features represent the proportion of H and E in SSS respectively, which have been proved significantly helpful in improving accuracy of protein structural classes[15], The features are as follows:
1 2 / / H E
x N N
x N N
= =
where NH,NE is the number of H E, in the SSS respectively. Since NH +NE+NC =N
(where NC is the number of C in the SSS), we only need to extract NH,NE two
features to represent the SSS.
2) To classify the protein structures, the maximum length and the average length of
,
H E and C segments (the successive same letter) are also important factors. Six
features are described as follows:
3 4 5 6 7 8 / / / / / /
x MaxsegH N
x MaxsegE N
x MaxsegC N
x AveragesegH N x AveragesegE N x AveragesegC N
= = = = = =
The MaxsegH , MaxsegE and MaxsegC are the maximum length of segment
and H E, and C in SSS respectively.
3) The more segments whose length reaches a certain value, the more likely to deter-mine the structure of a protein. We respectively selected the segment E whose
length is greater than 5 and the segment H whose length is greater than 3 as
fea-tures of protein secondary structure [20]. In order to represent the structure more accurately, we also extracted segments position information in SSS. That can be de-fined as follows:
9 10 11 1 / /
/ ( ( 1))
E Hseg Eseg N Ej j
x N N
x N N
x p N N
= = = = −
∑
where, NHseg is the number of segment H , NHseg is the number of segment E, Ej
p is the position of j−th E in the protein secondary structure sequence.
4) While proteins in the α β/ and α β+ classes contain both α-helices and β
-strands, there is a decided difference in the distribution of them. α-helices and
the α β+ class [20]. Therefore, it is necessary to extract features from the no-C- SSS. In this paper we extract 5 features from no-C-SSS that only have H and E seg-ments first time. The features are defined as follows:
' 12
' 13
' 14
' 15
' 16
/
/
/
/
/
EE
EH
HE
EHE
EHEH
x N N
x N N
x N N
x N N
x N N
=
=
=
=
=
EE
N is the number of two adjacent E segments in no-C-SSS, NEH is the number
of Esegment-H segment, NHE is the number of H segment-E segment, NEHE
is the number of E segment-H segment-E segment, NEHEH is the number of E
segment-H segment-E segment-H segment. 2.3. Construction of Classification Algorithm
2.3.1. Support Vector Machine
There are many algorithms to solve the protein multi-classification problem, such as neural net-work classification, support vector machine (SVM), Bayesian classification and so on. In this paper, support vector machine is selected for protein classification. The basic idea of SVM is map the data to a high dimensional space, and then find the data partition hyper plane in the high dimensional space. SVM has been widely used in protein secondary structure classification for its high prediction accuracy [17]. In this paper, we use “one-to-one” multi-classification method, and then combine 6 two-clas- sifiers to achieve multi-classification. Compared with other kernel function, the radial basis kernel function is better when deal with nonlinear problem [18]. So we select the radial basis kernel function 2
( , i) exp( i )( 0)
K x x = −γ x−x γ > as kernel function.
2.3.2. GASVM Algorithm
Genetic algorithm (GA) is a method based on the principle of natural selection and ge-netic optimization search. It includes several steps, such as chromosome coding, popu-lation initialization, fitness function calculating, basic genetic operation and so on. Here, GASVM algorithm is proposed to optimize the coefficients of these 16 features in the classification. The classification accuracy of SVM is regarded as the fitness function value of GASVM algorithm. The steps of GASVM algorithm are described as follows: 1) Let the coefficient vector be λ=
{
λ λ1, 2,,λ16}
. Randomly generate 16 initialcoef-ficients between [0,1] and code every chromosome with binary coding respectively. Then 200 chromosomes initialized compose the initial population.
2) The new feature vector X =
{
λ1 1x,λ2 2x ,,λ16 16x}
is the dot product of coefficientvector λ=
{
λ λ1, 2,,λ16}
and feature vector P={
x x1, 2,,x16}
.3) Calculate the new feature vector X of each protein sequence. Classify the feature
the fitness function value.
4) The first 160 individuals with big fitness function values are selected as parents in the next generation. In order to obtain the global optimum solution and improve the convergence rate, sorting selection method is adopted, the top 80% chromo-somes with higher fitness from population are selected and copied into the mating pool.
5) A new generation is produced by the genetic and crossover operation of paternal generation chromosomes. The multi-point crossover is adopted.
6) In the new generation, 40 population samples are selected randomly, and then mu-tation is performed. It means the values of certain genes of a chromosome are re-placed with other values to generate a new individual. Here, 5% of the chromosomes are mutated by point mutation method.
7) Repeat steps (2) to (6) until the fitness function values satisfy the requirement or the maximum number of cycles is reached.
3. Results and Discussion
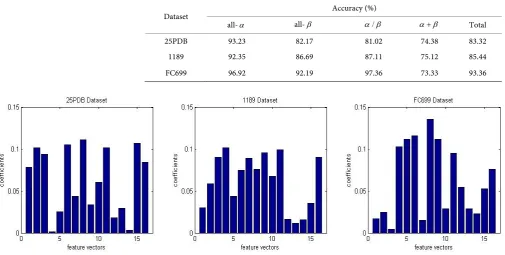
The protein sequences in 25PDB, 1189, FC699 3 datasets were classified by GASVM algorithm and 10-fold cross-validation was used. The classification accuracy can be seen in Table 2, the overall accuracy of the 25PDB, 1189, FC699 dataset is 83.32%, 85.44% and 93.36% respectively, the accuracy of all-α , all-β , α β/ and α β+
[image:5.595.50.556.436.691.2]bigger than 92.35%, 86.69%, 81.02% and 73.33% respectively. Figure 1 shows the op-timal coefficients, the differences among 16 coefficients are obvious.
Table 2. The results for the 3 datasets with 10-fold cross-validation.
Dataset Accuracy (%)
all-α all-β α β/ α β+ Total
25PDB 93.23 82.17 81.02 74.38 83.32
1189 92.35 86.69 87.11 75.12 85.44
FC699 96.92 92.19 97.36 73.33 93.36
4. Comparison with Other Methods
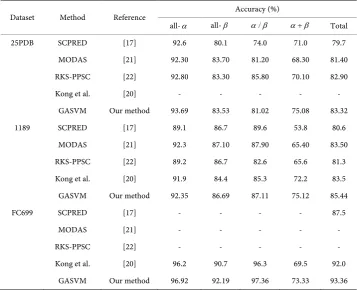
The SCPRED, MODAS and RKS-PPSC methods are widely accepted in protein struc-ture classification and the 25PDB, 1189, FC699 3 datasets are adopted to validate the effects. Here, the results of GASVM algorithm were compared with SCPRED, MODAS, RKS-PPSC and reference [20] (see Table 3). The data in Table 3 show that the overall accuracies obtained by our method are higher than other methods on 25PDB, 1189 and FC699 datasets, which increase 0.42%, 1.90% and 1.59% respectively.
Our method obtains the highest prediction accuracies for the classes among all the tested methods on 3 datasets. As for the class, the accuracy is 83.53% on 25PDB dataset and 86.69% on 1189 dataset, which is 0.17% and 0.41% lower than that of the famous MODAS method [21] respectively, but is 3.43% higher than SCPRED [17] and 2.29% higher than kongs’ method [20]. About the class, the accuracy is 81.02% on 25PDB da-taset, which is 4.78% lower than that of the RKS-PPSC [22], but is 7.02% higher than SCPRED [17]; the accuracy is 87.11% on 1189dataset, which is 2.49% lower than SCPRED, but is 4.51% higher than RKS-PPSC. It is also noticed that the significant im-provement is made in particular for the class, which is the difficult class to predict.
5. Conclusion
[image:6.595.195.553.410.700.2]In the paper, the importance of the weights of different features in protein structure classification are considered, so GASVM algorithm is proposed to optimize the coeffi-
Table 3. The comparison of different methods.
Dataset Method Reference Accuracy (%)
all-α all-β α β/ α β+ Total
25PDB SCPRED [17] 92.6 80.1 74.0 71.0 79.7
MODAS [21] 92.30 83.70 81.20 68.30 81.40
RKS-PPSC [22] 92.80 83.30 85.80 70.10 82.90
Kong et al. [20] - - - - -
GASVM Our method 93.69 83.53 81.02 75.08 83.32
1189 SCPRED [17] 89.1 86.7 89.6 53.8 80.6
MODAS [21] 92.3 87.10 87.90 65.40 83.50
RKS-PPSC [22] 89.2 86.7 82.6 65.6 81.3
Kong et al. [20] 91.9 84.4 85.3 72.2 83.5
GASVM Our method 92.35 86.69 87.11 75.12 85.44
FC699 SCPRED [17] - - - - 87.5
MODAS [21] - - - - -
RKS-PPSC [22] - - - - -
Kong et al. [20] 96.2 90.7 96.3 69.5 92.0
cients of these 16 features in the classification. Finally, 10-fold cross-validation is used to classify the protein structures of3 low similarity datasets (25PDB, 1189, FC699) and experimental results show that the overall classification accuracy of the new method is better than other methods. GASVM algorithm is very effective in protein structure classification. Weights of different features are considered is very necessary.
Acknowledgements
The authors would like to thank all of the researchers who made publicly available data used in this study and thank the National Natural Science Foundation of China (No: 61303145) for the support to this work.
References
[1] Black, D.L. (2000) Protein Diversity from Alternative Splicing: A Challenge for Bioinfor-matics and Post-Genome Biology. Cell, 103, 367-370.
http://dx.doi.org/10.1016/S0092-8674(00)00128-8
[2] Anfinsen, C.B. (1973) Principles That Govern the Folding of Protein Chains. Science, 181, 223-230. http://dx.doi.org/10.1126/science.181.4096.223
[3] Levitt, M. and Chothia, C. (1976) Structural Pattern in Globular Proteins. Nature, 261, 552-558. http://dx.doi.org/10.1038/261552a0
[4] Chou, K.C. (1999) A Key Driving Force in Determination of Protein Structural Classes.
Bi-ochemical & Biophysical Research Communications, 264, 216-224.
http://dx.doi.org/10.1006/bbrc.1999.1325
[5] Chou, K.C. (2011) Some Remarks on Protein Attribute Prediction and Pseudo Amino Acid Composition. Journal of Theoretical Biology, 273, 236-247.
http://dx.doi.org/10.1016/j.jtbi.2010.12.024
[6] Chou, K.C. (2004) Structural Bioinformatics and Its Impact to Biomedical Science. Current
Medicinal Chemistry, 11, 2105-2134. http://dx.doi.org/10.2174/0929867043364667
[7] Volpato, V., Adelfio, A. and Pollastri, G. (2013) Accurate Prediction of Protein Enzymatic Class by n-to-1 Neural Networks. Bmc Bioinformatics, 14, 1-7.
http://dx.doi.org/10.1186/1471-2105-14-s1-s11
[8] Chen, Y.K. and Li, K.B. (2013) Predicting Membrane Protein Types by Incorporating Pro-tein Topology, Domains, Signal Peptides, and Physicochemical Properties into the General form of Chou’s Pseudo Amino Acid Composition. Journal of Theoretical Biology, 318, 1-12. http://dx.doi.org/10.1016/j.jtbi.2012.10.033
[9] Wang, Z. and Zheng, Y. (2000) How Good Is Prediction of Protein Structural Class by the Component-Coupled Method? Proteins Structure Function & Bioinformatics, 38, 165-175.
http://dx.doi.org/10.1002/(SICI)1097-0134(20000201)38:2<165::AID-PROT5>3.0.CO;2-V
[10] Cao, Y., Liu, S., Zhang, L., Qin, J., Wang, J. and Tang, K. (2005) Prediction of Protein Structural Class with Rough Sets. Bmc Bioinformatics, 7, 1-6.
[11] Shen, H.B., Yang, J., Liu, X.J. and Chou, K.C. (2005) Using Supervised Fuzzy Clustering to Predict Protein Structural Classes. Biochemical & Biophysical Research Communications, 334, 577-581. http://dx.doi.org/10.1016/j.bbrc.2005.06.128
[12] Cai, Y.D., Feng, K.Y., Lu, W.C. and Chou, K.C. (2006) Using LogitBoost Classifier to Pre-dict Protein Structural Classes. Journal of Theoretical Biology, 238, 172-176.
[13] Jin, L., Fang, W. and Tang, H. (2003) Prediction of Protein Structural Classes by a New Measure of Information Discrepancy. Computational Biology & Chemistry, 27, 373-380.
http://dx.doi.org/10.1016/S1476-9271(02)00087-7
[14] Jones, D.T. (1999) Protein Secondary Structure Prediction Based on Position-Specific Scoring Matrices. Journal of Molecular Biology, 292, 195-202.
http://dx.doi.org/10.1006/jmbi.1999.3091
[15] Anand, A., Pugalenthi, G. and Suganthan, P.N. (2008) Predicting Protein Structural Class by SVM with Class-Wise Optimized Features and Decision Probabilities. Journal of Theo-retical Biology, 253, 375-80. http://dx.doi.org/10.1016/j.jtbi.2008.02.031
[16] Altschul, S.F., Madden, T.L., Schäffer, A.A., Zhang, J., Zhang, Z., Miller, W. and Lipman, D.J. (1997) Gapped Blast and Psi-Blast: A New Generation of Protein Database Search Pro-grams. Nucleic Acids Research, 25, 3389-3402. http://dx.doi.org/10.1093/nar/25.17.3389
[17] Kurgan, L., Cios, K. and Chen, K. (2008) Scpred: Accurate Prediction of Protein Structural Class for Sequences of Twilight-Zone Similarity with Predicting Sequences. BMC
Bioin-formatics, 9, 815-818. http://dx.doi.org/10.1186/1471-2105-9-226
[18] Zhang, S., Ding, S. and Wang, T. (2011) High-Accuracy Prediction of Protein Structural Class for Low-Similarity Sequences Based on Predicted Secondary Structure. Biochimie, 93, 710-714. http://dx.doi.org/10.1016/j.biochi.2011.01.001
[19] Liu, T. and Jia, C. (2010) A High-Accuracy Protein Structural Class Prediction Algorithm Using Predicted Secondary Structural Information. Journal of Theoretical Biology, 267, 272-275. http://dx.doi.org/10.1016/j.jtbi.2010.09.007
[20] Liang, K., Zhang, L. and Lv, J. (2014) Accurate Prediction of Protein Structural Classes by Incorporating Predicted Secondary Structure Information into the General Form of Chou’s Pseudo Amino Acid Composition. Journal of Theoretical Biology, 344, 12-18.
http://dx.doi.org/10.1016/j.jtbi.2013.11.021
[21] Mizianty, M.J. and Lukasz, K. (2009) Modular Prediction of Protein Structural Classes from Sequences of Twilight-Zone Identity with Predicting Sequences. BMC Bioinformatics, 10, 1-24. http://dx.doi.org/10.1186/1471-2105-10-414
[22] Yang, J.Y., Peng, Z.L. and Xin, C. (2010) Prediction of Protein Structural Classes for Low- Homology Sequences Based on Predicted Secondary Structure. BMC Bioinformatics, 11, 1-10. http://dx.doi.org/10.1186/1471-2105-11-s1-s9
Submit or recommend next manuscript to SCIRP and we will provide best service for you:
Accepting pre-submission inquiries through Email, Facebook, LinkedIn, Twitter, etc. A wide selection of journals (inclusive of 9 subjects, more than 200 journals)
Providing 24-hour high-quality service User-friendly online submission system Fair and swift peer-review system
Efficient typesetting and proofreading procedure
Display of the result of downloads and visits, as well as the number of cited articles Maximum dissemination of your research work
Submit your manuscript at: http://papersubmission.scirp.org/