Simulation of Nitrate Contamination in Groundwater
Caused by Livestock Industry (Case Study: Rey)
Majid Ehteshami1*, Armin Sefidkar Langeroudi1, Salman Tavassoli2
1Environmental Faculty, Civil Engineering College, KNT University of Technology, Tehran, Iran; 2Water Resource Management Faculty, Civil Engineering College, KNT University of Technology, Tehran, Iran.
Email: *[email protected]
Received May 28th, 2013; revised June 29th, 2013; accepted July 13th, 2013
Copyright © 2013 Majid Ehteshami et al. This is an open access article distributed under the Creative Commons Attribution License, which permits unrestricted use, distribution, and reproduction in any medium, provided the original work is properly cited.
ABSTRACT
With the economic development of many communities and the growing human population more food is needed. The livestock industry is one of the fastest growing industries in developing countries. The development of the livestock industry and the increase of livestock waste happens as a result of the growth in food production. The wastes are stored in a way that contamination of groundwater and surface water pollution in the environment has a significant impact on environment. This study analyses the environmental impact of livestock facilities and nitrate leaching in groundwater. After site sampling and libratory analysis, calibration of a simulation model with observed data was done to show ni- trate contamination in “Rey” groundwater. The movement of nitrate into soil and groundwater was simulated by LEACHN. By defining various scenarios and performing sensitivity analysis, we examined precisely the factors affect- ing ground water contaminations. Along together with the analysis of different scenarios and comparing them with the measured values, seasonal rainfall conditions have greatest impact on the rate of recharge of nitrate to groundwater. Therefore soil with low rainfall shows 44% reduction of nitrate leakage at a depth of 30 cm of soil conditions. Finally, the modeling results and graphs from different scenarios for purpose of nitrate reduction in groundwater were presented. The good match between model results and observed data showed that the model is calibrated to this area and can be used for prediction purposes and further studies.
Keywords: Livestock Industry; Nitrate Pollution; Pollution of Groundwater; LEACHN
1. Introduction
During past decades, the building of livestock centers, especially in developing countries, has increased. As a result of livestock development, industrial farms have gathered around urban centers. Concentration of animals and their wastes would cause environmental crises. Fast growth of domesticated animal products highlights the immediate need for effective policies. To manage live- stock operation we need an environmental and economi- cal coordinative path [1]. From 1980 to 2004, global meat production has been doubled. Most of such growth has been emerged in developing countries; whereas, production has been tripled and annual rate has been in- creased more than 5%. Although the industrialized coun- tries consume meat almost three to four times more than people living in developing countries. Developing coun- tries produced and consumed more than half of the
groundwater. Another research has shown that more than half of 5600 waste storage facilities at Iowa State have been leaked more than the standard rate [4]. According to US EPA standard, more than 10 mg of nitrate in drinking water can cause serious health risks in humans, espe- cially in children younger than 5 years old, seniors and people with weakened immune systems. For example, those children who have drunk from water polluted to nitrate are at risk of motemo-globinmia or Blue-Baby Syndrome, which causes weakness of human and even could cause death. Moreover, intestinal disorders in in- fants can increase conversion of nitrate to nitrite in the intestine; regarding the toxicity signs of nitrate which is more obvious than nitrate. It is recommended that the concentration of nitrite should amount to almost zero and nitrate in drinking water should not exceed 10 mg per liter based on nitrogen ions [5]. In 1996, Center for Dis- ease Control linked nitrate levels in Indiana drinking water wells near the animal husbandry to abortion in pregnant women. Nitrate levels may rise because of the land leveling, lagoon overflows and/or leakage, and/or improper use or excessive waste at farms [3]. Table 1 shows allowable amount of nitrate in water for different countries.
[image:2.595.308.540.540.723.2]Predicting the movement of nitrogen species under transient flow conditions in the field has required model- ing [6-9]. A major limitation of the models developed by these authors is that they cannot adequately simulate ni- trogen and plant dynamics at the field scale. Based on the adaptation of the concept and equation described by Johnson et al. [10] and earlier models [11-13] developed the LEACHM (leaching estimation and chemistry model) describing the water and dissolved chemical regimes in unsaturated field soils. LEACHM developed by Wagenet and Hutson [12], is a deterministic model, which de-scribes water and solute movement, transpiration, plant uptake, and chemical reactions in unsaturated soil zones. This model has four different modules: LEACHW for water only, LEACHN for nutrients, LEACHP for pesti-cides, and LEACHC for chemicals. The LEACHN model simulates movement based on chemical, physical, and biological processes in the soil-water-plant system. It can be used to simulate nitrification, denitrification, ammonia
Table 1. Standard amount of nitrate in drinking water*.
Country Allowable amount (ppm)
Iran 50
WHO/EU (1993) 50 - 100
WHO (1983) 45
NPDWR** (USA) 10
*WHO/EU drinking water standards’ comparative table; **National Primary Drinking Water regulations.
volatilization, and plant uptake of fertilizers. This model considers homogeneous, multi-layer soil profiles. The water and chemical kinetics, used in LEACHN, make it more straightforward to use in field-level studies. It re- quires a smaller input parameter set, and can estimate the critical hydraulic properties that affect chemical transport in the soil, rather than using values derived from estab- lished relationships, thus increasing its predictive accu- racy. Therefore, LEACHN appears to be a more robust and simpler model. Moreover, among the above-de- scribed models, it has one of the best described N simu- lation algorithms [14,15] and has been tested in many regions of the world [16,17]. Consequently, the LEA- CHN model was used in this study with the following objectives: 1) to evaluate the suitability of the LEACHN in simulating the fate and transport of nitrogenous com- pounds in a floodplain filtration system, and 2) to simu- late NO -N3 concentrations in the leachate for differ-
ent wastewater land-application management scenarios: different application rates and influent concentrations, and continuous vs. intermittent application patterns.
2. Materials and Methods
2.1. Movement of Nitrate in Soil
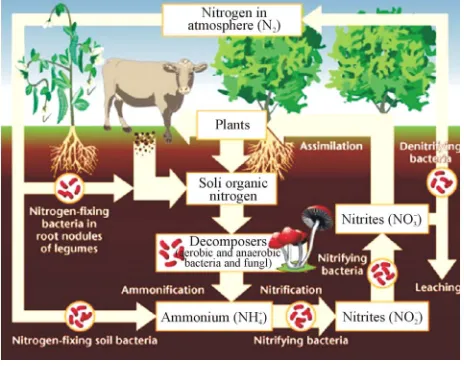
It is clear that waste produced by livestock industries is a potential organic nutrient for crops and pastures as fertil- izers. It produces not only nitrogen but also other nutria- ents such as phosphorus, potassium, calcium, magnesium, copper and zinc [18,19]. Conversion of nitrate in live- stock’s waste after being disposed from cultivated farms in nitrogen cycle is shown in Figure 1 [20]. The first form of inorganic nitrogen from mineralization of or- ganic nitrogen is ammonium NH4. Ammonium is mo-
stly absorbed by plant roots, but also it can be absorbed by soil colloids. By the process of nitrification at the soil
[image:2.595.59.284.633.715.2]surface when air temperature is high enough, the ammo- nium could be converted into ammonia NH3, which can be transformed into the air through its fast volatility [21]. If there are bacteria in the soil with process of nitrifica- tion, ammonium is converted to nitrate NO3 and nega- tive charge shall appear due to the high potential of dis-solving in water. Nitrate is absorbed by plant roots and/or converted into nitrogen N2 by those bacteria having the ability of de-nitrification process. If there are no plant roots to absorb nitrate and there is no suitable conditions for de-nitrification, nitrate will move vertically into soil profile and finally leached into groundwater [21].
2.2. Sub-Model LEACHN
In LEACHN sub-model, the main program initializes the variables, then calls the subprograms and executes sea- sonal mass balance. Subprograms are dealing with vari- ous processes such as water flow and solute, evapotran- spiration, nutrition, drainage, plant growth, heat flow, and also processing data input and output and also time steps calculations. Simulation begins in zero time on the first day of the initial conditions required for the whole system. Soil should be homogeneous in the vertical di- rection. For each part of the soil, the input data and initial conditions are required as follows [22]: The data which were used in the model were such as soil data for the various layers with equal thickness, soil surface bound-ary conditions, plant data; and other constants that are needed such as distribution coefficient, the maximum time step, emission coefficient, the equilibrium constant for the conversion of nitrogen (urea hydrolysis, ammonia volatilization, nitrification and de-nitrification are con-sidered), the absorption coefficient for urea, ammonium and nitrate, the lower boundary conditions, and the time step [22]. Except the constant coefficients of this model which were found after reviewing the available resources and/or their values calculated from the calibration model, other data were determined in the field and/or laboratory. The movement of nitrogen in the soil profile in following relationship is expressed as [23]:
SC
C t = Z D ,q qC SC
z
(1)
C = Nitrate concentration (g/cm3), S = Mineral de- pletion (cm3/cm3·day), = Nitrate concentration in
s
C
depletion (g/cm3), = Time (day), Z = Depth (mm), t = Volumetric water content (m3/m3), q = Water flow (L3/L2/T), D , q
= Molecular Diffusion Coefficient.Depletion of minerals in water indicates that the nitrate is taken by plants’ roots and therefore it is a function of soil moisture and consumed water. A similar Equation as (1) can be written in two and three dimension states.
Water movement in the soil profile is simulated using the Richards equation. This equation has been taken from composition of continuity equation and Darcy law. The one-dimensional model for vertical flow under transient condition follows as:
t = Z K H Z U z, t
(2)
= Volumetric water content (m3/m3), = Time t (day), C
h, K = Hydraulic Conduction co- efficient (mm/day), = Hydraulic differences of height, = Total pressure (KPa or mm), = Depth (mm), U = Water attract by plants (1/day).H
h Z
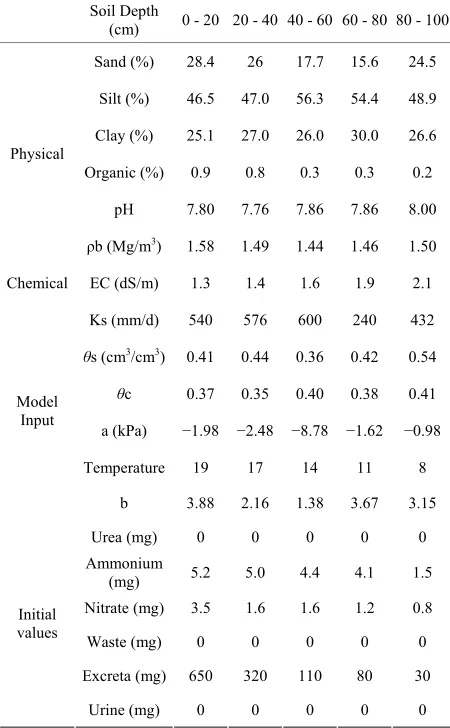
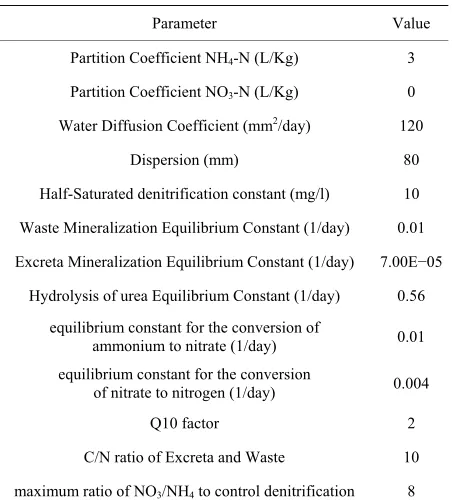
[image:3.595.310.535.373.737.2]This model uses an implicit method for solving central differential equations at all nodes. In the current model, the movement and interaction of ammonium, nitrate and urea can be simulated. Solute transport fate is estimated by numerical methods expansion-distribution Equation. The data used by the program in this study are summa-rized in Tables 2 and 3. Tables 4 and 5 summarize the physical and chemical soil properties analysis methods.
Table 2. Physical, chemical and initial values used in the model.
Soil Depth
(cm) 0 - 20 20 - 40 40 - 60 60 - 80 80 - 100
Sand (%) 28.4 26 17.7 15.6 24.5
Silt (%) 46.5 47.0 56.3 54.4 48.9
Clay (%) 25.1 27.0 26.0 30.0 26.6
Organic (%) 0.9 0.8 0.3 0.3 0.2
pH 7.80 7.76 7.86 7.86 8.00 Physical
ρb (Mg/m3) 1.58 1.49 1.44 1.46 1.50
Chemical EC (dS/m) 1.3 1.4 1.6 1.9 2.1
Ks (mm/d) 540 576 600 240 432
θs (cm3/cm3) 0.41 0.44 0.36 0.42 0.54
θc 0.37 0.35 0.40 0.38 0.41
a (kPa) −1.98 −2.48 −8.78 −1.62 −0.98
Temperature 19 17 14 11 8 Model
Input
b 3.88 2.16 1.38 3.67 3.15
Urea (mg) 0 0 0 0 0 Ammonium
(mg) 5.2 5.0 4.4 4.1 1.5 Nitrate (mg) 3.5 1.6 1.6 1.2 0.8
Waste (mg) 0 0 0 0 0
Excreta (mg) 650 320 110 80 30 Initial
values
Table 3. Constant parameters used in the model.
Parameter Value
Partition Coefficient NH4-N (L/Kg) 3
Partition Coefficient NO3-N (L/Kg) 0
Water Diffusion Coefficient (mm2/day) 120
Dispersion (mm) 80
Half-Saturated denitrification constant (mg/l) 10
Waste Mineralization Equilibrium Constant (1/day) 0.01
Excreta Mineralization Equilibrium Constant (1/day) 7.00E−05
Hydrolysis of urea Equilibrium Constant (1/day) 0.56
equilibrium constant for the conversion of
ammonium to nitrate (1/day) 0.01 equilibrium constant for the conversion
of nitrate to nitrogen (1/day) 0.004
Q10 factor 2
C/N ratio of Excreta and Waste 10
[image:4.595.311.538.361.536.2]maximum ratio of NO3/NH4 to control denitrification 8
Table 4. Chemical soil properties measurement method.
Chemical Soil Properties Measurement Method
Initial nitrate in soil Cornell University Nutrient Analysis Laboratories [24]
Initial nitrogen in soil Cornell University Nutrient Analysis Laboratories [24]
[image:4.595.60.287.383.449.2]Initial organic carbon in soil Wet oxidation diffusion procedure [25]
Table 5. Physical soil properties measurement method.
Physical Soil Properties Measurement Method
Water Retention Curve Pressure plate method [26]
Density Core methods [27]
Hydraulic Conductivity Constant head methods [28]
Particle size distribution Pipet methods [29]
2.3. Site Study
In this research, a dairy farm near the town of Rey was chosen. Rey is located at 35˚35′N 51˚26′E. In this site, the soil texture is silt. Nitrate initial concentration is at low and rainfall pattern is scarce in warm season with 500 cows operating. The site map has been shown in Fig- ure 2.
2.4. Experimental, Method of Sampling and Measurement
In order to determine the amount of nitrate concentration,
testing with ultra-violet spectrophotometer apparatuses in the lab was performed. For preparation of the standard solution, after filtration process the samples have been placed in the special dish for titration. First, the nitrate concentration was read at a wavelength of 220 nm be- cause nitrate in the water shows absorption in this wave- length. Organic compounds are also absorbed at a wave- length of 275 nm, so this wavelength is read too [30].
3. Results and Discussion
3.1. Calibration
Predicted values of soil nitrogen concentrations and mea- sured values were compared. Then the factors affecting nitrogen balance were studied. LEACHN model has ten-dency to underestimate nitrogen concentration. Figure 3 shows nitrate concentrations after 1, 30 and 60 days at different depths. As it can be seen, the amount of nitrate down to the depth of 30 cm shows major changes. The changes are similar from the depth of 30 to 80 cm and from a depth of 80 cm the changes are relatively fixed.
[image:4.595.58.287.496.580.2]As shown in Figures 4 and 5, the results simulations
Figure 2. Test Site (Google earth V.6.2.2.6613).
[image:4.595.307.537.564.711.2]and the results of measuring field data of nitrate concen- tration in various depths and time steps have been com- pared. Results show the good correlation between meas- ured and simulated data. Statistical analyses are summa- rized in Table 6.
[image:5.595.305.539.101.385.2]3.2. Sensitivity Analysis
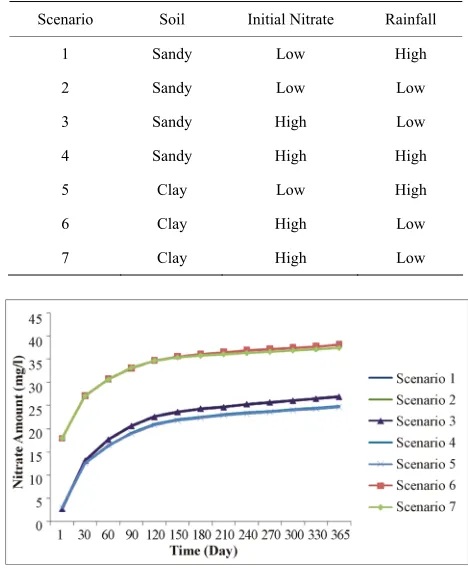
Table 7 shows different scenarios which have been used for sensitivity analysis.
[image:5.595.305.539.102.384.2]Figures 6 and 7 show that the results of the modeling scenarios concerning clay soils with high initial concen- trations at unstable climate, measured values are signifi-
Figure 4. Analysis of simulation model and measured data for different depth.
[image:5.595.57.288.405.525.2]Figure 5. Analysis of simulation model and measured data for various times.
Table 6. Statistical analyses of measured and simulated data, RMSE = Root Mean Square Error, CD = Coefficient of De- termination, RSQ = Correlation Coefficient.
RMSE CD RSQ Condition
17.50 0.91 0.93 Real condition
19.50 0.94 0.91 Scenario 1—First Mode (Nitrate Vs. Time)
15.27 1.09 0.98 Scenario 1—Second Mode (Nitrate Vs. Depth)
19.50 0.94 0.91 Scenario 2—First Mode (Nitrate Vs. Time)
49.64 0.40 0.88 Scenario 2—Second Mode (Nitrate Vs. Depth)
82.90 0.57 0.89 Scenario 7—First Mode (Nitrate Vs. Time)
50.46 0.39 0.88 Scenario 7—Second Mode (Nitrate Vs. Depth)
Table 7. Different scenarios used in sensitivity analysis.
Scenario Soil Initial Nitrate Rainfall
1 Sandy Low High
2 Sandy Low Low
3 Sandy High Low
4 Sandy High High
5 Clay Low High
6 Clay High Low
7 Clay High Low
[image:5.595.305.538.430.577.2]Figure 6. Sensitivity analysis of different scenarios for ni-trate movement in various times.
Figure 7. Sensitivity analysis of different scenarios for ni-trate movement in different depth.
cantly different due to differences in soil type compared with site soil texture, and also because of the high nitrate at initial concentrations; however, as for the other sce- narios, results are relatively very close to measured value. Meanwhile, measured values at the sandy soil scenario with low initial concentrations and weather conditions of low rainfall is closer to sandy soils with high initial con- centration and the rich rainfall climate.
[image:5.595.60.286.601.735.2]leakage has significantly decreased, in comparison with those measured values at the depth of 20 cm. It showed a nitrate concentration decrease of 70%; especially in sce- nario 1, where we have the highest decrease in nitrate value (78% at the depth of 20 cm). Vice versa, in those scenarios having rich rainfall climate, nitrate leakage has been decreased so little that the least nitrate value de- crease is shown at scenario 7 (32.6% at the depth of 20 cm). Table 7 shows variance analyses for simulated and measured data. It indicates a coefficient correlation be- tween measured and simulated data which is close to 90%. It shows good fits between calculated and observed concentration of nitrate which means the model is cali-brated for this case study and can be used to forecast concentration of nitrate to control it and further studies in this area.
4. Conclusions
Comparing those results from simulation modeling in scenario 8, the following results are obtained:
Effect of soil texture on leakage: Comparing the similar scenarios and changing soil texture, it is shown that nitrate leakage at medium depth in sandy soils is less than clay soils. We have the highest decrease at scenario 1 about 40% at the depth of 30 cm.
Effect of Soil hardness on leakage: Keeping soil tex-ture constant and with changing soil hardness, it is shown that change of hardness affects nitrate leaching in clay soils compared with sandy soils; whereas, the highest decline is seen in sandy soil like 13%, while, such value equals to 43% at the depth of 30 cm at clay soils.
Effect of rainfall on nitrate leakage: Changes of rainfall pattern have the most effect on leakage of nitrate; comparing to other scenarios. It is shown that at sandy soils change of rainfall effects decrease more in com- parison with the similar condition at clay soil. The high- est decline is shown in scenario 1 as for 44% at the depth of 30 cm. Hence, regarding the results, it is certain that rainfall directly affects leakage, increasing rainfall shall increase leakage.
Therefore, regarding the foregoing results, decreasing nitrate leakage can be practicable through some scenarios such as proper drainage in controlling rain and runoff and soil water content. In addition, controlling soil hardness and executing proper processes and improving soil tex- ture, nitrate seepage can be decreased into water-soil phase.
REFERENCES
[1] K. K. Olsen, “Multiple Wavelength Ultraviolet Determi- nations of Nitrate Concentration, Method Comparisons from the Preakness Brook Monitoring Project, October 2005 to October 2006,” Water, Air & Soil Pollution, Vol.
187, No. 1-4, 2008, pp. 195-202.
[2] FAO, “Livestock Policy Brief 2, Livestock Information, Sector Analysis and Policy Branch Animal Production and Health Division,” 2005.
ftp://ftp.fao.org/docrep/fao/010/a0261e/a0261e00.pdf [3] NRDC, “How Factory Farm Lagoons and Sprayfields
Threaten Environmental and Public Health, Cesspools of Shame, Natural Resources Defense Council and the Clean Water Network,” 2001.
www.nrdc.org/water/pollution/cesspools/cesspools.pdf [4] D. Osterberg and D. Wallinga, “Addressing Externalities
from Swine Production to Reduce Public Health and En- vironmental Impacts,” American Journal of Public Health, Vol. 94, No. 10, 2004, pp. 1703-1709.
doi:AJPH.94.10.1703
[5] US EPA, “Estimated National Occurrence and Exposure to Nitrate and Nitrite in Public Drinking Water Supplies,” US Environmental Protection Agency, Office of Drinking Water, Washington DC, 1987.
[6] I. K. Iskandar and H. M. Selim, “Modeling Nitrogen Transport and Transformation in Soil: 2. Validation,” Soil Science, Vol. 131, No. 5, 1981, pp. 303-312.
doi:00010694-198105000-00007
[7] H. M. Selim and I. K. Iskandar, “Modeling Nitrogen Transport and Transformations in Soil: 1. Theoretical Considerations,” Soil Science, 1981, Vol. 131, No. 4, pp. 223-241. doi:00010694-198104000-00007
[8] W. R. Tillotson and R. J. Wagenet, “Simulation of Fertil- izer Nitrogen under Cropped Situations,” Soil Science, Vol. 133, No. 3, 1982, pp. 133-143.
doi:00010694-198203000-00001
[9] J. J. Kaluarachchi and J. C. Parker, “Finite Element Model of Nitrogen Specied Transformation and Transport in the Unsaturated Zone,” Journal of Hydrology, Vol. 103, No. 3-4, 1988, pp. 249-274. doi:0022-1694(88)90137-0 [10] H. L Johnson, L. Bergstorm, P. E. Jansson and K.
Paustian, “Simulated Nitrogen Dynamics and Losses in a Layered Agricultural Soil,” Agricultural Ecosystems and Environment, Vol. 18, No. 4, 1987, pp. 333-356. doi:0167-8809(87)90099-5
[11] W. R. Tillotson, C.W. Robbins, R. J. Wagenet and R. J. Hanks, “Soil, Water, Solute, and Plant Growth Simula- tion,” Bulletin No 502, Utah State Agricultural Experi- mental Station, Logan, 1980.
[12] R. J. Wagenet and J. L. Hutson, “LEACHM: A Process- Based Model of Water and Solute Movements, Transfor- mations, Plant Uptake and Chemical Reactions in the Unsaturated Zone,” Version 2.0, Volume 2, New York State Water Resources Institute, Cornell University, Ithaca, New York, 1989.
[13] J. L. Hutson and R. J. Wagenet, “Leaching Estimation and Chemistry Model,” Version 3, Research Series No 92-3, Department of Soil, Crop and Atmospheric Sci-ences, Cornell University, Ithaca, New York, 1992. [14] D. J. Alan, L. C. Miguel, V. M. Daniel and E. R. David,
[15] L. R. Donald and R. A. Gillian, “Modeling the Fate of Reclaimed Water Constituents after Application to Tree Crops,” US Geological Survey (USGS), Water Resources Research Grant Proposal, School of Forest Resources and Conservation, University of Florida, Gainesville, 2004. [16] C. Ramos and E. A. Carbonell, “Nitrate Leaching and
Soil Moisture Prediction with the LEACHM Model,” Nu- trient Cycling in Agroecosystems, Vol. 27, 1991, pp. 171- 180.
[17] J. M. Jemison, J. D. Jabro and R. H. Fox, “Evaluation of LEACHM: II. Simulation of Nitrate Leaching from Ni- trogen-Fertilized and Manured Corn,” Agronomy Journal, Vol. 86, No. 5, 1994, pp. 852-859.
doi:agronj1994.00021962008600050019x
[18] O. Christen, “Waste Management Issues, Including Re- covery and Sustainable Food and Agriculture,” Interdis- ciplinary and Sustainability Issues in Food and Agricul- ture, Vol. 1, No. 1, 2007, pp. 1-6.
[19] INM, “Methods Manual, Soil Testing in India, Depart- ment of Agriculture & Cooperation Ministry of Agricul- ture Government of India,” 2011.
http://agricoop.nic.in/dacdivision/MMSOIL280311.pdf [20] R. Webber, “Graduate Students ‘NSPIRED’ by Nitrogen
Policy Research,” Washington State University, 2011. http://alumni.cahnrs.wsu.edu/connections/nspire/
[21] J. F. Sanchez, “Water and Nitrate Movement in Poultry Litter Amended Soils,” PhD Dissertation, University of Florida, Gainesville, 2004.
[22] F. C. Sharmasarkar, S. Sharmasarkar, R. Zhang, G. F. Vance, S. D. Miller and M. J. Reddy, “Modeling Nitrate Movement in Sugarbeet Soils under Flood and Drip Irri- gation,” ICID Journal, Vol. 49, No. 1, 2000, pp. 43-54. [23] J. M. Davidson, D. A. Graetz, P. S. C. Rao and H. M.
Selim, “Simulation of Nitrogen Movement, Transforma-
tion, and Uptake in Plant Root Zone,” University of Flor-ida, Environmental Research Laboratory, Athens, 1978. [24] M. C. McCenahan and G. A. Ferguson, “Phosphorus and
Nitrate Calorimetric Determinations by Autoanalyzer,” Cornell Nutrient Analysis Laboratories, In Methods for Soil Fertility Analysis, pp. 7-16, Procedure No s1101. Cornell University, Ithaca, 1987.
[25] J. D. Snyder and J. A. Trofymow, “A Rapid Accurate Wet Oxidation Diffusion Procedure for Determining Or-ganic and InorOr-ganic Carbon in Plant and Soil Samples,”
Communications in Soil Science and Plant Analysis, Vol. 15, No. 5, 1984, pp. 587-597. doi:00103628409367499 [26] A. Klute, “Methods of Soil Analysis: Part I, Physical and
Mineralogical Methods,” Soil Science Society of America, Madison, 1986.
[27] G. R. Blake and K. H. Hartge, “Bulk density In Methods of Soil Analysis, Part 1: Physical and Mineralogical Methods,” 2nd Edition, SSSA Book Series 5, Madison Wisconsin, 1986.
[28] A. Klute and C. Dirksen, “Hydraulic Conductivity and Diffusivity: Laboratory Methods,” In: A. Klute, Ed., Me- thods of Soil Analysis, Part 1, Physical and Mineralogi- cal Methods, 2nd Edition, American Society of Agron- omy, Madison, 1986.
[29] G. W. Gee and J. W. Bauder, “Particle-size Analysis in Methods of Soil Analysis, Part 1, Physical and Minera- logical Methods,” 2nd Edition, Agronomy Monograph 9, American Society of Agronomy, Madison, 1986.