Integrated Future Needs and Climate Change
on the River Niger Water Availability
Gaston Lienou
Departement of Earth Sciences, University of Yaounde I, Yaounde, Cameroon Email: [email protected]
Received February 6, 2013; revised March 19, 2013; accepted April 3, 2013
Copyright © 2013 Gaston Lienou. This is an open access article distributed under the Creative Commons Attribution License, which permits unrestricted use, distribution, and reproduction in any medium, provided the original work is properly cited.
ABSTRACT
The river Niger is the 3rd longest river in Africa, with a stream length of 4200 km, a drainage basin of 2,170,500 km2 of which 1,500,000 km2 is an active basin, and an average discharge of about 6000 m3/s. The natural variability of its rain-
fall and discharge is analyzed for several major sub-basins, in the context of the West African drought which has lasted for nearly 40 years, showing two paradoxes: the increase of Sahelian runoff since the beginning of the drought due to land degradation, and the steep decrease of sudanian runoff over the same period, substantiated by the long-lasting de-crease of the groundwater tables. Much information about the water resources available in the basin is collected and analysed by the NBA1, which is summarized in this paper including surface water resources, rainfall over the basin,
existing and projected dams. The river Niger is deficient in dams to control water, especially in its upper and middle basins. Nigeria has many dams, including large dams, while Burkina Faso has many small dams, but there are only a few dams upstream of the river Niger in Mali/Guinea/Ivory Coast. It is therefore likely that several dams will be built in the Niger basin in the coming years, and several are in the project phase. All of these will have a large impact on the river Niger regime and the environment, especially the Fomi dam which will change significantly the river regime up-stream of the inner Delta, inducing an important reduction of the flooded area, and the Tossaye dam on the Saharan border of Mali which could promote a very significant level of evaporation. It is very important before building these dams to take into account the past years variability of climate and river regime.
Keywords: Drought; River Niger; Sahel Desert; Water Resources; Water Accessibility
1. Introduction
The West African drought has now extended for nearly 40 years. It has had tragic consequences in the Sahel countries, such as desertification. This drought, which is notably characterized by a decrease of rainfall, decrease in surface water flows and with changes in the rainy sea-son characteristics all contribute to reduce the water availability in the Niger River basin. This shift in climate characteristics must be born in mind if one wants to un- derstand the present hydrology and water uses in the ba- sin.
The river Niger rises in the Futa Jallon Highlands in Guinea with an average altitude of 1100 m. It flows north east and during the rainy season forms a vast flood plain in Mali known as the inland Delta. Away from the inland Delta the river meanders in Mali then flows south east to Nigeria where it is joined by the River Benue and emp- ties into the Atlantic Ocean. Nine countries sharing the
active basin are members of the Niger Basin Author- ity (NBA): Benin, Burkina Faso, Cameroon, Guinea, Ivory Coast, Mali, Nigeria, Chad and Niger. Algeria has an important part of the inactive desert basin.
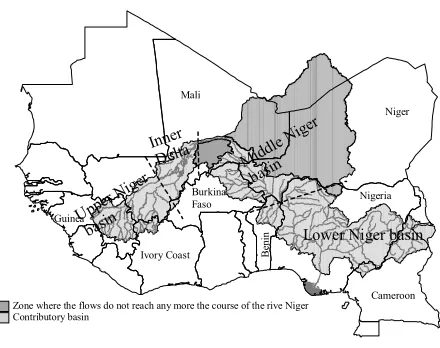
From the stand point of water resources, the Niger ba- sin can diagrammatically be divided into four zones with more or less homogenous physical and geographical characteristics (Figure 1):
1) The Upper Niger Basin is located in Mali, Guinea, and Ivory Coast. It has an area of 257,000 km2, of which
140,000 km2 are situated in Guinea, serving as the major
watershed and is seen as the dominant portion which can be used to partially regulate water flow throughout the length of the river.
2) The inner Delta is entirely situated in Mali, cover- ing a rectangular area facing south west and north east with a length of 420 km and a width of 125 km between Ke-Macina and San in the south and Timbuktu in the north. It has a surface area of 84,000 km2 and comprises
four agro-ecological zones: the living Delta, the middle
G. LIENOU 888 Upper Niger basin Inner
Delta Middle N
iger
basin
Lower Niger basin
Cameroon Niger Nigeria Burkina Faso Mali Be ni n Ivory Coast Guinea Contributory basin
[image:2.595.65.285.81.255.2]Zone where the flows do not reach any more the course of the rive Niger
Figure 1. Niger River basin.
Bani-Niger, the dead Delta and the lacustrine zone be- tween Gao and Timbuktu. It accounts for almost all of the rice cultivation which is the staple food in Mali. This is done thanks to irrigation from the Markala Dam.
3) The Middle Niger Basin lies within Mali, Niger, Benin and Ivory Coast. It stretches from Timbuktu to Benin, covering an area of 900,000 km2, 230,000 km2 of
which are inactive. It is made up of a series of irrigated terraces. Water flow in this basin largely depends on ad- ditional influx from the inland Delta and navigation is hampered by waterfalls.
4) The lower Niger Basin lies between Cameroon, Ni- geria and Chad. It is characterized by large dams for hy- dro-electric power production, irrigation and for indus- trial activities throughout the basin. Energy production is mainly derived from the Kainji, Lagdo and Jebba dams which supply 68% of Nigeria’s electricity needs and 22% of her total energy needs.
2. Water Resources in the Basin and Their
Variability
Inventories of data are available by consulting the data base of the NBA and the SIEREM base from Hydro- Sciences Montpellier Laboratory. Direct observation of surface water flow on the topographic slope of the Niger enables us to realize that some parts are not hydraulically linked to the river. These include the Algerian section of the basin (the Tassir Oua Ahaggar region) and those of Tamesna and Tahoua found in Mali and Niger. The large tributaries of the Niger which used to drain these regions at humid times, presently exist only as dry valleys cov- ered by a great thickness of sand. Even the Continental Terminal aquifer found in the Iullemeden Sedimentary Basin is cut off from the hydrological system of the river Niger [1]. The same situation exists with the Gando and the Liptako regions at the boundary between Mali and Burkina Faso.
2.1. Rainfall and Climatology
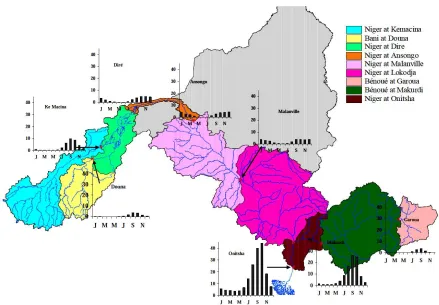
The rainfall regime of the Niger River depends on the fluctuations of the Atlantic Monsoon which generally occurs between May and November. The intensity of the phenomenon is relatively homogenous on the east-west axis but experiences a serious gradient on the north- south axis following the scale of the basin. There are 530 rainfall stations and 105 climatic stations with at least 20 years of observations. Data from Nigeria and Guinea are difficult to obtain. The average annual rainfall rises to 2000 mm in portions further south in the basin, while it decreases to less than 400 mm in the north under Sahe- lian and semi-desert climate (Figure 2).
2.2. Flows
2.2.1. Rainfall-Runoff Variability
The hydrologic times series for the Niger began in 1907 with the installations of stations in Koulikoro (Mali) and Jebba (Nigeria). The present hydrologic observation is estimated at 250 stations including the specific network meant to check the river flow within the framework of the Hydroniger Programme. The volumes discharged are lower in the upper basins, and increase markedly when entering Nigeria where rainfall is now heavier over the Niger basin (Figure 3). The hydrological regimes strong-
ly change for the upper Niger when passing through the inland Delta, where the flood flow is delayed by two to three months, and is reduced from 24% to 48% during extremely dry years.
The river Niger basin has been submitted to a strong rainfall deficit since 1970, which has occurred over the whole basin. All the sub-basins experienced a reduction of runoff. The 80s are the driest decade since the begin- ning of the 1900s (Figure 4). The rainfall deficit is less
in the southern part of the basin, mainly over the Benue river basin. However the Niger basin can be divided into three main areas: the upper basin of the river Niger in Guinea, Mali and Ivory Coast, where the runoff deficit is very large (Figure 5); the lower river Niger basin, in-
cluding the Benue river, where the runoff deficit is lim- ited; and the Sahelian tributaries, mainly in Mali, Burk- ina Faso and Niger, where the runoff has increased, due to changes in land-use (Figure 6).
In the Sahelian parts of the basin runoff coefficients have seriously increased, which has led to higher flood peaks, erosion, sediment transport and dam silting (Fig- ure 6). This is linked partly to the climate change-related
rainfall reduction, but mainly to the increase of the culti- vated surfaces, and the related disappearance of the natu- ral vegetation. In Soudano Guinean parts of the Niger River basin, the runoff decrease has been much more than that of the rainfall, due to the cumulative (memory)
ffect of the rainfall lasting shortage on the groundwater e
Figure 2. Niger River basin: climatic zones and monthly rainfall illustrations.
Figure 3. Monthly average volumes (in billion of m3) (1960-1990).
levels [3].
2.2.2. Groundwater Resources
Discontinuous aquifers are mainly found on the right bank in the Niger (Guinea, Mali, Ivory Coast, Burkina
[image:3.595.77.516.343.648.2]G. LIENOU 890
-15.00 -10.00 -5.00 0.00 5.00 10.00 15.00 20.00 5.00
10.00 15.00 20.00
-15.00 -10.00 -5.00 0.00 5.00 10.00 15.00 20.00
5.00 10.00 15.00 20.00
-15.00 -10.00 -5.00 0.00 5.00 10.00 15.00 20.00
5.00 10.00 15.00 20.00
-15.00 -10.00 -5.00 0.00 5.00 10.00 15.00 20.00 5.00 10.00 15.00 20.00 -1. 3 -1. 1 -0. 9 -0. 7 -0. 5 -0. 3 -0. 1
0.1 0.3 0.5 0.7 0.9 1.1 1.3 1.5
ORSTOM - programme FRIEND AOC ORSTOM - programme FRIEND AOC
ORSTOM - programme FRIEND AOC ORSTOM - programme FRIEND AOC
1950 1960
1970 1980
d閒icit exc閐ent
[image:4.595.69.526.82.375.2]Deficit Surplus
Figure 4. Rainfall index over the river Niger basin [2]. Niger ? K oulikoro
-1 .00 -0 .50 0 .00 0 .50 1 .00 190 5 19 14 192 3 19 32 194 1 195 0 195 9 196 8 197 7 198 6 199 5
An n? s
Eca
rt
s
Niger at Koulikoro
Year
Figure 5. Rainfall-runoff (bars-line) in the Soudano Gui-nean part of the river Niger in Mali and Guinea.
0 5 10 15 20 25 30
1958 1963 1968 1973 1978 1983 1988 1993
Year N b of s tat io ns -0 1 2 R a in fa ll a n d r u no ff s td d evi a tio n
Rainfall Runoff
Figure 6. Rainfall-runoff relationships in Sahelian tributar-ies of the river Niger.
[image:4.595.62.289.405.520.2]be found in large sedimentary forms, especially on the right bank of the Niger River (Mali, Niger, Chad, Nigeria and Cameroon). The Iullemeden aquifer system, shared by Mali, Niger and Nigeria, designates a group of sedi- mentary deposits containing two major aquifers: the In-tercalary Continental (IC) at the bottom and the Conti- nental Terminal (CT) at the top [1]. On plateau surfaces, superficial aquifers are superimposed on the deeper aq- uifers. The outer aquifers can be considered to be semi- continuous thereby forming a hydraulic link with the deeper layer or it can be discontinuous.
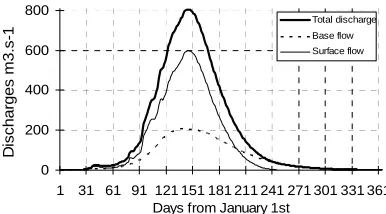
Figure 7 shows the importance of the baseflow in the
annual runoff. This is for the Bani at Douna, but this is representative of most of the River Niger tributaries of Guinea, Mali, Ivory Coast and Cameroon, under Sou- dano Guinean climate.
3. Accessibility to Water and Its Uses
3.1. Reservoirs
Much information about the dams in the river Niger ba-sin is collected and analysed by the NBA [5]. Dams can be classified into two main groups: those existing and those still in the project planning phase.
3.1.1. The Existing Dams
[image:4.595.63.283.557.709.2]0 200 400 600 800
1 31 61 91 121 151 181 211 241 271 301 331 361 Days from January 1st
D
is
c
har
ges
m3.s
-1
Total discharge
[image:5.595.311.536.83.188.2]Base flow Surface flow
Figure 7. Annual hydrograph for the Bani River at Douna. Total runoff (bold line)/Surface runoff (thin line)/Base flow (dashed). Average 1984-1996 [4].
Figure 8. Niger Basin: Situation of existing dams.
and there is a concentration in some sections of the basin, in Burkina Faso (mainly small dams) and in Nigeria (all sizes including large dams).
Capacity of dams varies between 25 × 10−3 million m3
(Camp de chasse, Tapoa, Niger) to 16 billion m3 (Kainji,
Nigeria). Figure 9 shows the class distribution of the
capacity of all the identified dams. From this distribution 50% of them are small dams of less than 1 million m3,
and there are only six “giant” dams (more than 1 billion m3): one in Mali and Cameroon and four in Nigeria.
An evaluation of the capacity of the existing dams places the total volume at 42 billion m3 which represents
27% of the water influx from the Nigerian Onitsha be- tween the dry periods of 1971 and 2001; and 22% of the same influx in the same station during the rainy seasons between 1929 and 1970. This situation reflects the low utilisation of water resources in the Niger and its tribu- taries.
3.1.2. Projected Dams
Seventy dams are projected for the basin of the river ger, mainly in the middle and upper Niger valley, in Ni-ger, Burkina Faso, Mali and Guinea. The only projected sites for construction works in the lower Niger are those of Makurdi, Lokoja and Onitsha (Figure 10).
Projected capacities reach 6 billion m3 (Fomi site on
[image:5.595.75.268.84.191.2]the Niandan in Guinea). The capacity of the projected dams for the entire basin is about 48 billion m3 as against
[image:5.595.314.532.208.342.2]Figure 9. Class distribution of the capacity of dams.
Figure 10. Niger River basin, situation of projected dams.
42 billion m3 for the existing ones. More than 80% (39
billion m3) has been designed to be stored in the Upper
Niger and 20% only (9 billion m3) to be kept in the Mid-
dle Niger.
Considering the existing and projected dams in the Upper Niger, the volume of water stored will be slightly above 41 billion m3. If this figure is compared to the
discharged volume at the entry point of the inland Delta (Ke-Macina and Douna) which is 75 billion m3 in a wet
year and 21 billion m3 in a dry year, then it means that
more than 55% of all flows will be stored in a wet year and flows in a dry year in the upper basin will be insuffi- cient to fill all the reservoirs. This situation which has been exacerbated by the drought will have drastic con- sequences on the lower Delta.
3.2. Down-Stream Depletion
3.2.1. Depletion for Purposes of Irrigation
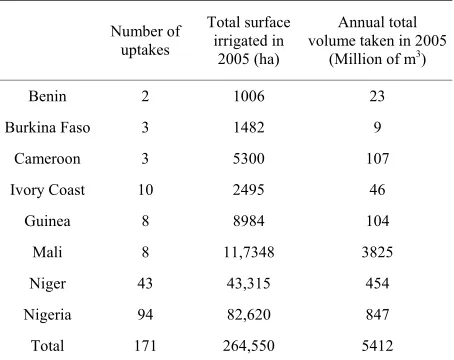
171 retention points for irrigation purposes have been identified along the Niger and its tributaries [6]. Ap- proximately 5412 billion m3 are extracted annually to
irrigate a surface area of 264,550 ha, giving an average of 20,000 m3 per inhabitant. The retained volume from
each country depends on the surface of the basin slope of the country concerned (Table 1). In this connection the
largest volume is kept aside in Mali, followed by Nigeria and Niger.
3.2.2. Retention for Potable Water Supply
[image:5.595.62.285.238.378.2]G. LIENOU 892
Table 1. Retained volumes and irrigated surface area per country.
Number of uptakes
Total surface irrigated in
2005 (ha)
Annual total volume taken in 2005
(Million of m3)
Benin 2 1006 23 Burkina Faso 3 1482 9
Cameroon 3 5300 107 Ivory Coast 10 2495 46
Guinea 8 8984 104 Mali 8 11,7348 3825 Niger 43 43,315 454 Nigeria 94 82,620 847
Total 171 264,550 5412
Niger and its tributaries to supply many towns with pota- ble water. The estimations are for 2005 based on 20 L per inhabitant per day for the rural areas and 40 L per inhabitant per day for the urban agglomerations.
3.2.3. Potable Water Retentions for Livestock Breeding
The estimate of reserved volumes for livestock is diffi- cult because of its diffused nature. Calculation of water needs associated with livestock is based on a need for 30 L per UBT per day. Estimates show in 2005, about 223.6 million m3 of water was used for about 2771000 U.B.T.
The largest reserved volumes are found in those coun- tries with the largest areas of land within the basin (Ni- geria, Niger). Mali is noted for its livestock numbering 8640000 U.B.T. However, reserved water for livestock is small (14.2 million m3).
But it should be noted that part of the riverine popula- tion gets its water from the water-bearing beds of the river. The results of many estimates give this as the maximum level of extraction without taking into account other sources of water.
4. Change in Water Availability
The Case of the Niger River Inner Delta in Mali
For the Niger inner Delta, an integrated model of the Niger inner Delta called MIDIN has been developed. It integrates several relationships between water, biology and human activities along the different hydrological entities including channels, lakes and floodplains.
Figure 11 shows the correlation between the flooded
surfaces, as depicted by NOAA images between 1990 and 2000, and the water heights at the main gauging sta- tion of Mopti in the Delta. This correlation allows the flooded area of the upper Delta area to be determined
Figure 11. Correlation between water height and flooded area in the upper inner Delta, Mali.
according to the Mopti water level. This relationship al- lows the prediction one month in advance the water height in the Northern part of the Delta (North of the cen- tral lakes) from the water height at Mopti.
5. Conclusion
Nigeria has many dams, including very large dams, while Burkina Faso has many small dams. However there are only a few dams upstream of the river Niger in Mali/ Guinea/Ivory Coast. It is therefore likely that several dams (including a few very large dams such as in Fomi in Guinea) will be built in the Niger basin in the coming years. It is very important before building these dams to take into account the past years variability of climate and river regime. It is particularly important to consider the very marked runoff decrease in the tropical humid sub-basins, and the runoff increase in the Sahelian ones.
It is also noticeable that most of the GCM outputs pre- dict a rainfall reduction still to come during the next decades of the 21st century. Several tools such as Water
Use Account, MIDIN and rainfall/runoff modelling should be implemented at NBA, to be used as prediction tools.
REFERENCES
[1] OSS, “Iullemeden Aquifer System (Mali, Niger, Nigeria): Concerted Management of Shared Water Resources of Sahelian Transboundary Aquifer,” Synthesys Collection, No. 2, Tunis, 2008, 33 p.
[2] J. E. Paturel, E. Servat, G. Mahé, J. P. Bricquet, H. Lubès-Niel and J. C. Olivry, “Variations Hydroclimati- ques sur le Bassin du Niger,” Acta Hydrotechnica, Vol.
15, No. 19, 1997, pp. 169-173.
[3] G. Mahe, J. E. Paturel, E. Servat, D. Conway and A. Dezetter, “The Impact of Land Use Change on Soil Water Holding Capacity and River Flow Modelling in the Na-kambe River, Burkina-Faso,” Journal of Hydrology, Vol.
300, No. 1-4, 2005, pp. 33-43.
[image:6.595.59.286.112.292.2]de l’Académie des Sciences, Série IIa, Vol. 330, No. 10,
2000, pp. 689-692.
[5] ABN, “Elaboration du Plan d’Action de Développement Durable du Bassin du Niger; Phase I: Bilan-Diagnostic,”
Rapport Définitif, 2007.