Estimation of Global Solar Radiation for Four Selected
Sites in Nepal Using Sunshine Hours, Temperature and
Relative Humidity
Krishna R. Adhikari1*, Binod K. Bhattarai1, Shekhar Gurung2
1Institute of Engineering, Tribhuvan University, Kathmandu, Nepal; 2Central Department of Physics, Tribhuvan University, Kath-
mandu, Nepal.
Email: *adhikari.krishnaraj@gmail.com
Received August 9th, 2013; revised August 23rd, 2013; accepted August 30th, 2013
Copyright © 2013 Krishna R. Adhikari et al. This is an open access article distributed under the Creative Commons Attribution Li- cense, which permits unrestricted use, distribution, and reproduction in any medium, provided the original work is properly cited.
ABSTRACT
Rational and accurate solar energy databases, essential for designing, sizing and performing the solar energy systems in any part of the world, are not easily accessible in different localities of Nepal. In this study, daily global solar radiation, sunshine hours and meteorological data for Biratnagar, Kathmandu, Pokhara and Jumla have been used to derive the regression constants. The linear regression technique has been used to develop a model for Biratnagar, Kathmandu, Pokhara and Jumla. The model has calculated the global solar radiation for these locations. The values of global solar radiation estimated by the model are found to be in close agreement with measured values of respective sites. The esti- mated values were compared with Angstrom-Prescott model and examined using the root mean square error (RMSE), mean bias error (MBE), mean percentage error (MPE), coefficient of regression (R), coefficient of determinant (R2) and
correlation coefficient (CC) statistical techniques. Thus, the resultant correlations and linear regression relations may be then used for the locations of similar meteorological/geographical characteristics and also can be used to estimate the missing data of solar radiation for the respective site.
Keywords: Global Solar Radiation; Clearness Index; Sunshine Hours; Linear Regression Relation; Model
1. Introduction
Nepal is a land-locked mountainous country with a large area of beautiful landscape situated between 26˚22' to 30˚27' North latitude and 80˚40' to 80˚12' East longitude within a span of 200 km from south to north and about 800 km from east to west [1]. The total area of the coun- try is 147,181 square kilometers and is divided into five physiographic regions: High Himal, High Mountain, Middle Mountain, Siwalik (the Chure Range) and the Terai [2].
Nepal has more than 6000 rivers with all river systems draining north to south towards the Ganges [2] and its theoretical, technical and economically feasible hydro- power potential has been estimated at about 83,000 MW, 45,000 MW and 42,000 MW respectively [1]. The cur- rent installed capacity of power plants connected to the national grid is 689 MW whereas peak demand of power for the year of 2011 was 946.10 MW and projection of
power demand for 2012/2013 was 1163.2 MW [3]. The electricity consumption and the number of consumers increase at a rate of approximately 9% per year [4] whereas generation of additional power plant is almost in stagnant situation. This gap between supply and demand in power sector forces Nepal Electricity Authority into load-shedding from 4 hours to 16 hours per day in spring and dry season respectively [5].
topographical conditions [1] to be established and run. All the above facts demand a shift of the emphasis to the new and clean alternative energy sources to replace costly and unrealistic sources and ensure sustainable de- velopment of the country.
In the year of 2008/2009, total energy consumption in Nepal was 401 million GJ, out of 87% of total energy consumption was derived from traditional resources (also called biomass energy resources), 12% from commercial sources (coal, grid electricity, and petroleum products) and less than 1% from the alternative sources (biogas, solar power, wind and micro/pico level hydropower) [1]. The average global solar radiation in Nepal varies from 3.6 - 6.2 kWh/m2·day; the sun shines for about 300 days
a year, the national average sunshine duration is 6.8 hours/day and average insolation intensity about 4.7 kWhm−2·day−1 (=16.92 MJ/m2·day) [1], it is greater than
the 15.8 MJ/m2·day measured by Solar Energy Research
Laboratory, Department of Physics, Silpakorn University, Thailand for Lao PDR [7]. The data is based on one year’s several sites of Nepal. With the consideration of 12% efficiency of PV module and 4.7 kWh/m2·day1 of
insolation intensity, the total energy generation potential of the country will be 83,000 GWh/day = 18.36 TW. This is more than present energy demand (13 TW) of the world [1]. Under this circumstance, the development of solar energy technology in many parts of the country and especially in rural sectors is desirable and favorable where there is no viable alternative to the solar electricity [1].
Choice of solar energy, in countries like Nepal, is the best and ultimate option among the different energy in- cluding alternative energy sources. If we think of com- plete solution of rural electrification in Nepal, we have to plan to link up micro-hydro/pico-hydro with solar energy exploitation. Thus, an accurate knowledge and database of solar radiation at a particular place and selected sites are important for the development of many solar devices, the establishment of solar plant at the proposed site and for estimation of their performance [8].
The radiation reaching the earth surface is modified significantly by clouds [9], water vapor, ice, aerosols, and atmospheric constituents in its intensity and the sun- shine duration. The beam radiation (radiation coming directly from the solar disk) is attenuated by the presence of cloud in its path, as well as by the various atmospheric elements. The depletion of the direct beam by the cloud depends on the type of clouds, their thickness and the number of layers [10]. The radiation scattered by the atmospheric constituents is called diffuse radiation where a portion of this radiation goes back by about 6% of the incident radiation to space, and a portion, about 20% of the incident radiation, reaches the earth surface [11]. The
sum of direct and diffuse radiation on the earth surface is known as global/total radiation which is very important for the design of certain solar energy applications [10].
In developing countries like Nepal, the facility of ground-based measurement of solar radiation is available only at selected sites whereas meteorological and hydro- logical data are available at different parts of the country. Obviously the best way of knowing the amount of global solar radiation at the site of consideration is to install pyranometer at many locations in the given region and look after their day-to-day maintenance and recording, which is a very expensive venture. The alternative ap- proach is to correlate the global radiation with the mete- orological parameters where the data can be collected. The resultant correlation may then be used for locations of similar meteorological characteristics [12]. Thus, de- veloping the empirical model to estimate the global solar radiation using easily available parameters such as sun- shine duration, maximum and minimum temperature, relative humidity, rainfall and geographical location, etc., is an essential assignment for countries like Nepal, which will be a vigorous scientific research. So far, various models have been developed by a number of researchers with different regression coefficients using linear regres- sion techniques [13] for various countries and for differ- ent locations to estimate solar radiation. The most and commonly used model in most of the countries including Nepal is Angstrom-Prescott model which is based on correlation of global solar radiation with sunshine hours.
Available literatures show that there is a very few and limited study done in Nepal to develop the model and to calculate the regression coefficients. This may be due to inadequacy of existing solar energy data and lacking sense of necessity to develop solar energy techniques. Either the researchers may have been satisfied with the available data or our research culture may be such that the research works are not well tied up with our ground reality.
Empirical models which have been used to calculate solar radiation are usually based on astronomical factors, geographical factors, geometric factors, physical factors and meteorological factors [14].
In the present study, annual radiation, meteorological/ hydrological data have been used to derive the regression coefficients b, c, d and intersection constant a to develop a model based on linear regression technique to estimate the monthly average daily global solar radiation for four sites of Nepal, and to compare the values with the esti-mations derived from sunshine-based Angstrom-Prescott model. The linear regression relation of the model is
ln
m av
O d M
H n T
a b c d RH
H N T
(1)diation on horizontal surface in MJ/m2·day,
O H
monthly mean daily extraterrestrial radiation on horizon- tal surface in MJ/m2·day, n monthly mean daily sun-
shine hours, Nd monthly average maximum possible
daily hours of sunshine or the day length, Tav and TM
are monthly mean of daily mean and monthly mean daily maximum temperature in Kelvin scale, RH monthly mean daily relative humidity, ln natural logarithm and a,
b, c, d are constants obtained by the linear regression analysis.
2. Material and Method
The primary data of daily solar radiation on horizontal surface for Biratnagar, Kathmandu, Pokhara and Jumla were collected from the archives of the Department of Hydrology and Meteorology, government of Nepal (DHM/GoN) and Solar Radiation and Aerosol in Hima- layan Region (SAHR) project of Institute of Engineering, Tribhuvan University, Nepal. Daily sunshine duration, temperature and relative humidity data for these sites were obtained from Department of Hydrology and Mete- orology (DHM)/GoN. The data obtained covered a pe- riod of years from 2007 to 2012 for Biratnagar (latitude 26.483˚, longitude 87.266˚ and altitude 72 m), Kath- mandu (latitude 27.7˚, longitude 86.366˚ and altitude 1337 m), Pokhara (latitude 28.216˚, longitude 84˚ and altitude 827 m) and two years 2011 to 2012 years for Jumla (latitude 29.283˚, longitude 82.166˚ and altitude 2300 m). The most widely used ORIGIN/Microsoft Of- fice Excel softwares have been used for the data analysis.
2.1. Theory
The acquired data were processed in Microsoft Office Excel to obtain useful form i.e., daily extraterrestrial so- lar radiation in MJ/m2, daily global radiation in MJ/m2,
the ratio of daily mean of maximum and minimum tem- perature to daily maximum temperature in Kelvin scale and natural logarithm of average value of daily relative humidity data of the year 2007-2012 for Biratnagar, Kathmandu and Pokhara and those of 2011-2012 data for Jumla.
The proposed linear regression relation (empirical mo- del) to estimate global solar radiation is given below:
ln
m av
O d M
H a b n c T d RH
H N T
where, a, b, c, and d are regression constants, the ratio
m
O
H
H is clearness parameter or cloudiness index, d n N
fraction of sunshine hours, and
O
H is the monthly average daily extraterrestrial
radia-tion on the horizontal surface given by Iqbal (1983) as follows:
sin si
24 π
π 180 n cos cos sin
O sc o s s
H I E
(2) where,
2 1
1367 3600
MJ m h 1000000 · sc
x
I (3)
is the solar constant,
360 1 0.33cos
365 o
N
E (4)
is the eccentricity correction,
N is the day number of the year (DoY)/Julian day (1 Jan, N = 1 and 31st December, N = 365), ϕ is the latitude of the site,
360 284 23.45sin 365 N (5)
is the solar declination,
1
cos tan tan
s
(6)
is the hour angle,
1
2 cos tan tan 2
15 15
d s
N (7)
is the maximum possible sunshine hours.
2.2. Developing a Model
The data presented in Table 1 has been used to evaluate the regression constants a, b, c and d for the year men- tioned in the table and the same technique used for other years too. Three years’ values were averaged to derive the final regression constants presented in Table 2.
To analyze these data further, the first order linear re- gression equation was employed as given below:
T
a bx cy dz K (8)
It is an equation of least square line [15] or first order regression [16] where, KT (= Hm/Ho) is a dependent vari-
able called clearness index, a, b, c, d are regression con- stants, and
, av , ln
d M
T n
x y z R
N T
H
are independent variables and the earlier explained me- teorological parameters.
To perform the regression analysis of least square line, both sides of the Equation (8) have to be multiplied by 1,
Table 1. One year sum of different metrological parameters for four sites in Nepal to derive regression constants and used meteorological data of the years.
Locations ∑n/Nd ∑Tav/TM ∑ ln (RH) ∑KT = Hm/HO Used 1 Year Data Data of Years
Biratnagar 188.722 358.554 1579.288 171.751 2010, 365 days 2007, 2008, 2010
Kathmandu 198.129 356.3063 1574.593 175.878 2010, 365 days 2007, 2008, 2010 Pokhara 202.645 358.0092 1561.1 197.246 2010, 365 days 2008, 2010, 2012 Jumla 221.566 354.8842 1487.16 227.936 2011, 365 days 2011, 2012
Table 2. Regression constants, comparison of errors and regression coefficient for different models and sites.
Regression constants RMSE MBE MPE% R R² CC
SN Locations
a b c d Ang New Ang New Ang New Ang New Ang New New
1 Biratnagar −2 E−07 0.162 1.032 −0.168 1.94 0.86 −0.873 −0.10 6.31 0.79 0.81 0.956 0.66 0.914 0.96 2 Kathmandu −1 E−04 0.324 −0.09 0.08 4.15 1.197 −2.32 0.866 11.52 0.34 0.7 0.948 0.44 0.898 0.93 3 Pokhara −8 E−06 0.337 −0.21 0.120 2.82 0.750 −0.6 −0.14 2.35 1.0248 0.61 0.97 0.37 0.94 0.99
4 Jumla −1.4 E−06 0.384 0.40 −0.001 4.40 1.6 −2.35 0.425 10.5 −2.64 0.49 0.87 0.24 0.75 0.86
T
aN b
x c
y d
z K (9)2
T
a
x b
x c
xy d
xz
K x (10)2
T
a
y b
yx c
y d
yz
K y (11)2
T
a
z b
zx c
zy d
z
K z (12) These four Equations (9) to (12) were used to evaluate the regression constants a, b, c and d of three years for Biratnagar (BRT), Kathmandu (KTM), and Pokhara (PKR) separately and calculate the average value of respective parameters and the same was done for Jumla (JUM) by using the data of the 2 years.2.3. Data Analysis
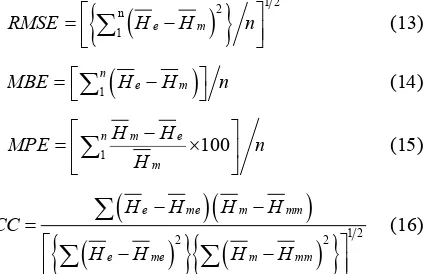
The accuracy of the estimated values was tested by using the statistical techniques for the Angstrom-Prescott mo- del and for the new proposed model based on the defini- tion devised by Iqbal (1983) which is as below:
1 22 n
1 e m
RMSE H H n
(13)
1
n
e m
MBE
H H n (14)1 100
n m e
m
H H
MPE n
H
(15)
2
1 2e me m mm
e me m mm
H H H H
CC
H H H H
2
(16)
where n is the total numbers of observations, He and m
H are monthly mean measured and estimated values
and Hmm and Hme are mean of measured and esti-
mated values respectively. Calculated values of different parameters in organized form with coefficient of regres- sion, R and coefficient of determinant, R2 derived from
the plots for the statistical analysis are presented in the Table 2.
The above mentioned statistical indicators are used to examine the performance of the model of solar radiation estimation. In general, low values of root mean square error (RMSE), mean bias (MBE) and mean percentage error (MPE) are desirable. RSME test provides informa- tion on the short-term performance whereas MBE and MPE test provide information on the long-term perform- ance. The positive MBE points out the overestimation and negative MBE shows the underestimation [17] of the radiations. Ideally correlation coefficient (CC), coeffi- cient of regression (R) and coefficient of determinant (R2)
should be 1 for the best performance.
3. Result and Discussion
One year’s input parameters and three/two years data were used to evaluate the regression constants, to de- velop the linear regressions equations and hence estimate monthly mean daily solar radiation
He at four se-lected sites in Nepal as presented in Table 1. Table 3 presents the three years’ monthly mean daily extraterres- trial solar radiation, clearness index, fraction of sunshine duration, ratio of average to maximum temperature and natural logarithm of average humidity at four locations in Nepal.
Table 3. Monthly mean of daily solar and meteorological data.
O
H KT n Nd T Tav M LN RH
BRT KTM PKR JUM BRT KTM PKR JUM BRT KTM PKR JUM BRT KTM PKR JUM BRT KTM PKR JUM
Jan 23.4 22.7 22.4 21.7 0.32 0.42 0.55 0.69 0.45 0.62 0.65 0.81 0.98 0.97 0.98 0.97 4.4 4.36 4.33 3.95 Feb 27.8 27.2 27 26.3 0.35 0.42 0.54 0.63 0.56 0.67 0.65 0.69 0.98 0.97 0.98 0.97 4.3 4.29 4.25 3.95
May 33.6 33.2 33.1 32.6 0.41 0.4 0.48 0.69 0.64 0.6 0.59 0.74 0.98 0.97 0.97 0.96 4.13 4.17 4.13 3.87 Apr 38.9 38.7 38.7 38.4 0.4 0.42 0.48 0.59 0.64 0.64 0.6 0.56 0.98 0.97 0.97 0.97 4.12 4.04 4.09 3.95 May 42.2 42.2 42.3 42.3 0.41 0.37 0.49 0.6 0.59 0.52 0.56 0.53 0.98 0.98 0.97 0.97 4.22 4.19 4.21 3.99
Jun 43.4 43.6 43.7 43.8 0.38 0.34 0.46 0.57 0.43 0.44 0.43 0.39 0.99 0.98 0.97 0.97 4.38 4.28 4.36 4.05 Jul 42.8 42.9 43 43.1 0.31 0.31 0.4 0.46 0.34 0.3 0.33 0.28 0.99 0.99 0.98 0.97 4.44 4.4 4.4 4.12 Aug 40.3 40.2 40.1 40.1 0.32 0.31 0.44 0.48 0.4 0.28 0.36 0.28 0.99 0.99 0.98 0.97 4.43 4.42 4.4 4.14
Sep 35.6 35.2 35 34.9 0.35 0.38 0.49 0.59 0.46 0.44 0.48 0.54 0.99 0.98 0.97 0.97 4.43 4.4 4.4 4.09 Oct 29.6 29.1 28.7 28.4 0.42 0.48 0.62 0.71 0.61 0.64 0.73 0.82 0.98 0.98 0.97 0.97 4.37 4.37 4.32 3.95 Nov 24.4 23.7 24.1 22.8 0.44 0.5 0.63 0.73 0.7 0.69 0.79 0.84 0.98 0.97 0.97 0.96 4.33 4.39 4.28 3.88 Dec 22 21.3 21 20.3 0.43 0.47 0.56 0.7 0.62 0.6 0.7 0.82 0.98 0.97 0.98 0.96 4.38 4.41 4.31 3.86
0.31, Pokhara 0.4 and Jumla 0.46) and August indicating the overcast/cloud covered skies and more aerosols and maximum value was observed in November (Biratnagar 0.44, Kathmandu 0.5, Pokhara 0.63 and Jumla 0.73) and October suggesting the more clear skies with fewer aerosols. Similarly high values of sunshine hours were observed in November at all sites and among them high- est value (0.84) was at Jumla (latitude 29.283˚, and alti- tude 2300 m) and the least of maximum values (0.69) was at Kathmandu (latitude 27.7˚, and altitude 1337 m) because of high clearness index/sunshine hours. The values are minimum in July and August due to less clear- ness index/sunshine hours. Unexpected least values at Kathmandu indicate the more hazy and pollutant par- ticulates in the atmosphere above the Kathmandu valley.
Table 4 presents the measured and estimated monthly mean daily global solar radiation at four different sites of Nepal where their altitude varies from 72 m to 2300 m above the sea level. These values were estimated by us- ing the Angstrom-Prescott model and by the new pro- posed model.
The minimum measured and estimated monthly mean daily radiation on the horizontal surfaces for all sites were observed in January characterized by more cloudy/ foggy days. And maximum values were observed in May at Biratnagar, Pokhara and Jumla and in April at Kath- mandu which is characterized by more clear skies and less aerosols. Among four sites, maximum radiation (measured Hm = 25.21 MJ/m2·day and estimated He
= 25.25 MJ/m2·day) was observed at Jumla (2300 m
above the sea level) and minimum radiation (measured
m
H = 7.508 MJ/m2·day and estimated
e
H = 7.97 MJ/ m2·day) was observed at Biratnagar (72 m above the sea
level). The result showed the altitude and location de-
pendency of the radiation. The table also shows the close agreement of the measured and estimated values by the new proposed model.
The least values of root mean square error RMSE, mean bias error MBE and mean percentage error MPE indicate the best linear regression relations to estimate global solar radiation at Biratnagar, Kathmandu, Pokhara and Jumla in Nepal.
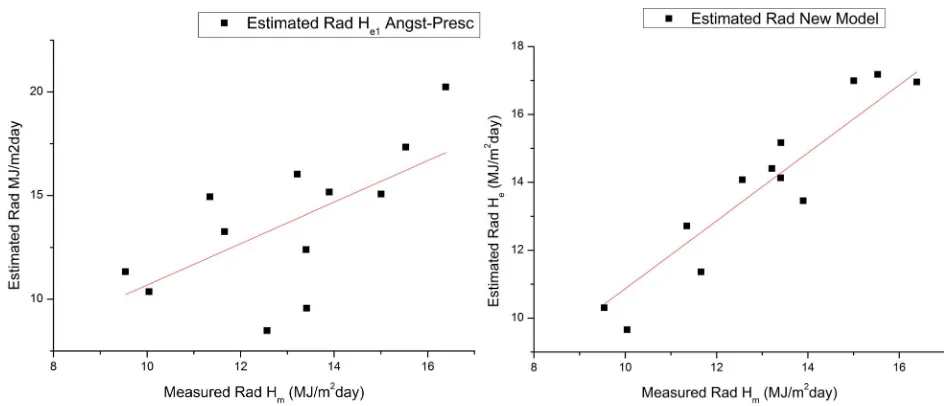
In this study, three additional statistical indicators were used to evaluate the accuracy and performance of new proposed model. The highest value of R (=0.97 at Pokhara) and minimum value of R (=0.87 at Jumla), the higher correlation coefficient CC (0.86 at Jumla to 0.99 at Pokhara) and the Figures from 1-5 of the plots of global solar radiations estimated by the Angstrom-Pres- cott and new proposed model proved the higher per- formance of the new proposed model in comparison to Angstrom-Prescott model and the value estimated by Poudyal, et al. [18].
4. Conclusions
Rational and accurate solar energy databases, essential for designing, sizing and performing the solar energy systems in any part of the world, are not easily accessible in different localities of Nepal. The database of the solar radiation at any locations is very useful for that particular locality as well as for the broader world community [14] for a sustainable future energy.
Table 4. Monthly mean daily measured and estimated global solar radiation.
Months Biratnagar Radiation Kathmandu Radiation Pokhara Radiation Jumla Radiation
m
H HeAng HeNew Hm HeAng HeNew Hm HeAng HeNew Hm HeAng HeNew
JAN 7.51 6.90 7.97 9.54 11.32 10.30 12.31 13.40 11.95 15.04 16.56 15.15 FEB 9.82 10.36 10.41 11.35 14.93 12.71 14.5 16.16 14.15 16.75 17.00 17.16 MAR 13.92 14.41 13.98 13.21 16.02 14.40 15.93 17.93 16.24 22.38 22.71 21.98
APR 15.59 16.85 16.45 16.39 20.24 16.95 18.56 21.33 18.94 22.81 20.29 23.44 MAY 17.19 16.77 16.91 15.53 17.33 17.18 20.9 21.72 20.72 25.21 20.9 25.26
JUN 16.61 12.19 15.27 15.01 15.06 16.99 20.06 17.48 20.31 24.97 16.00 24.08 JUL 13.12 9.42 14.15 13.41 9.6 15.16 17.25 12.95 18.62 19.99 11.08 21.92 AUG 12.92 10.51 13.71 12.57 8.48 14.07 17.8 13.24 17.81 19.23 10.16 20.3
SEP 12.46 10.83 12.43 13.40 12.4 14.13 17.16 15.62 17.06 20.54 17.5 21.08 OCT 12.54 12.18 11.26 13.89 15.16 13.46 17.7 19.27 16.13 20.03 21.75 20.05 NOV 10.51 11.49 9.61 11.67 13.26 11.36 15.21 17.48 13.9 16.73 17.97 16.25 DEC 9.39 9.12 8.17 10.04 10.36 9.66 11.67 13.49 11.504 14.31 15.60 14.21
(a) (b)
(c) (d)
Figure 2. Measured
Hm
versus estimation global solar radiation
He by Angstrom-Prescott model and new model forBiratnagar.
Figure 3. Measured
Hm
versus estimation global solar radiation
He by Angstrom-Prescott model and new model forKathmandu.
correlation for Biratnagar, Kathmandu, Pokhara and Jumla (from east to west) between measured and esti- mated values in Nepal. The linear regression relations to estimate/predict the global solar radiation on the hori- zontal surface of Biratnagar, Kathmandu, Pokhara and Jumla are as below:
2 07 0.162
1.032 0.168ln
m
O d
av
M
H n
E
H N
T
RH T
(17)
1 04 0.324
0.09 0.08ln
m
O d
av
M
H E n
H N
T
RH T
(18)
8 06 0.337
0.21 0.12 ln
m
O d
av
M
H n
E
H N
T RH
T
(19)
[image:7.595.60.532.342.545.2]Figure 4. Measured
Hm
versus estimation global solar radiation
He by Angstrom-Prescott model and new model forPokhara.
Figure 5. Measured
Hm
versus estimation global solar radiation
He by Angstrom-Prescott model and new model forJumla.
1.4 07 0.384
0.40 0.001ln
m
O d
av
M
H
E H
T
RH T
n N
(20)
respectively.
Excellent agreement has been found between meas- ured and estimated global solar radiation predicted by linear regression equations (new proposed model). The statistical/error analysis techniques/examination also con- firm the better performance of the model at those sites; they cover almost all parts of Nepal.
[image:8.595.58.523.333.532.2]farm-ing activities in Nepal.
5. Acknowledgements
Authors gratefully express sincere thanks to University Grant Commission, Nepal for providing assistance in the form of scholarship and assistantship for this research work and are indebted to Solar Radiation and Aerosol in Himalaya Region (SAHR) project, Pulchowk, Nepal and Department of Hydrology and Meteorology/GoN for mak- ing the data available.
REFERENCES
[1] WECS, “Energy Sector Synopsis Report 2010,” Water and Energy Commission Secretariat, Kathmandu, Government of Nepal, 2010.
[2] Ministry of Environment, Government of Nepal, “Na- tional Adaptation Program of Action 2010,” NAPA TWG Draft Summary Report, 2010.
[3] NEA, “Nepal Electricity Authority Report 2011,” Minis- try of Energy, Government of Nepal, 2011.
[4] “Nepal Energy Situation,” 2013.
https://energypedia.info/wiki/Nepal_Energy_Situation [5] K. N. Poudyal, B. K. Bhattarai, B. K. Sapkota and K.
Berit, “Estimation of Global Solar Radiation Using Clear- ness Index and Cloud Transmittance Factor at Trans-Hi- malayan Region in Nepal,” Energy and Power Engineer- ing, Vol. 4, No. 6, 2012, pp. 415-421.
doi:10.4236/epe.2012.46055
[6] O. Sunday, “Estimation of Global and Diffuse Solar Ra-diations for Selected Cities in Nigeria,” International Journal of Energy and Environmental Engineering, Vol. 2, No. 3, 2011, pp. 11-33.
[7] Solar Energy Research Laboratory, Department of Phys- ics, Silpakorn University, Thailand, “Assessment of Solar Energy Potentials for Lao People’s Democratic Repub- lic,” Department of Alternative Energy Development and Efficiency, Thailand, Department of Electricity, Lao PDR, 2010.
[8] M. Chegaar and A. Chibani, “A Simple Method for Com- puting Global Solar Radiation,” Rev. Energ.Ren.Chemss, 2000, pp. 111-115.
http://www.docin.com/p-180112482.html
[9] L. S. Murry, “Fundamental of Atmospheric Physics,” Aca- demic Press, New York, 1996.
[10] M. Iqbal, “An Introduction to Solar Radiation,” Academic Press, New York, 1983.
[11] R. H. B. Excell, “The Intensity of Solar Radiation,” King Mongkut’s University of Technology Press, Thorburi, 2000.
[12] C. Augustine and M. N. Nnabuchi, “Relationship between Global Solar Radiation and Sunshine Hours for Calabar, Port Harcourt and Enugu, Nigeria,” International Journal of Physical Sciences, Vol. 4, No. 4, 2009, pp. 182-188. [13] S. S. Chandel, R. K. Agrawal and A. N. Pandey, “New
Correlation to Estimate Global Solar Radiation on Hori- zontal Surfaces Using Sunshine Hours and Temperature Data for Indian Sites,” Journal of Solar Engineering, Vol. 127, No. 3, 2005, pp. 417-420. doi:10.1115/1.1877512 [14] A. A. Dehghan, F. Besharat and A. R. Faghig, “Empirical
Models for Estimating Global Solar Radiation: A Review and Case Study,” Renewable and Sustainable Energy Re- view, Vol. 21, 2013, pp. 798-821.
doi:10.1016/j.rser.2012.12.043
[15] J. E. Ekpe and M. N. Nnabuchi, “Solar Radiation in Onit- sha: A Correlation with Average Temperature,” Scholar- ity Journals of Biotechnology, Vol. 1, No. 5, 2012, pp. 101-107.
[16] B. Murray, “Correlation of Solar Radiation Withclouds,” Solar Energy, Vol. 12, No. 1, 1961, pp. 417-420.
[17] C. K. Panday and A. K. Katiyar, “Temperature Base Cor-relation for the Estimation of Global Solar Radiation on Horizontal Surface,” International Journal of Energy and Environment, Vol. 1, No. 4, 2010, pp. 737-744.