Undrained Triaxial Experimental
Investigations and Hyperviscoplastic
Modelling of Peat Materials
Lin Zhang
Department of Civil, Structural and Environmental Engineering
Trinity College Dublin
PhD Thesis
Principal Supervisor: Prof. Brendan O’Kelly
Co-Supervisor: Dr. Thomas Nagel
Declaration
I, the undersigned, declare that this thesis has not been submitted as an
exer-cise for a degree at this or any other university. I further declare that, except
where reference is made in the text, it is entirely my own work. I agree the
li-brary may lend or copy this thesis upon request.
Lin Zhang
Acknowledgements
I owe my greatest gratitude to my co-supervisor Dr. Thomas Nagel, for his
generous friendship, continuous support and genuine encouragements. I
sin-cerely thank him for his supervision and all the adventures for the last year of
my PhD research. Without his support, this thesis would never have been done.
Thanks to Dr. Brendan O’Kelly for the opportunity for me to come to Ireland
and initiating the research connection with the bio-mechanical research group
in TCD.
I really appreciate the help and support from the technicians in the labs: Mr.
Eoin Dunne for his help with collecting the peat samples, setting up the
ex-periments and the good laughs with his contagious humour in the lab and the
emotional supports; Dr. Kevin Ryan for his patience and efficiency in helping
me get what I planned and fixing the computers and instruments that I burnt; Mr. Patrick Veal for his help in collecting the peat samples, coaching my driving
skills, supplying accommodation for my homeless days and proof-reading my
thesis; Mr. Mick Harris dragging me to Taichi courses and keeping an eye on
my healthy diet; Michael Grimes for the temperature recorders; David McAulay
for the metal gears of my triaxial modifications. I listed the specific little things
above, but they have done much more than I can fit onto this page. Mr. Martin
Carney, who was the encyclopaedia in soils lab, has retired during my PhD
re-search, but his philosophy of lab works has influenced me deeply and helped
me to react quickly to the unexpected situations in the lab.
I appreciate every opportunity that helped me to broaden my vision and
im-prove my professional skills during my PhD research. Many thanks to Dr. Eric
Farrell and Mr. Conor O’Donnell for my geotechnical engineer intership in
AGL, I learnt so much on engineering practice and commercial software
mod-elling to solve real problems. I am grateful to Ms. Una Beagon for the
op-portunity of the part-time lecturer on geotechnical engineering in DIT which equipped me with some valuable teaching experience. I would like to express
my gratitude to Dr. Faqiang Qian for granting me to attend the MUMOLADE
winter school as well as Prof. Wei Wu for offering me the opportunity to
help on peat modelling by Dr. Hans Teunissen from Deltares. Thanks to Dr. Vikram Pakrashi from UCC for his from-time-to-time support which brought
me courage and confidence to continue. Thanks to Prof. Roger West, Prof.
Biswajit Basu, Prof. Brian Broderick, Dr. Sarah Pavia, Prof. Paul Johnston for
their support and help both financially and professionally.
The friendships I have made with the office guys made my Dublin life
colour-ful as always. I felt warmed up with their care and jokes. It has been very
sweet to receive a collection of French wines after Michael’s French conference
trip, albeit he criticised my attending a wine appreciation course as campy and
kitschy; Ciaran’s information on geotechnical seminars, conferences, and his
kind offer of proof-reading my thesis; Billy’s Belgium chocolate from his
Bel-gium conference trip; Jiayi’s crazy way of releasing energy; the lecker Indian
restaurants, cultural instilling and fierce arguments with Himanshu; the girls’
fun times with Sally, Tracey, Christine, Orla and Maggie; the art and food with
Eva; my first and most loyal friend Jingran in Dublin; Andrea’s one day an Ital-ian sentence learning and all the Pavilion Smithwicks and Guinness on our pay
days; Juan Pablo’s taking care of me as a little sister and all the encouragements
on my challenge takings and how to be. There are a lot more friends that
illu-minated my life during the PhD and I appreciate all of them.
Second last and most importantly, I thank my parents and my elder sister for their understanding, support and love.
Finally, I acknowledge the fundings that supported my PhD research by Irish
Abstract
This PhD research includes two parts, viz. experimental investigation on the
undrained mechanical properties of undisturbed fibrous peat and a finite strain
constitutive model within a thermodynamically consistent framework based
on the experimental results of the tested peat.
From the laboratory investigation, nonlinear behaviour with large strain was
observed from the loading-unloading tests on peat. The influence of cell
pres-sure, strain rate, stress relaxation on the constitutive behaviour as well as strain
recoveries from unloading were investigated. Relaxation tests were carried out
for overstress quantification as well as to obtain the equilibrium state. The
tested peat was categorised as a rate-dependent material with equilibrium
hys-teresis. Structural anisotropy was also investigated by testing the undisturbed
vertical and horizontal specimens under the same conditions. Although in the proposed model, the structural anisotropy was not included, the experimental
data provided the foundation for the future development of anisotropic
con-stitutive models.
The observed material behaviour motivated a rheological model comprising
four parallel layers, each consisting of elastic, viscoelastic and elastoplastic el-ements. The proposed hyperviscoplastic model was derived from the entropy
inequality. Each part of the model was verified against their analytical
solu-tions. The model parameter fitting started with the rate-independent
equilib-rium tests, where the hyperelastoplastic model was fitted to the defined
labora-tory equilibrium test. Two compression-relaxation tests, carried out at
differ-ent strain rates, were used for the parameter estimation of the rate-dependdiffer-ent
hyperviscoplastic model. The hyperviscoplastic model was validated against
five strain rate tests under various load cases as well as an undrained triaxial
creep test. The finite strain constitutive model derived within a
thermodynam-ically consistent framework showed its versatility in simulating peat behaviour in various load cases by a good agreement of the experimental results. Also,
from the process of the deriving the hyperviscoplastic model, it is perceived
that it would be easy to extend the current model with more features in a
Contents
1 Introduction 1
1.1 Background . . . 1
1.2 Scope of the study . . . 2
2 Literature Review 4 2.1 Experimental investigation on peat materials . . . 5
2.1.1 Peat consolidation . . . 5
2.1.1.1 Concepts of primary consolidation and secondary compression-Hypotheses A & B . . . 6
2.1.1.2 Permeability and consolidation of peat . . . 8
2.1.2 Compression and shear of peat . . . 13
2.2 Constitutive models for peat materials . . . 18
2.2.1 One-dimensional consolidation/compression models . . . 18
2.2.1.1 Cα/Ccconcept . . . 18
2.2.1.2 One-dimensional rheological models . . . 20
2.2.1.3 Time-line theory and isotache models . . . 23
2.2.1.4 Elastic visco-plastic (EVP) models . . . 28
2.2.1.5 Viscoelastic viscoplastic model . . . 29
2.2.2 3D consolidation/compression models . . . 30
2.2.2.1 Soft Soil Creep model . . . 31
2.2.2.2 3D EVP large strain model . . . 32
2.2.2.3 Hyperelastic/hyperplastic models . . . 33
2.2.3 Anisotropic consolidation/compression models . . . 34
2.3 Summary . . . 36
3 Laboratory Experiments 37 3.1 Experiment methodology . . . 38
3.2 Characteristics of tested peat sample . . . 41
3.3 Testing apparatus . . . 42
3.4 Undrained triaxial loading-unloading tests on vertical specimens . . . 43
3.4.2 Strain rate effect on strain recovery in loading-unloading tests . . . 46
3.5 Undrained triaxial relaxation tests . . . 47
3.5.1 Relaxation effect on elastic recovery in loading-unloading tests . . . . 49
3.5.2 Relationship between stress relaxation and logarithm of time . . . 50
3.5.3 Stress relaxation ratio . . . 50
3.5.4 Temperature effect on stress relaxation . . . 53
3.5.5 Thermodynamic equilibrium state . . . 54
3.6 Strain history effects . . . 58
3.7 Undrained triaxial creep tests . . . 59
3.8 Tests on structural anisotropy . . . 61
3.8.1 Anisotropic permeability . . . 62
3.8.2 Undrained triaxial tests on horizontal peat specimens . . . 63
3.9 Summary . . . 65
4 Constitutive Modelling 68 4.1 Some basic continuum mechanics . . . 68
4.1.1 Configurations . . . 68
4.1.2 Strain and stress measurements and work conjugates . . . 69
4.1.3 Balance principles and entropy inequality . . . 71
4.1.4 Overlay concept . . . 73
4.2 Hyperelastic model . . . 73
4.3 Hyperviscoelastic model . . . 75
4.3.1 Standard Solid Model 1D Formulation . . . 75
4.3.2 3D Formulation . . . 76
4.3.2.1 Stress and strain measures . . . 76
4.3.2.2 Constitutive relations . . . 77
4.3.2.3 Model with two Maxwell elements . . . 79
4.4 Hyperviscoplastic model . . . 80
4.4.1 Constitutive Relations . . . 81
4.5 Summary . . . 84
5 Numerical Implementation, Verification and Validation 85 5.1 Methods for numerical implementation . . . 85
5.1.1 Kelvin mapping . . . 85
5.1.2 Numerical implementation . . . 87
5.1.2.1 Local stress iteration . . . 87
5.1.2.2 Global momentum balance . . . 88
5.2 Numerical implementation and verification of the constitutive models . . . . 90
5.2.1.1 Numerical implementation . . . 90
5.2.1.2 Verification of Modified Neo-Hooke model . . . 91
5.2.2 Hyperviscoelastic model . . . 92
5.2.2.1 Numerical implementation with one Maxwell element . . . . 92
5.2.2.2 Verification with one Maxwell element . . . 94
5.2.2.3 Numerical implementation with two Maxwell elements . . . 95
5.2.2.4 Verification with two Maxwell elements . . . 99
5.2.3 hyperviscoplastic model . . . 100
5.2.3.1 Numerical implementation of the hyperviscoplastic model 100 5.2.3.2 Verification of the hyperelastoplastic model . . . 102
5.3 Jacobian and global tangent check . . . 104
5.4 Load cases and parameter sensitivity tests . . . 105
5.4.1 Load cases for the rate-dependent model . . . 105
5.4.2 Material parameter sensitivity tests for hyperviscoelastic model . . . . 106
5.4.3 Material parameter sensitivity tests for the hyperelastoplastic model 110 5.5 Material parameter fittings and model validations . . . 115
5.5.1 Experimental data . . . 115
5.5.2 Hyperelastoplastic model-equilibrium state tests . . . 116
5.5.2.1 Equilibrium test fitting . . . 116
5.5.2.2 Hyperelastoplastic model validation . . . 117
5.5.3 hyperviscoplastic model . . . 118
5.5.3.1 hyperviscoplastic model parameter fitting . . . 118
5.5.3.2 hyperviscoplastic model validation . . . 119
5.6 Discussion . . . 123
5.6.1 Load case modification . . . 124
5.6.2 Plastic flow rule modification . . . 124
5.7 Summary . . . 128
6 Conclusions 130 6.1 Summary of the experimental tests . . . 130
6.2 Summary of the numerical models . . . 132
6.3 Limitations . . . 133
6.4 Research outlook . . . 134
References 135 A Summary of constitutive models for peat 148 A.1 Rheological models for peat . . . 148
B Derivations and definitions 153 B.1 product of Right Cauchy Green tensor . . . 153 B.2 Analytical solution for the hyperelastoplastic model . . . 153
List of Figures
2.1 Effect of sample thickness on creep with respect to hypotheses A and B (after
Ladd et al. (1977)). . . 8
2.2 Relationship between permeability and humification for different types of peat (Jennings and Johnston, 2013). . . 9
2.3 Scanning electron micrograph of a sphagnum peat (O’Kelly and Zhang, 2013). 10
2.4 EOP void ratio versus effective stress curves of 24 undisturbed Middleton
peat specimens (Mesri et al., 1997). . . 11
2.5 Typical experimental results for vertical consolidation tests on 250 mm
di-ameter, by 75 mm thickness undisturbed samples of fibrous peat (Berry,
1983)). . . 12
2.6 Three testing methods for creep properties in aK0-CRS test (translated from
Den Haan (2001)). . . 12
2.7 Values of effective friction angleφ0deduced from drained triaxial compres-sion of peat (adapted from O’Kelly and Zhang (2013)). . . 15
2.8 Stress strain response of consolidated undrained triaxial testing of two
Cana-dian undisturbed peat samples (Hendry, 2011). . . 16
2.9 Calculation ofCα/Cc values (Mesri and Castro, 1987). . . 19 2.10 Cα/Cc plots for peats. . . 20 2.11 1D nonlinear rheological model for clay and amorphous peat (Barden, 1968). 21
2.12 Rheological representation of Gibson and Lo (1961) model. . . 22
2.13 Rheological representation of Berry and Poskitt (1972) model for fibrous peat. 23
2.14 Compressibility and shear strength of clay exhibiting delayed consolidation
(Bjerrum, 1967). . . 24 2.15 Definitions of primary and secondary consolidation and instant and delayed
compression (Borja and Kavazanjian, 1985). . . 25
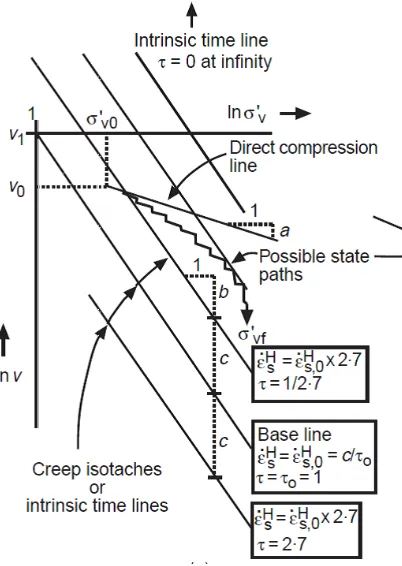
2.16 Illustration of isotaches of theabcmodel (Den Haan, 1996). . . 26
2.17 Viscoelastic viscoplastic model proposed by Madaschi and Gajo (2015). . . . 29
2.18 Overconsolidation boundary surface under triaxial conditions
(Karunawar-dena, 2007). . . 33
2.19 Anisotropic creep model: current state surface (CSS) and normal
3.1 Experimental observation: 4 categories of material behaviour (Haupt, 2000). 39
3.2 Sampling location in Clara bog (Zhang, 2013). . . 42
3.3 Two load measurements. . . 43
3.4 Deviator stress-axial strain relationship of an undisturbed vertical peat spec-imen tested at ˙"a=-16.0 %/h in undrained triaxiallutests. . . 45
3.5 Summary of the estimated and measured elastic strains of thelutests. . . 45
3.6 Undrained triaxiallutests of an undisturbed vertical peat specimen with cell pressures of 0 kPa, 20 kPa, 40 kPa and 120 kPa at an axial strain rate of 16.0 %/h. 46 3.7 Strain rate effect on the deviator stress-axial strain relationship in the undrained lutests of the undisturbed vertical peat specimens. . . 47
3.8 Strain rate effect on the elastic recovery in the undrainedlutests of the undis-turbed vertical peat specimens. . . 47
3.9 Asymmetrical deformation of a test on undisturbed vertical specimen tested at ˙"=1.60 %/h. . . 48
3.10 Relaxation test results with 500 N proving ring set-up. . . 49
3.11 Relaxation effect on the elastic recovery in the undrained lru tests of the undisturbed vertical peat specimens. . . 50
3.12 Undrained relaxation tests at two axial strain rates. . . 51
3.13 Undrained Triaxiallutests with step relaxations. . . 52
3.14 Deviator stress relaxation ratios. . . 52
3.15 Virtual elastic strain calculated from unloading relaxations. . . 52
3.16 Temperature effect on relaxation behaviour. . . 53
3.17 Relaxation test with one week duration with normal time scale. . . 54
3.18 Deviator stress relaxations of undrained triaxial compressions to 2 %, 4 % and 6 % axial strains. . . 55
3.19 Undrained triaxial compression test with relaxations: equilibrium curve. . . 55
3.20 Comparison oflurrelaxation test at 160 %/h andlurtest at 4.81 %/h (Zhang et al., 2015). . . 56
3.21 Undrained triaxiallurtest at 0.16 %/h to an axial strain of 5 %. . . 56
3.22 Deviator stress oscillation due to temperature fluctuation. . . 57
3.23 Deviator stress relaxation of the 0.16 %/h test. . . 57
3.24 Comparison of the 0.16 %/h test with equilibrium curve from the relaxation tests. . . 57
3.25 Undrained triaxiallutest at axial strain rate of 0.16 %/h (equilibrium state). 58 3.26 Overlapping of the deviator stress-axial strain relationships of the 16.0%/h test of three undisturbed vertical specimens with different strain histories. . 58
3.28 Comparison of 0.16 %/h undrained triaxiallrutests of undisturbed (e0) and compressed (e1) peat specimens. . . 60
3.29 Undrained triaxial creep test on undisturbed peat specimen at two load
in-crements of 10 kPa and 20 kPa. . . 61
3.30 Undrained triaxial creep test on undisturbed peat specimen at 20 kPa for
80 days. . . 61
3.31 Undisturbed peat block. . . 62
3.32 Permeameter cell set-up for the falling head permeability test (Head, 1994). 63
3.33 Deviator stress-axial strain of an undisturbed horizontal peat specimen tested
at an axial strain rate of 16.0 %/h. . . 64 3.34 Deviator stress-axial strain of an undisturbed horizontal peat specimen tested
at an axial strain rate of 1.60 %/h. . . 65 3.35 Failure mode of the undisturbed horizontal peat specimen tested at an axial
strain rate of 1.60 %/h. . . 65 3.36 Deviator stress-axial strain of an undisturbed horizontal peat specimen tested
at an axial strain rate of 0.16 %/h. . . 66 3.37 Specimens after undrained triaixallutests. . . 66
4.1 Configuration and motion of a continuum body (adapted from Holzapfel
(2000)). . . 69
4.2 Schematic representation of the Standard Solid model. . . 75 4.3 Series of parallel Maxwell elements and the equilibrium hyperelastic spring
element. . . 80
4.4 Hyperviscoplastic model. . . 80
5.1 Numerical and analytical solutions of the incompressible (isochoric)
Neo-Hooke model. . . 92
5.2 Model validation with analytical solution of uniaxial test. . . 96
5.3 Validation of the proposed numerical implementation with its analytical
so-lution of the hyperviscoelastic model with two Maxwell elements. . . 99
5.4 Analytical verification of the hyperelastoplastic model. . . 104 5.5 Single stage compression followed by unloading with relaxation. . . 106
5.6 Single stage compression with relaxation followed by unloading with
relax-ation. . . 106
5.7 Multi-stage compression with relaxations followed by unloading with
relax-ation. . . 107
5.8 Multi-stage compression with relaxations followed by unloading with
relax-ation. . . 107
5.10 Hyperelastoplastic model material parameter tests subjected to stress-controlled loading-unloading test condition. . . 112
5.11 Hyperelastoplastic model material parameter sensitivity tests subject to strain
controlled tests. . . 114
5.12 Material parameter fitting to the hyperelastoplastic model (equilibrium test). 117
5.13 Hyperelastoplastic model validation with loading-unloading test. . . 118
5.14 Hyperelastoplastic model validation against equilibrium test with relaxations.118
5.15 hyperviscoplastic model parameter fitting with undrained triaxial
compression-relaxation test at ˙"a=1.60 %/h. . . 119
5.16 hyperviscoplastic model parameter fitting with undrained triaxial
compression-relaxation test at ˙"a=16.0 %/h. . . 120
5.17 hyperviscoplastic model validation against undrained triaxial luru test at
˙
"a=1.60 %/h. . . 120
5.18 hyperviscoplastic model validation against undrained triaxial test at ˙"a=4.81 %/h.121 5.19 hyperviscoplastic model validation against undrained triaxial test at ˙"a=16.0 %/h.121 5.20 hyperviscoplastic model validation against undrained triaxial test at ˙"a=160 %/h.122 5.21 hyperviscoplastic model validation against equilibrium test with relaxations. 122
5.22 hyperviscoplastic model validation against undrained triaxial creep test. . . 123
5.23 hyperviscoplastic model validation with modified load case against undrained
triaxial test at ˙"=0.16 %/h. . . 125 5.24 hyperviscoplastic model validation with modified load case against undrained
triaxial test at ˙"=1.60 %/h. . . 125 5.25 Hyperelastoplastic model verification with the modified plastic flow rule. . . 127
5.26 Hyperelastoplastic model validation with the modified plastic flow rule against
the undrained triaxial test at ˙"a=0.16 %/h. . . 128 5.27 Hyperelastoplastic model validation with the modified plastic flow rule against
Nomenclature
Throughout the thesis bold face symbols denote tensors and vectors. Normal face letters
denote scalar quantities.
Abbreviations
ep Elastic part of elastoplastic. eq0 Rate-independent equilibrium. ev Elastic part of viscoelastic.
lru Loading-relaxation-unloading.
lur Loading-unloading-reloading.
lu Loading-unloading.
p Elastoplastic.
v Viscoelastic.
Greek symbols
ε Strain tensor of Green-Lagrange or Almansi type on intermediate con-figuration.
", ε, ε Small strain tensor/its Kelvin mapping/its Voigt mapping.
η Viscosity.
dΓ Area element.
χ Motion.
λ Stretch/compression.
dΩ Volume element.
¯
ψ, ψ Specific Helmholtz free energy function/Helmholtz free energy density function.
Ψi Residual in iterationi.
ρ Mass density.
σ, σ, σ Cauchy stress tensor/its Kelvin mapping/its Voigt mapping.
τ Kirchhoff stress.
τov Overstress on intermediate configuration.
θ Absolute temperature.
a·b Dot product ofaandb.
A:B Double contraction ofAand B. a⊗b Dyadic product ofaandb. AB 12h(A⊗B)
23
T+ (A⊗BT)24Ti
χ∗ Push forward operator.
χ∗ Pull back operator.
div Divergence operator.
Grand Material gradient operator.
H(•) Heaviside step function.
(•)−1 Inverse operator.
˙
(v) Material time derivative ofv. ∇
ε Contravariant Oldroyd stress rate. ∆
ε Covariant Oldroyd strain rate. sign(•) Sign function.
(•)T,(•)abT Transpose operator; transposition of athand bthbase vector.
tr(a) tr(A) =A:I Trace operator.
Roman symbols
b External body force by unit mass/left Cauchy Green deformation ten-sor in 4.1.2.
C,C,C Tangent moduli (fourth order tensor)/ its Kelvin mapping/ its Voigt
mapping.
C, C Right Cauchy Green tensor/its Kelvin mapping.
Cp, Cp Plastic Right Cauchy Green type tensor/its Kelvin mapping ˙Cp=2FT
p
∆
εpFp.
Cv, Cv Viscous Right Cauchy Green type tensor/its Kelvin mapping ˙Cv=2FT
v
∆
εvFv.
d d=sym(gradv) =21 gradTv+gradvrate of deformation tensor.
E Green-Lagrangian strain tensor.
e Euler-Almansi strain tensor.
E Young’s modulus.
F Deformation gradient tensor.
f Force vector.
I, Second order identity tensor/its Kelvin mapping. Fourth order identity tensor in Kelvin mapping.
U Internal energy.
I1, I2, I3 Principal invariants of Right Cauchy Green tensor C.
Aij, Aijkl Index notation of second order tensor/fourth order tensor.
ˆ
C Strain tensor of Cauchy-Green type on intermediate configuration.
J J =det(F, volume ratio.
Ekin Kinetic energy.
K Stiffness Matrix in Kelvin mapping in global Newton iteration scheme.
l Spatial velocity gradient.
n Outward unit normal vector.
ν Poisson’s ratio.
P First Piola-Kirchhoff stress. Pext External mechanical power.
C1, D2, α Nonlinear material model parameters.
q Heat flux vector.
Q Thermal power.
r Residual vector in Kelvin mapping.
r Heat source per unit mass and time.
R% Relaxation ratio.
cp Material model plastic parameter.
S, S Second Piola-Kirchhoff stress/its Kelvin mapping.
e
S Se=S/C1dimensionless 2ndPiola-Kirchhoff stress quantity.
s Specific entropy.
t Surface traction.
t Time.
u Displacement vector.
Ui+1, Ut Displacement solution at timet+∆t for thei+1thiteration/ displace-ment solution at timet.
v Spatial velocity tensor.
x, X Position vector in spacial configuration / position vector in material configuration.
Glossary
axial stretch/compression a deformation measure which equals the ratio of the current deformed length to the original length of a specimen in a given axial direction.
current configuration the spatial position of all material particles of a material body at current timet >t0.
hysteresis different paths in state-space when the driving forces of a process are reversed due to path-dependencies.
isochoric constant volume.
material (Lagrangian) description the parameterisation of a motion with respect to the material coordinates in the reference configuration.
mechanical equilibrium the balance of forces and the associated motion.
pull-back the operation that transforms a vector or tensor-valued quantity based on the current configuration to the reference configuration.
push-forward the operation that transforms a vector or tensor-valued quantity based on the reference configuration to the current configuration.
reference configuration the simultaneous position of all particles within a body referred to a fixed reference timet0.
secular effect Dutch expression, linearly increasing deformation with logarithm of time under the constant effective stress.
spatial (Eulerian) description the parameterisation of a motion with respect to the cur-rent (or spatial) coordinates in the curcur-rent configuration.
Chapter 1
Introduction
1.1
Background
Peat has been considered as an “ordinary extraordinary” material by Hobbs (1986) which
consists of decomposed fragmented remains of dead vegetation that have accumulated
under waterlogged conditions. Current constitutive models for peat are mainly based on
theories developed for fine-grained mineral soils. Because of their exceptionally high
wa-ter content and organic nature, the deformation of peat mawa-terials under load is very large,
coupled with remarkably high strength at the high water content levels. In order to
repli-cate the observed peat behaviours, soil models developed for inorganic soils are often
adapted based on empirical evidence and engineering judgement. There are basically two
types of peat models, i.e. empirical models that correlate geotechnical behaviour of peat materials with their physical properties, e.g. water content, void ratio, degree of
decom-position, etc. and constitutive models describing stress-strain relationships (Berry and
Poskitt, 1972; Den Haan, 1996; Karunawardena, 2007; Madaschi and Gajo, 2015), albeit
some empirical relations, such as Darcy’s law, are used in the constitutive models.
Peat deposits are formed of partly decomposed fragmented plant remnants, resulting
in their fibrous nature. The three distinctive characteristics of fibrous peat summarized
by Mesri and Ajlouni (2007) are: i) fibrous peat possesses very high initial permeability; ii)
permeability decreases dramatically under loading because of its very large
compressibil-ity; iii) fibrous peat has extreme compressibility and secondary compression is often more
significant for peat deposits than other geotechnical materials. For convenience of mod-elling, the structure of peat materials can be treated as isotropic and anisotropic based on
degree of decomposition (Hendry et al., 2012). Amorphous peat with a high degree of
de-composition (H10 based on the von Post scale) can be taken as isotropic (MacFarlane and
Radforth, 1965). For peat material at lower states of decomposition, structural anisotropy
should be taken into account in their constitutive models. Yamaguchi et al. (1985) found
that natural fibrous peat was cross-anisotropic and Hendry et al. (2012) confirmed the
an increasing fibre content. For both fibrous and amorphous peats, large deformation is commonly encounteredin-situas well as in the laboratory experiments.
The majority of the current geotechnical models for peat were developed based on
the constitutive models for mineral soils, where the understanding of the mechanism of
peat geotechnical properties was insufficient, particularly the models developed based on
curve-fitting. Some plausible phenomenological models proposed for peat were in
small-strain one-dimensional fashion. Due to the lack of an unequivocal classification of the peat
geomechanical behaviour, the variations of the laboratory andin-situfindings perplexed
the choice of peat models. Therefore, the constitutive models in the literature had limited
capabilities in simulating various strain/stress-range, load cases, testing conditions, strain rates, etc. Few constitutive models were proposed for peat in the finite strain or thermo-dynamically consistent frameworks described in Chapter 2.
1.2
Scope of the study
The undrained constitutive investigation of the peat material simplifies the material
be-haviour by eliminating the pore water flow, but can be straightforwardly extended into an
effective stress formulation with the permeation description of the pore water in the
sat-urated conditions. The study aims to find a rational ingress to the complex mechanical
phenomena by setting up clear and plausible theories of the peat behaviour.
This study was carried out for the two main purposes:
1. In the literature, peat material was reported as a rate-dependent elastocplastic
mate-rial. The first purpose of this study is to experimentally investigate the
phenomeno-logical nonlinear, rate-dependent, structurally anisotropic constitutive behaviour of
the tested peat from the fundamental mechanisms for modelling purpose.
2. To propose a constitutive model based on the experimental proof within a
thermo-dynamically consistent approach; to validate the model performance in simulating
the experimental results in various load cases.
Based on the material categorisation proposed by Haupt (2000), the rate-dependence and equilibrium tests are studied to categorise the tested peat material. The main effort in
the laboratory experiments in Chapter 3 focuses on a) the large-strain nonlinear
constitu-tive relationships and b) strain recoveries of peat in undrained loading-unloading triaxial
tests at various strain rates. The cell pressure, strain rate, stress relaxation effects on these
two aspects are investigated. Structural anisotropy is studied by comparing the undrained
triaxial tests and falling head permeability tests on the undisturbed vertical and
model, the experimental data provide laboratory foundation for the future development of the constitutive models considering structural anisotropy of peat.
Based on the categorisation and the experimental discoveries, a finite strain
constitu-tive model is proposed in Chapter 4. The constituconstitu-tive model adopts a hyperviscoelastic
model (Görke et al., 2010; Nagel, 2012) and is extended with a hyperplastic component.
The constitutive model consists of three layers, i.e. hyperelastic, hyperviscoelastic and
hy-perelastoplastic components by using the overlay concept. The constitutive relationship
of each layer is derived from Clausius-Duhem entropy inequality which guarantees the
proposed model produces thermodynamically reasonable results. Two time-scale
rate-dependence is considered in the hyperviscoelastic model layer.
Chapter 5 introduces the numerical implementation of the constitutive models. A nu-merical algorithm is adopted which yields consistent tangent operators for the local stress
iterations and the global Newton scheme. The numerical implementation of the
hyper-elastic, hyperviscoelastic and hyperelastoplastic models are verified with their analytical
solutions. The model parameter fittings start with the rate-independent equilibrium tests,
whereby the hyperelastoplastic model is fitted against the defined experimental
equilib-rium state test. Compression-relaxation, carried out at two strain rates, are used for the
parameter fittings of the rate-dependent components of the hyperviscoplastic model. The
complete model with the fitted material parameters is then validated against undrained
triaxial tests carried out at five different strain rates under various load cases as well as an undrained triaxial creep test under comparable testing conditions. Modifications to the
loading boundary conditions as well as to the plastic flow rule are discussed on improving
the model performance in peat modelling.
Chapter 2 reviews the laboratory investigations as well as the constitutive models for
peat materials. A finite strain constitutive model with its versatilities in modelling the
com-plex peat geomechanical behaviours based on the the experimental proof is absent from
the literature, which brings the necessity of this study.
The study is summarised and concluded in Chapter 6. The limitations on the
experi-mental tests and the proposed numerical model are elaborated, whereby insights for future
peat research both on experimental and numerical aspects are indicated.
Appendix A summarises the development of the rheological models for peat materials
and the evolution of the application of time-line theory in peat from the literature.
Ap-pendix B provides the explanation of theproduct of the Right Cauchy Green tensor and elaborates the derivation of an analytical solution for the hyperelastoplastic model as well
Chapter 2
Literature Review
With the development of society, technology and economy, there has been an increasing
need for construction activities, such as transportation infrastructures, wind farms,
foun-dations, civil and industrial constructions, etc., in places that would have been considered
unsuitable for construction in the past. In these places, soft soils, such as peat, are one
of the most problematic geotechnical issues to be dealt with. The peatland formation has
resulted from climatic states where precipitation exceeds evaporation and provides
water-logged conditions for peat accumulation to occur. The peatland coverage of the national
area of Ireland, 17 % ca. 13,000 km2, ranked the third in the world following Finland and Canada (Hobbs, 1986) in 1983. More recent data on the peatland distribution in Europe
has been reported by Montanarella et al. (2006). Engineering problems of peat, such as failure of embankments (Den Haan and Feddema, 2013), containment dykes (McInerney
et al., 2006), slope failures(Long and Jennings, 2006) and wind farm foundation failures
(Lindsay and Bragg, 2004), have gathered the attention on the research of peat mechanical
properties in recent decades especially in the northern countries such as Sweden, the UK,
Ireland, the Netherlands, Germany etc. Research on peat geotechnical properties is mostly
reported in the Netherlands, Ireland, the UK, Sweden, Canada, the USA and Malaysia.
More detailed peatland distribution all over the world can be found in Huat et al. (2014).
Peat material consists of decomposed fragmented remains of dead plant vegetation
that has accumulated over time under waterlogged conditions. The classification of peat
varies, where in soil science peat is termed as an organic soil with organic content of more than 50 %, and in geotechnical engineering peat includes soils with an organic content of
more than 20 % (Kogure, 1999). The standard classification of ASTM (ASTM, 2007) defines
peat as an organic soil with its low ash content of less than 25 % ash by dry weight, i.e. an
organic content of more than 75 %. Albeit different definitions are proposed, peat
materi-als all over the world share some common properties. The formation process grants peat
materials with the inherent structural anisotropy resulted from the prostrate fibres. The
degree of this anisotropy is dependent on the level of the bio-degradation of the
the deformation of peat material under loading is very large compared with mineral soils (e.g. clay, silt, etc.). Current geotechnical practice for peat is mainly based on theories
developed for fine-grained mineral soils, which are extended to consider the large strain,
state-dependent and anisotropic behaviour of peat. This chapter reviews the
experimen-tal tests on peat, showing the mechanical properties of peat materials and the constitutive
models proposed and adopted for peat.
2.1
Experimental investigation on peat materials
Peat material is considered a challenging natural material in geotechnical engineering
prac-tice. Challenges of experimental investigation of peat materials derive from the difficulties handling and preparing peat samples as well as problems achieving the appropriate stress
levels and analysing the experimental results in standard laboratory apparatus designed
for conventional mineral soil testing (Long, 2005).
In soil mechanics, investigation of the properties of a geomaterial always starts with
solving engineering problems. Engineering research practice is to correlate peat strength
with its physical properties, such as water content, organic content, Atterberg limits, etc.
There is also research into peat’s mechanical properties from its physical fundamentals.
The former approach has the advantages of providing direct and fast solutions to complex
geomaterial problems and the disadvantage of limited applicability when accounting for
material variations. This later approach is normally challenging in quantifying the specific properties of a complex material, yet fundamental in understanding the material.
In the literature, laboratory experimental investigations of peat mechanical behaviour
are mainly in two categories, i.e. consolidation and strength. Consolidation is the water
expulsion process of the peat material under loading. The strength investigation of peat
in the literature focuses on the rate-dependent as well as (both structural and induced)
anisotropic pre-failure/failure tests in drained and undrained conditions. This section re-views the mechanical properties found in the various laboratory tests in terms of
consoli-dation and strength.
2.1.1
Peat consolidation
The distinctive characteristics of peat consolidation from those of mineral soils are (1)
the primary consolidation with excess pore water pressure dissipation is relatively short
and creep is the dominant and fundamental process (Hobbs, 1986); (2) the initial
perme-ability of fibrous peat is very high, typically 100 to 1,000 times the initial permeperme-ability of soft clay and silt deposits and upon compression the permeability decreases dramatically
(Mesri and Ajlouni, 2007); (3) the consolidation anisotropy is induced by fibres (structural
the organic solid particle in peat is likely to be compressible (Long and Jennings, 2006; Zwa-nenburg, 2005); (5) biodegradation occurs during the consolidation process (Pichan and
O’Kelly, 2012). Regarding the long-term creep, it is pivotal to understand the consolidation
hypotheses A and B (Ladd et al., 1977) to be discussed in the next section.
2.1.1.1 Concepts of primary consolidation and secondary compression-Hypotheses A & B
The term primary consolidation is used for describing the soil consolidation phase with
excess pore water pressure dissipation (Terzaghi, 1942), whereas the secondary compres-sion refers to the further settlement associated with constant effective stress, first named
as “secular effect” by Buisman (1936). The primary consolidation and secondary
compres-sion are taken to refer to consecutive phases of the comprescompres-sion process, where secondary
compression commences after the primary (hydrodynamic) phase has essentially reached
completion.
Primary consolidation is solely a process of the dissipation of excess pore water
pres-sure and effective stress increase, as defined by Terzaghi (1942). There are mainly four
conceptual ideas in explaining secondary compression (Bartholomeeusen, 2003).
Terza-ghi (1941) made his first attempt to explain that the secondary compression was due to
the slow viscous inter-granular movement attributed to the highly viscous absorbed elec-trical double water layer of the solid particles. Subsequently, Terzaghi (1953) stated that
secondary compression was due to the re-adjustment of clay particles to a more stable
po-sition, which has been widely accepted as the explanation of secondary compression of
granular geomaterials. As the second explanation, Taylor (1942) stated that the magnitude
of compression depends on the rate of compression due to viscous effects of the absorbed
double layer and introduced "plastic resistance", based on bond resistance and viscous
structural resistance. The structural change during secondary compression is due to the
disturbance of structure or the structural readjustment, which is independent of
perme-ability. The third explanation is by the concept of macro- and micro-pores(De Josselin de
Jong, 1968), in which the pores of different sizes transmit the expelled water in order to allow settlement to occur. De Josselin de Jong (1968) suggested that during primary
con-solidation, water is only expelled from the macropores, where the excess pore water
pres-sure is meapres-sured. After primary consolidation, pore water is gradually expelled from the
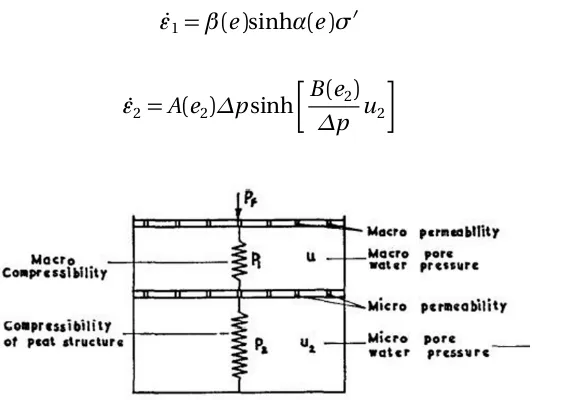
micropores into the macropores, causing secondary compression to occur. Barden (1968)
claimed that a consolidation mechanism relevant to fibrous peat involves the drainage of
a system of micropores into a system of coarser channels. The fourth interpretation of
sec-ondary compression is by means of rate process theory which describes secsec-ondary
com-pression as the displacement of the bonds between molecules or group of molecules at
molecules, and/or particles participating in a time-dependent flow or deformation pro-cess (termed flow units) are constrained from movement relative to each other by energy
barriers separating adjacent equilibrated positions (Wu et al., 1966; Mitchell, 1992).
In concert with the mechanism of the time-dependent behaviour of soils, another
ma-jor question is when creep occurs during the settlement process. Experimental analysis
and models developed generally treat consolidation and creep compression as either
sep-arate or simultaneous processes. This division leads to two philosophies, called
hypothe-ses A and B (Ladd et al., 1977; Jamiolkowski et al., 1985). Both hypothehypothe-ses consider
pri-mary consolidation as a hydrodynamic phase in the settlement process, and controlled
by the dissipation of excess pore water pressure. Hypothesis A separates strains induced
from the dissipation of excess pore water pressure from those due to creep and predicts that the relationship between end-of-primary (EOP) void ratio and effective stress is the
same for both laboratory and field conditions. Consequently, at the completion of
pri-mary consolidation, the stress-strain curve obtainedin-situis the same as that obtained
in the laboratory on small test specimens. Hypothesis B assumes that some sort of
"struc-tural viscosity" is responsible for creep and that creep occurs during both the
consolida-tion phase and under the final (constant) effective stress. Hence, for hypothesis B, the
EOP strain increases with sample thickness (Degago et al., 2011). An implication of the
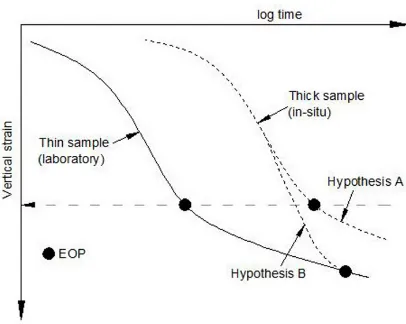
two hypotheses in terms of effective stress-void ratio is presented in Figure 2.1. Although a
certain amount of experimental work has been performed in an effort to prove or disprove either of the respective hypotheses (Berre and Iversen, 1972; Leonards, 1972; Mesri and
Godlewski, 1977; Mesri and Choi, 1985), much of the evidence is unconvincing (Leroueil
et al., 1985b). In the past decade, this topic has been thoroughly discussed and a common
view has been obtained that cohesive soils behave in conformity with hypothesis B. The
advocates of hypothesis A (Mesri et al., 1973; Mesri and Godlewski, 1977; Mesri and Choi,
1985; Mesri et al., 1997; Feng, 1991; Mesri, 2003; Mesri and Vardhanabhuti, 2005) claimed
the existence of the uniqueness of the void ratio-effective stress relationship, however their
experimental data and mathematical derivations were re-examined by other researchers
(Degago et al., 2009; Yin and Graham, 1990; Degago et al., 2011) and an opposing
conclu-sion was made. The main defects of the proofs supporting hypothesis A lie in the ambigu-ous determination of EOP as well as the violation of basic axioms of continuum mechanics
by claiming a unique EOP effective stress-strain relationship, irrespective of consolidation
duration (Degago et al., 2013). Further, some laboratory and field test data imply the
va-lidity of hypothesis B, such as Kabbaj et al. (1988) who compared the behaviour of four test
embankments with the results of laboratory tests and showed that the laboratory EOP
con-solidation curve strongly underestimates in-situ settlements. Concon-solidation models both
Figure 2.1: Effect of sample thickness on creep with respect to hypotheses A and B (after Ladd et al. (1977)).
2.1.1.2 Permeability and consolidation of peat
The permeability of peat decreases with decreasing void ratio and water content (Hobbs,
1986). Carlsten (1991) suggested a vertical permeability in the range 10−5- 10−7m/s for
vir-gin peat and showed this value reduced by 103at a relative compression of 50%. Despite the
spatial variations of the peat types, similar trends have been reported by Berry and Vickers
(1975) for a fibrous UK peat, Dhowian and Edil (1980) for fibrous Portage peat (Wisconsin,
the USA) and Mesri et al. (1997) for a fibrous Middleton peat (Wisconsin). The permeability
of peat not only depends on the void ratio, but it is also related to the microstructure of the
peat material, and so depends on the degree of humification and the structural anisotropy
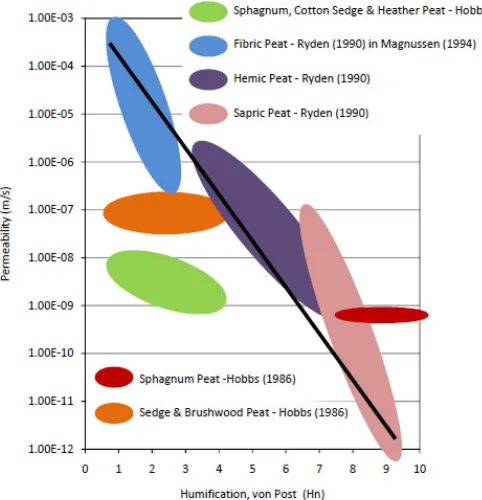
(MacFarlane and Radforth, 1965). The more humified the peat is, the lower the
permeabil-ity it possesses. Figure 2.2 illustrates the relationship between the permeabilpermeabil-ity and the degree of humification.
Dhowian and Edil (1980) reported the permeability anisotropy resulted from fibre
ori-entation with a horizontal permeability of about 300-fold higher at a given void ratio than
the vertical permeability by the variable hydraulic head method during consolidometer
tests. However, much smaller permeability anisotropy was reported by most other
re-searchers. Mesri et al. (1997) reported that the anisotropic permeability with the value
kh0/kv0=10 at a in-situ void ratio of 12.0 for Middleton peat. Zhang (2013) calculated the
permeability of the vertical and horizontal specimens in oedometer tests and reported that
the ratio of the coefficients of permeability anisotropykv/kh increased from 2.37 to 3.19
with the void ratio change from 10 to 2 with a 103drop in permeability values. Zwanenburg (2005) had a closer examination of the permeability during the different triaxial test stages
and found that for the initial phase a considerable change in permeability occurs while for
the following phase the permeability is nearly constant. The reported permeability data in
Figure 2.2: Relationship between permeability and humification for different types of peat (Jennings and Johnston, 2013).
In the literature, the terms consolidation and drained compression are often
inter-changed to describe the same process. This review deliberately separates the two terms to
facilitate a clear understanding of the mechanical behaviour of peat, albeit consolidation
is a subset of compression. In this review, consolidation of peat refers to the dehydration
process under an applied load for a period of time, whereas the compression of peat refers
to the rest compressive behaviour, either drained or undrained, under a strain- or
stress-controlled compressive load for a period of time. Due to the cellular parental vegetation of
peat and the interstices between the partly decomposed plant remains, the two-level
struc-ture of macro- and micro-pores is a substantiated interpretation of the long-term creep
for peat materials (Edil and Den Haan, 1994). Figure 2.3 shows a scanning electron micro-graph that distinctly presents the porous structure of a slightly decomposed (H4 on von
Post scale) sphagnum peat.
Adams (1963) described that primary consolidation of fibrous peat was considered to
be due to the drainage of water from the macropores and that secondary compression
was due to very slow drainage of water from micropores into macropores. Barden (1968)
claimed that the dominant viscous mechanism governing the consolidation of amorphous
(colloidal) peats could be described in terms of structural viscosity and reversible thixotropy
(the time dependent change in particle arrangements, adsorbed water structure and
distri-bution of ions (Den Haan, 1992)). Dhowian and Edil (1980) observed significant
decreas-Figure 2.3: Scanning electron micrograph of a sphagnum peat (O’Kelly and Zhang, 2013).
ing drastically during consolidation. From observations of in-situ seepage tube and
auger-hole tests, Hemond and Goldman (1985) concluded that the dramatic changes in appar-ent hydraulic conductivity of peat can be explained by its large elastic storativity of pore
water. Hobbs (1986) stated that the consolidation of peat involves the expulsion of pore
water accompanied by a structural rearrangement of the solid particles; the two processes
occurring simultaneously in the early stages, but following the decline of the excess pore
water pressure to a very small value, the structural rearrangement and expulsion of water
from micropores continue as a creep-like process. The rate of creep generally increases
with increasing organic content due to a higher porosity (Landva and La Rochelle, 1983).
Although Hobbs (1986) and Mesri et al. (1997) found that, in most cases, the EOP
consol-idation can be estimated from Casagrande’s log-time method or Taylor’s square root-time
method, Edil and Den Haan (1994) concluded that the only reasonable estimations for the time periodtp required to achieve EOP are those based on pore water pressure
measure-ments. Zhang and O’Kelly (2015) scrutinized the salt addition effect on the consolidation
of fibrous peat which experimentally supported the postulation of two-level structure in
fibrous peat, where the salt additions accelerated the consolidation process of the fibrous
peat due to electro-osmotic effect.
Oedometer tests without pore water pressure measurements are the most commonly
used tests for investigation of the one-dimensional (1D) consolidation of peat. A typical
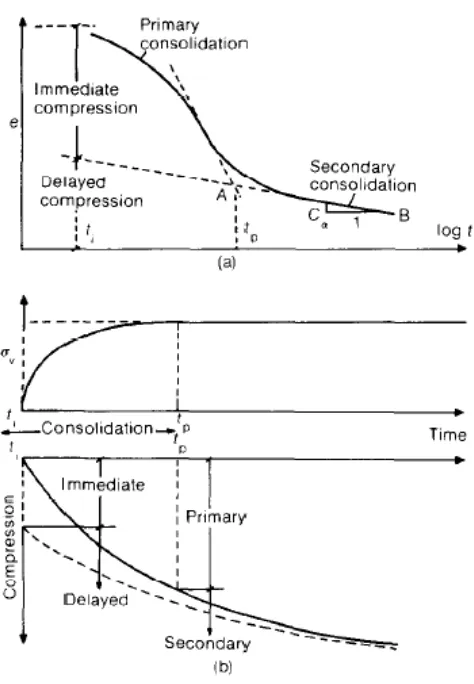
in-cremental load oedometer test result of undisturbed fibrous peat is presented in Figure 2.4,
which depicts the 1D loading-unloading void ratio–effective stress curves during both the
primary consolidation and secondary compression. The rebound index,Cs =∆e/∆σ0v, increases with overconsolidation ratio, OCR=σ0
v(max)/σ0v, and increases slightly with the decrease inσ0
that there is a unique relationship between the coefficient of secondary compressionCα
[image:30.595.194.404.145.359.2]and the primary compression indexCc. TheCα/Cc concept will be elaborated later in the modelling review section.
Figure 2.4: EOP void ratio versus effective stress curves of 24 undisturbed Middleton peat specimens (Mesri et al., 1997).
Over a three year period, Berry (1983) carried out Rowe cell consolidation tests to
deter-mine the long-term secondary compression behaviour of a fibrous peat (Figure 2.5). The
two-level structural consolidation model was used to predict the field consolidation curve
and estimate the required surcharge, and Berry (1983) concluded that although a field pilot
scheme is also necessary, the consolidation theory for peat may be used to determine the
optimum surcharge load required for the reclamation of a peat deposit. From Figure 2.5, it
can be seen that the tangential slopes of the consolidation curves gradually increase after
the hydrodynamic phases (curve shown before the vertical arrow in Figure 2.5). Edil and
Dhowian (1979) and Dhowian and Edil (1980) term this increase as tertiary compression and interpreted it as decreasing strain rate, changing at an increasing rate. Colleselli et al.
(2000) studied the compressibility characteristics of three Italian peats using a 70.5 mm
diameter oedoemter and a 75.5 mm Rowe cell with pore water measurement at the base
of the specimen and found that the higher was the fibre content of peat, the larger was the
tertiary compression.
The main characteristics of peat consolidation can be summarized as (1) peat is
ex-tremely compressible under loading, experiencing high initial rates of primary
consoli-dation and substantial creep (Landva and La Rochelle, 1983; Santagata et al., 2008; Wong
et al., 2008) with the creep component often greater than the hydrodynamic component
Figure 2.5: Typical experimental results for vertical consolidation tests on 250 mm diame-ter, by 75 mm thickness undisturbed samples of fibrous peat (Berry, 1983)).
parental vegetation as well as the degree of humification (Hobbs, 1986; Pichan and O’Kelly,
2012; Zhang and O’Kelly, 2015), and is extremely spatially variable (Hobbs, 1986).
An important contribution on the 1D consolidation of peat was made in GeoDelft with
theirK0-CRS oedometer, which is a constant rate of strain oedometer with measured
lat-eral stress (Den Haan, 2001). Drainage is from the top and pore water pressure is measured
at the bottom of the specimen, with a dimension of 63 mm in diameter and an initial height
of 20 mm. The apparatus provides continuous readings of strain, vertical and horizontal
total and effective stresses, side friction loss and pore pressure. The complete stress
con-dition obtained from theK0-CRS tests makes the test results amenable to the 1D as well
as 2Dabc isotache model (Den Haan, 1994, 1996), which is one of the most prominent
models developed for peats. Figure 2.6 shows the capability of the three testing methods
to generate information on creep properties in aK0-CRS test. This test could provide the
model parametersa,b andc by different test methods (Den Haan, 2001).
Figure 2.6: Three testing methods for creep properties in a K0-CRS test (translated from
Den Haan (2001)).
peat, consolidation tests in triaxial cells were carried out for the investigations of (1) the isotropic and anisotropic consolidation effects on the strength of peat (Adams, 1961) as
well as (2) the consolidation of soft peat specimens to target levels of effective stress for
the subsequent compression/shear tests (Zhang and O’Kelly, 2014b). The stiffness as well as shear strength of peat can be increased by a large reduction of water content through
consolidation (Den Haan, 1997). Triaxial testing is one of the routinely used methods
in practice due to its good repeatability. The triaxial apparatus provides close control of
the specimen stress and boundary conditions, with pore-water pressure measurement.
The pros and cons of effective stress strength testing of peat in triaxial compression has
been described by O’Kelly (2015) and O’Kelly and Orr (2014). As reported in O’Kelly and
Zhang (2013), an extensive review of the literature produced relatively few studies report-ing consolidated-drained (CD) triaxial compression testreport-ing of peat (Adams, 1961; Hollreport-ing-
Holling-shead and Raymond, 1972; Holubec and Langston, 1972; Tsushima et al., 1977; Marachi
et al., 1983; Farrell and Hebib, 1998; Zhang and O’Kelly, 2014b) and a few on
consolidated-undrained (CU) triaxial compression (Yamaguchi et al., 1985; Zwanenburg, 2005; Hendry,
2011; Hendry et al., 2014). The characteristics of peat consolidation in triaxial cell are
summarized as: (1) The primary consolidation is quick; (2) Specimen size effect exists in
the triaxial consolidation tests. Zwanenburg (2005) reported that a clear Mandel-Cryer
ef-fect is found in large triaxial samples (0.4 m in diameter and 0.6 m in height) whereas no
Mandel-Cryer effect can be distinguished for a conventional triaxial sized sample. The Mandel-Cryer effect is the term used for the inhomogeneous consolidation behaviour in
peat where the consolidation of the outer radius of the sample leads to volumetric strain
in the outer area and induces a redistribution of stresses in which a part of load carried by
the outer radius is transferred to the yet unconsolidated inner core of the sample. (3) Pore
pressure measurements may be influenced by the presence of bio-gas trapped within the
tested peat specimens (Hobbs, 1986; Zwanenburg, 2005; Couwenberg, 2009).
Regarding laboratory investigation of the time-dependent behaviour of peat, very few
relaxation tests (constant strain, zero strain rate) were reported in the literature. Drained
relaxations were carried out in theK0–CRS cells by Zwanenburg (2005) and Den Haan and
Kruse (2007), which is a special case of the constant strain rate test at zero strain rate. The test data was used for calibrating the consolidation model derived from creep tests.
2.1.2
Compression and shear of peat
The two-fold purpose of compression tests, either strain- or stress-controlled, on peat are to obtain (1) the compressive behaviour (quantifying settlements); (2) the drained/undrained strengths (maximum stress at failure). In the early days of soil mechanics theory,
tests. The following section reviews the conventional Mohr-Coulomb theory on quantify-ing peat’s shear strength; the distquantify-inguished peat behaviours found in the triaxial tests; and
the rate-dependent tests carried on peat.
The conventional approach for quantifying the strength of peat materials in the
lab-oratory is using Mohr-Coulomb failure criterion, i.e. deriving the friction angle and the
intrinsic cohesion for both drained and undrained triaxial tests. Opinions differ over the
nature of peat strength from entirely cohesive to entirely frictional in 1950s and 1960s by
Hanrahan (Hanrahan, 1952, 1954a,b; Hanrahan and Walsh, 1965; Hanrahan et al., 1967),
the strength of peat was commonly defined by the friction and cohesion. Low effective
co-hesion values of nearly 0 kPa for peat materials have been reported by many researchers
such as Marachi et al. (1983); Farrell and Hebib (1998). Very high friction angles upto 55◦ were reported for fibrous peats (Adams, 1961; Farrell and Hebib, 1998) due to fibre effects.
Hendry (2011) stated that the shear strength of intact peat is made up of inter-particle
friction as well as tension in the peat fibres. The triaxial test results were compared by
Long (2005) with results obtained by other testing apparatus, such as simple shear test,
vane shear test, direct shear box test, etc. Yamaguchi et al. (1985) explain the high
fric-tion angle obtained from undrained triaxial tests on fibrous peat as the predominantly
horizontal fibres providing additional shearing resistance and an elastic stiffness that is
cross-anisotropic. It is anticipated that a higher friction angle could be obtained for more
structured or fibrous material. However, O’Kelly and Zhang (2013) obtained similar ef-fective friction angles from consolidated drained triaxial compression tests for the same
peat material with three very different fibre contents and Edil and Wang (2000) reported
the same finding for fibrous and amorphous peats. It is also interesting to note that the
universally reported effective friction angle for peat without fibre enhancement is around
30◦ defined at failure or 20 % strain in different testing apparatus, including Dutch peat (Den Haan et al., 1995), Irish peat (Farrell and Hebib, 1998; Zhang and O’Kelly, 2014b),
Canadian peat (Adams, 1963; Hollingshead and Raymond, 1972; Landva and La Rochelle,
1983). The summary of effective friction angleφ0from the drained triaxial tests reported in the literature is presented in Figure 2.7. The central problem in obtaining the cohesion
and friction parameters in drained triaxial tests lies in that peak values of stress are usually not achieved even for shear strain larger than 20 %. As reported by O’Kelly (2015), unlike
shearing at frictional contacts in uncemented mineral soils, the strength of peat is derived
from the connectivity between elementary structures; that is, failure mostly involves
tear-ing of elementary structures, entangled fibres and cellular connections (Boylan et al., 2008;
Landva et al., 1986). The physical meaning of the friction angle and cohesion in peat may
not be the same as in mineral soils since the particle concept in fibrous peat is
Figure 2.7: Values of effective friction angleφ0deduced from drained triaxial compression of peat (adapted from O’Kelly and Zhang (2013)).
Adams (1961, 1965) claimed that it is impossible to secure undisturbed samples for
lab-oratory testing. He carried out a series of drained and undrained triaxial tests on
undis-turbed peat samples of water content ranging 200 % - 600 % and reported a small value of the coefficient of lateral earth pressureK0=0.18, which confirmed the behaviour of a
small lateral strain during the drained compression tests and found that preconsolidation
and anisotropic consolidation had little effect on the strength parameters of peat in
tri-axial compression. The consolidated drained compression tests on the undisturbed peat
specimens lasted for three months until sign of failure showed and very large axial strain
(up to 50 %) and deviator stress (up to almost 900 kPa) were recorded. The drained
tri-axial compression of peat is found to be nearly 1D without bulging (O’Kelly and Zhang,
2013; Zhang and O’Kelly, 2014b). Hanrahan (1954a) reported that during undrained
tri-axial compression of an Irish fibrous peat, the horizontal effective stress reached zero at
failure. A major technical hurdle in evaluating peat strength is that, due to the low bulk unit weight of peat of typically 9.5 - 11.5 kN/m3, the effective stresses occurring in the
field are lower than the lower bound stress-level capabilities of most testing equipment
(O’Kelly, 2015). Drained triaxial compression tests are seldom performed because of gross
change in specimen shape and dimensions that occur during the course of the tests (Edil
and Wang, 2000), and also presumably because the compression stage necessitates
signifi-cantly slower rates of axial strain in order to allow direct measurement of the effective stress
shear responses. However, for undrained triaxial tests on peat, the relatively large testing
strain rate may magnify the eccentric placement of the specimen under loading, thus
in-troducing specimen distortion failure (Hendry, 2011). A typical undrained triaxial
stress value can be obtained. For both undrained and drained triaxial compression tests, a failure envelope is usually not developed (Farrell and Hebib, 1998; Ajlouni, 2000; Hendry,
2011; O’Kelly and Zhang, 2013; Zhang and O’Kelly, 2014b). The role of peat fibres in its
shear strength is claimed to be only in providing elastic tensile resistance (Hendry, 2011)
but Zhang (2013) found the fibres can also resist compressive stress from oedometer tests
on undisturbed vertical and horizontal peat specimens.
Figure 2.8: Stress strain response of consolidated undrained triaxial testing of two Cana-dian undisturbed peat samples (Hendry, 2011).
The fibrous character of peat is one of its most distinctive properties. Farrell and Hebib (1998) investigated the mechanical behaviour of a fibric peat and found that peat
speci-mens tested in drained triaxial compression deformed approximately one-dispeci-mensionally
under loading without achieving failure (as defined by peak deviatoric stress) for up to 35 %
axial strain. In undrained triaxial compression, the pore water pressure may rapidly build
up, almost reaching the applied cell pressure, thereby producing an effective lateral stress
approaching zero on account of the low Poisson’s ratio of fibric peat (Farrell, 2012). O’Kelly
and Zhang (2013) and Zhang and O’Kelly (2014b) performed drained triaxial compression
tests on peat specimens prepared from the same parent material and found that the lowest
Poisson’s ratio (0.02 - 0.03) was achieved for undisturbed peat, a slightly larger Poisson’s
ra-tio (0.04 - 0.05) for reconstituted peat and a significantly larger Poisson’s rara-tio (0.13 - 0.16) for blended peat at up to 20 % axial strain. The low Poisson’s ratio for undisturbed and
re-constituted peat material was attributed to the lateral resistance induced by the fibres and
also to the tensile strength of the fibres themselves.
It is a universally accepted fact that the mechanical behaviour of peat is time-dependent
(Hobbs, 1986; Farrell, 2012; Degago et al., 2009; Mesri and Ajlouni, 2007; Den Haan and
Kruse, 2007), and thus rate-dependent. The testing of the strain rate effect of soil is mostly
studied in clay (Leroueil et al., 1985a; Hight and Leroueil, 2003) showing that the yield
stress, the entire 1D compression curve and the undrained shear strength are strain-rate
dependent for clay soils. Little similar work for peat is reported in the literature (Long and