Thrnout or turned om Electoral participation in Dublin in the
early 21st Century
Adrian Kavanagh
Department of Geography, National University of Ireland, Maynooth.
Introduction
Voter turnout is defined as the percentage number of registered voters who vote in an election - although the valid adult population (those aged 18. and over). is taken as the base from which turnout rates are calculated in other countries. such as the USA. Turnout levels have generally been in decline in Western democracies for the past few decades, as is also the case in the Republic of Ireland. Turnout in the 2002 General Election was the lowest for an Irish general election since the end of the Civil War, and this marks a continued trend of steady decline over the past two decades, in the weak of a period of siable, high turnout, in the 19705, as Figure 1 illustrates. This general trend is also mirrored in similar declines in participation rates for other election types over the same period, although there was a notable increase in local and European election turnouts in the June 2004 elections (Kavanagh, 2004). TurnoUiS in socially-deprived urban areas have fallen to exceptionally low levels, particularly in inner-city and western suburban areas in Dublin. Problems related to voter turnout feature amongst the most significant concerns facing the Irish political system at present, being viewed as "problematic on all levels" by Marsh el a/. (2001: 171). Democracy is weakened if the
num-bers voting in elections are in decline, while cross-constituency turnout variations involving socio-economic or demographics biases will have an impact on the final election results and resulting policy outcomes, which may act to further peripheralise already marginalised groups (Lyons and Sinnott, 2003). Lijphart (1997) has argued that low and declining turnouts are of concern because of their implications for the strength of democracy and because they often entail a class bias that leaves the less well off in society as significantly under-repre-sented. Similarly, age-related differentials in turnout levels entail that certain age cohorts will receive differential levels of access to the decision-making process relative to other cohorts. Thus it is important to study how-economic and demographic factors may influence turnout levels.
2 Adrian Kavanagh
Table I. Summary of different factors associated with a.-eas of higher turnout and low turnout in the electoral literature
Higher Turnout Lower Thrnout
Older populations Younger populations
Married people Single or Separated people
Residential stability Population mobility
Rurally based/Agricultural employment Urban-based employment Affluencelhigh levels of social well-being Social deprivation
High levels of education Low education standards Owner occupied housing Local authority or private rented housing High levels of political mobilisation Low levels of political mobilisation
Proximity to the polling station Distance from the polling station High levels of political choice Low levels of political choice
Weekend voting Voting on weekdays
Thus tumout levels, and spatial variations in these, are the result of a complex mixture of many different influences and the manner in which these are expressed in different geographi-cal contexts, as is particularly highlighted by Agnew's multidimensional place-ccntred per-spective on political behaviour (Agnew, 1987, 1996). This views political behaviour as being mediated and structured within distinct places, with the influence of these places being under-stood in terms of three different aspects, namely those of locale, location and sense of place. Locale refers to how a place acts as a setting for social interaction, location refers to how that place relates to other places and wider social forces and structures, while sense of place details the level of attachment between this place and the people living in
it.
Such a perspec-tive, Agnew (1987, 1996) argues, allows a shift from generalised and simplistic perspectives on political behaviour, leading instead to an understanding of how the political behaviour of individual human agents may be channelled within they places that they live, as a resuh of a complex interaction between that place and external social influences of regional, national and global dimensions. Agnew thus views the continuing significance of place as a positive factor in accounting for varied levels of political participation, noting that it is often parochial concems and activities that act to transfonn passive consumers of elite policies into active citi-zens. He thus argues that if participation is based on place-specific conditions and decisions, then a more microscopiC analysis of what shapes such participation levels will be required. The main focus of this paper will be to understand what shapes voting, or non-voting,Turnout or turned oJ!? 3
elections, most notably the dcgree to which local election turnout levels in 2004 varied from turnout Icvels for other recent elections, and will seek to analyse the extent to which such turnout varies between different geographical contexts.
As a result of the 1997 Electoral Act, it is now possible to calculate accurate turnout figures for very small geographical areas, such as town lands, streets or housing estates, which further facilitates the microscopic analysis of turnout called for by Agnew. Turnout for areas, such as housing estates, apartment complexes or streets, can be calculated by counting the total number of marks on copies of the marked register, indicating who has voted in that polling station, and relating these figures to the total numbers registered. The data can then be aggre-gated up to the electoral division (ED) level, which is suitable for computer cartography and for statistical analyses involving census data. Analysis of this kind ofdala has been carried out for a number of rural and urban constituencies in the 1999 local and European elections. This involved detailed spatial analyses of local election turnout rates in rural and urban, midd le-class and working-class contexts, as well as inner-city and sub';lrban contexts (Kavanagh, 2002a and 2002b). A recent article in Irish Geography reports on how such analysis has pro-duced an electoral division-level map of turnout for the Republic of Ireland (Kavanagh, Mills and Sinnon, 2004). Such marked register-generated turnout figures will form the main data set for this analysis, while further turnout data is gleaned from an analysis of tbe ballot reconc ili-ation fib'UfeS for the referendum elections of2oo I and 2002.
Figure I. Comparison between average turnouts in Dublin and the rest of the county for elections held during 1999-2004 period. IGE -General Election, LE - Local Elections, NRF -Nice Treaty Referendum.]
",---
---
--
---
---
---,
~~--,__r---~
• o.bIin
o
Rf'SI of/re/muiTemporal and spatial variations in turnout in Dublin
4 Adrian Kavanagh
However, the considerable urban-rural differences associated with local elections were not as pronounced for the 2004 contest, as a rise of17.0 per cent in the local eleclion turnout levels in the Dublin area, relative to a less striking increase elsewhere, reduced the degree of turnout difference between Dublin (53.0%) and the rest of Ireland (60.8%) for these electoral contests. General election turnouts have generally been lowest in the Dublin region also, as was the case for the 2002 contest in which the average Dublin turnout (56.3%) was significantly lower than for the rest of the State (65.2%). A more detailed spatial analysis of turnout variations in this election (Kavanagh, Sinnott and Mills, 2004) shows a significant concentration of low turnout, not alone in the Dublin region, but extending outwards to encompass much of the city's commuter belt, extending in an arc southwards from Droghcda through much of Meath and Kildare to take in parts of Carlow and Wicklow.
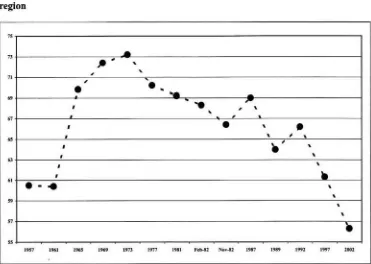
Turnout levels in Dublin, as in the rest of the country, have generally been in decline over the past few decades, although there has been some level of fluctuation involved with this trend also, as Figure 2 shows. The 2002 General Election represented the lowest ever turnout in Dublin for a general election and the first time in which the average Dublin turnout fell below the 60 per cent level. Prior to this, the lowest general election turnouts in the region had been associated with the 1950s and early 1960s, when turnouts remained just above the 60 per ceO! level during this period. Turnouts increased throughout the 1960s to reach a relatively high level of 73.2 per cent in 1973, but have declined since then to reach the record low of 56.3 per cent in 2002, although turnout increases in the 1987 and 1992 contests obscure this trend somewhat (Sinnott, 1995).
Figure 2. Temporal trends in average general election turnout levels within the Dublin region
"
"
If
.
,
"
•
,
•
.
...
•
•
0
..
,
.
,
"
0•
,
•
0
,
•
"
0e
'
,
"
0,
0
,
0
..
"
•
.
..
,
,
,
,
•
"
e
"
om..
,
,~ ,~,m
,m
[image:4.482.59.430.396.660.2],-TurnolJt or turned off? 5
The highest levels of turnout for referenda, however, tcnd to be associated with the Dublin area and particularly with the more middle-tlass parts of the region. While the differences in turnouts is not as pronounced as for local and general elections, average referendum turnouts in this region have tended to be consistently higher than for the rest ofthe country, as was par-ticularly the case for the 200] Nice Treaty Referendum, when average turnout in thc Dublin region was 38.1 per cent, against a significantly lower turnout of 32.8 per cent in the rest of
Ireland. Dublin still had higher turnouts for the subsequent 2002 Nice Treaty Referendum, although the difference between the average turnouts in Dublin (50.2%) and the rest oflreland (47.8%) was not as pronounced in this case.
Within Dublin, there is a very pronounced and rather consistent pattern to the spatial varia-tions in turnout, as the highest turnouts tend to be in the more middle-class and settled pans of the city while lower turnouts are generally associated with areas with high levels of social
deprivation and population mobility. An electoral division-level analysis of turnout variation in the 2002 General Election associated high turnout with area~ such as Malahide, Sutton, Clontarf, Dnuncondra and Castleknock in the northern part of the region and areas such as Lucan Village, Terenure, Templeogue, Stillorgan, Dundrum and Foxrock in the southern pan of Dublin. Low turnout was associated with the Darndale, Ballymun and Mulhuddart-TyreUstown areas in the nonhern pan of Dublin and the Ballyfermot-Cheny Orchard, Nonh Clondalkin and West Tallaght areas in the southern pan of the city. The main concentration of low turnout in the city was, however, centred on the inner-city area, with further low turnout areas located just to the south of the inner city, across the Grand Canal, encompassing pans of the Drimnagh, Crumlin, Ranelagh and Rathmines areas (Kavanagh, Sinnott and Mills, 2005).
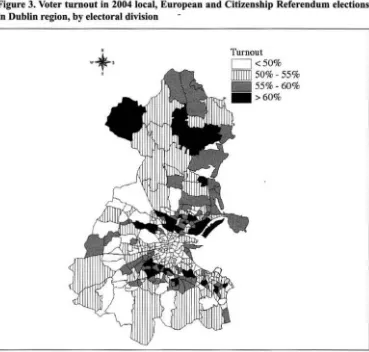
The geography of turnout for the more recent local, European and Citizenship Referendum elections largely mirrors this trend, although levels in some low turnout areas have increased relative to others, as Figure 3 shows. The map showing intra-urban turnout variations within the Dublin region for these elections shows concentrations of high turnout in various pans of the Dublin region, but mainly focussing on two distinct areas. One of these encompasses much of the north city area, stretching across the nonhern inner-suburban parts of the city from CloOlarf and Rahenyon the east coast through Drumcondra, Glasnevin and West Cabra to the Ashtown and Castleknock areas. The second major concentration is found in the south -ern part of the city, and includes the Templeoguc, Terenure, Churchtown, StilJorgan and Foxrock areas, as well as pans of the Dalkey area. There are a number of other high turnout areas in Fingal County, including Malahide, Lusk and Ganistown. Low turnout areas in the north of the city include Darndale and Ballymun, as well as the Abbotstown and nonhern environs of Lucan areas. Low turnout areas in the southern pans of the Dublin region include Cheny Orchard, Clondalkin Village, West Tallaght, Edmonstown, Tibradden, and parts of the Loughlinslowo and Killiney areas. The main concentration of low turnout in the region is, again, focused on the Inner City, with this area of low turnout also extending south of the Grand Canal to take in the Kimmage, Ralhmines and Rane1agh areas. As such, this spatial pat-tern largely replicates the trend observed for the 2002 General Election and, indeed, all recent electoral contests, but what is notable is thai a number of atypical low turnout working-class areas, such as North Clondalkin, Ballyfermot, Finglas and Crumlin, are not included amongst the low turnout areas for the local election contest.
6 Adrian Kavanagh
Figure 3. Voter turnout in 2004 local. European and Citizenship Referendum eledions In Dublin region, by electoral division
•
.
-,t.
Turnout<50% 50% -55% 55% - 60% >60%
continuance of a trend that has marked recent elections in which the lowest turnouts natio n-ally are generally recorded in inner Dublin. One reason for its low participation rates in local elections is the strong concentration of disadvantaged communities in this area, but the main cause is the exceptionally low local election turnouts associated with the new private
'gated' apartments that have mushroomed in this area over the past decade (Kavanagh, 2002a). Low turnouts in this area, thus, result in part because of the high levels of pop-ulation mobility in this area, with the Dublin Inner City population increasing by 23.4 per cent over the 1996-2002 period. The new, mainly middle-class, residents have little interest in participating in local elections, as they engage little with their new communities, have little interest in local political issues, and have no knowledge of local political figures.
While the spatial pattern of turnout trends across Dublin has remained fairly consistent, the extent of the turnout variations between the high and low turnout parts of Dublin tends to
Turl10ut or turl1ed off? 7
General Election and 1999 Local Elections in the Dublin region, by and large, although these
differences were less pronounced when the general election turnouts were contrasted with turnoUiS in the 2004 Local Elections. There was less variation between general election and
referendum turnouts, particularly in the more middle-class parts of the Dublin region. Low turnoUis for referenda in working-class areas and the high referenda turnouts in middle-class areas meant that turnout variations between general elections and referenda were especially pronounced in the more working-class and socially-deprived areas. In a number of cases, local election turnouts were higher than referendum turnouts in the working-class areas, while, by
contrast, referendum turnouts were significantly higher than local election turnouts in the more
middle-class areas.
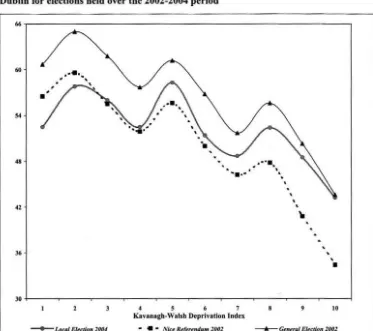
Figure 4 shows contrasting turnout levels for the 2004 local elections, 2002 General Election, and the 2002 Nice Treaty Referendum. On average, turnout in the general election (56.3%) was highest, on average within the Dublin region, while the local election turnout (53.0%) was slightly higher than the referendum turnout (50.2%). On an intra-regional level turnout differences between these local and referendum elections tended to vary in line with the class
characteristics of areas. Based on an index of relative affluence, drawn from a principal com -ponents analysis of deprivation-related indicators from the 2002 Census, referendum turnouts
Figure 4. Mean turnout levels against relative deprivation levels for electoral divisions in Dublin for elections held over the 2002-2004 period
..
..
,.
'
,
~.,.
4 5 , 7
Kuana&h-Walsh Dtpl"l~.lloo Index
- • • Nk. R.ft",M"", lNl
,
-
'
.
.
"
.
•
,,
•
,
,
•
[image:7.489.57.430.324.655.2]8 Adrian Kavanagh
are shown to be slightly higher in the more affluent electoral divisions within Dublin City, while local election turnouts are significantly-higher in the most deprived elcctoral divisions. Moreover, the gap between general and local election turnouts is relatively significant in the case of the most amuent electoral divisions. but this difference declines with increased levels of deprivation to be rendered almost insignificant in the case of the 10 per cent most deprived electoral divisions in Dublin City. Referendum turnout is also shown to be more responsive to elass factors than local election turnout is. A differencc of22.1 per cent exists between the mean referendum turnouts for the most affluent and most deprived groups of electoral divi·
sions, contrasted with differences of 19.0 per cent for the general election and just 12.8 per
cent for the local elections. Within the Dublin City area, the referendum turnout was higher
than the local election turnout in, mainly middle-class, places such as Terenure, Rathmines,
Rathgar, Sandymount and Sulton, as well as parts of the Raheny, Clontarf, Giasnevin, T
em-pleogue and Dublin Inner City areas. In more working-class pans of the city. local election
turnouts were significantly higher than the turnout for the 2002 Nice Referendum, with dif
-ferences of at least 7.5 per cent in areas such as Damdale. Ballymun, Finglas, West Cabra. Cherry Orchard, Ballyfennot and Crumlin, as well as pans of the South West Inner City and North Docklands areas.
Figure 4 suggests that Dublin turnout levels, particularly in referenda. are highly responsive
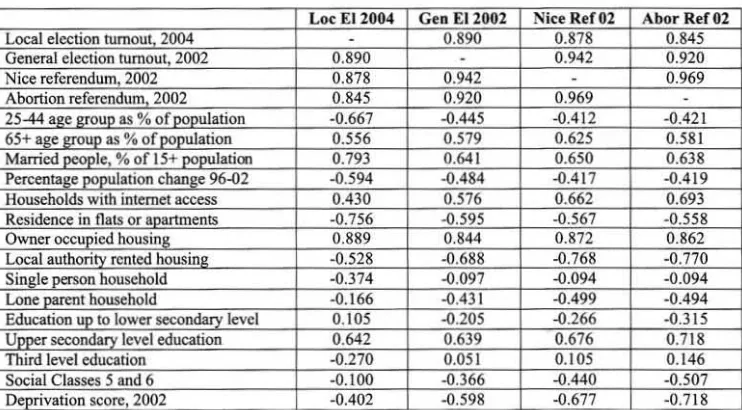
to socio-demographic factors and this contention is supported by Table 2, which presents the strength of the statistical associations between various socio-economic and demographic
fac-tors and turnout levels in the recent general, local and referendum elections.
Table 2 shows that the associations between turnout for most election types and the different
socio-economic and demographic factors largely confinn the findings from the literature on the topic. Positive associations exist between turnout levels and the percentage of married
people and people in the older age categories, while negative associations exist with
percent-Table 2. Simple bivariate correlations between turnout levels for different election types
[image:8.486.57.428.452.657.2]Turnout or turned off? 9
age population change and the percentage of people in the younger age categories. Housing tenure is also strongly related to turnout variations, based on the correlation analysis, with positive correlations existing between turnout and owner occupied housing and negative cor-relations with the percentages living in fiats or apartments, or in local authority rented hous-ing. Factors relating to social well-being are also related to turnout variation by the correlation analysis, as seen in the positive correlations with households with internet access and the negative correlalion with the deprivation score, local authority housing, lone parent house-holds, and the semi-skilled and unskilled social class groups. The relationship between educa-tion and turnout variation, however, is not as clear-cut. Strong and positive associations ex.ist between upper secondary level education and turnout levels for all election types, but the relationships between low turnout and education up to lower-secondary level, and especially between high turnout and third-level education, for general and referendum elections are decidedly weaker. The reverse panern actually emerges for the relationships between these educational levels and local election turnout, with third level education associated with lower local election turnout and a positive association between local election turnout and lower edu-cational levels.
Regression equations were developed for the three most recent elections within the Dublin region; the local, European and Citizenship Referendum elections in 2004 and the general election and Nice Treaty Referendum of2002, as illustrated by Table 3. Three factors, relating to demography, social well-being, housing tenure and population mobility, were included in this analysis. in terms of the overall variance that these factors accounted for in the different elections, the largest adjusted R-square values are associated with the local and referendum elections, thus mirroring, to some degree, an earlier finding by Sinnott and Whelan (1992: 162) that "the same factors account for turnout in both first and second order elections. and that the overall effect of these factors is in fact slightly stronger in second than in first order elections ". In all of the election types, high percentages of people aged 65, and over, and owner occupiers are seen to push up turnout levels, with the owner occupier factor being the strongest of the different factors input, as illustrated by the larger t-values associated with this factor for all of the election types. The effect of the population change variable, however, is not so consistent; it is associated with lower turnout for the local elections,
is statistically insignificant in the case of Ihe general election, and is inferred 10 push up turnout in the case of the referendum election. (Similar patterns emerge for the other refer-endum elections held during this time period; the 200 I Nice Treaty Referendum and the
2002 Abortion Referendum.)
Table 3. Multiple regression oftur-nout for different election types for Dublin City
LtlCflJ Elution 04 G~nt'fll Elulion 01 NiuRt ~r~ndJl'" 01
B T vatues B T yaluts B Tvalun
65+ as % of electorate 0.14 2.53 0.20 3.09 0.28 4.47
Owner O(:cu ied 0.28 16.59 0.28 13.65 0.33 16.97
Po ulation chan e ·0.08 -3.66 -0.01 -0.43 0.06 2.31
Constant 32.30 30.54 34.22 26.54 22.01 17.62
Ad·usttd R
""'"
0.81 0.72 0.77F Value 241.48 147.80 207.22
fac-10 Adrian Kavanagh
tors account for in the general and especially the local elections are probably capturing the different effects that locally based, often left-wing, candidates may have in pushing up turnout levels in working-class or socially-deprived parts of the city, as will be discussed in greater detail later in the case study analyses. Candidate effects will be greatest in local eJections, as more candidates - and, by extension, more locally-based candidates - will contest these,
while these effects have no bearing on referendum turnouts, over and above the ability of a politician to mobilise their local electorate to tum out for such contests. The b-coefficients and t-values show a similar pattern emerging for the different electoral contests, with lower turnout being associated with the percentage of households with no personal computers, the percentage of people living in council housing, and the unemployment rate. The only factor associated with positive b-coefficicnts and t-values is the cducational disadvantage faclor,
namely the percentagc of people who left full-time education before the age of 15. Such posi-tive figures may be accounted for by the higher percentage of older people falling within this category, once class-related concerns are controlled for, given the greater propensity for older people to vote in elections.
Table 4. Multiple regression o(turnout, involving deprivation related (acton, (or
differ-ent election types for Dublin City
Case Studies
[image:10.486.59.431.297.389.2]Turnour or turned ojJ? 1 I
Various factors have been suggested for the increases in the number of voters, such as the
holding of a contentious Citizenship Referendum on the same day. This appears to have becn particularly important in middle-class areas where referendum turnouts are typically high or
in parts of the city where immigration was viewed as a substantial political issue. Smaller
left-wing parties, such as Sinn Fein, the Socialist Party and the Socialist Workers' Party, played
important roles in mobilising large numbers of mainly working-class people, who had
previ-ously been non-voters, into turning out, which was particularly effective given the relatively
higher levels of interest in local election issues amongst working-class voters (Kavanagh,
2002a, 2002b). Higher working-class turnouts generally resulted in left-wing parties and can
-didates winning higher shares of the vote, as will be discussed !ated. A sustained conflict in
many working-class arcas over the introduction of bin charges in the years leading up to the
elections also had the effect of politicising a previously disinterested section of the Dublin
electorate, in the same manner as Anti-War protests may have politicised younger volers.
Non-partisan voter education campaigns, run by voluntary organisations, such as the Vincentian
Partnership for Justice, and particularly targeted at disadvantaged communities and younger
voters, may also have increased turnouts on a more localised scale. Finally, both the local
and European election contests proved to be unusually high profile contests in terms of media coverage and party competition, with exceptionally high levels of expenditure invested in election campaigns by all the parties, as evidenced in high amounts of spending on election
posters. This meant that the electorate was very much aware of the local elections and other
electoral contests in the run up to the elections, as opposed to the generally low profile
1999 contest.
The main areas of low turnout in Ireland in the 1999 local elections included the three inn er-city electoral areas in Dublin, as well as the Clondalkin, Ballyfermot, Lucan, Tallaght South,
Tallaght Central and Mulhuddart electoral areas in the western suburbs of the city. Turnouts
in these constituencies averaged oul around the 30 per cent level, in stark contrast to the high
turnouts associated with areas in the north-western counties of Leitrim, Sligo and
Roscom-mon, which were generally above the 70 per cent level (Kavanagh, 2004). This reflects the
general trend as regards intra-urban turnout varimions within the Dublin region, in which low
turnouts tend to be associated with many of the areas located within these electoral areas. This section will analyse the current turnout trends in the three inner-city electoral areas, North Inner City, South West Inner City and South East loner City, as well as in three electoral
areas in the western suburbs, Clondalkin, Lucan and Ballyfermot, areas with relativcly similar
population sizes and socio-demographic profiles. For the purposes of this paper, the Lucan,
Clondalkin and Ballyfermot electoral areas shall be collectively referred to as the "Greater Clondalkin" area, given Clondalkin's central position within this larger area. This section will particularly focus on the degree to which local election turnouts in 2004 differed from
turn-outs in other recent electoral contests. As noted above, the inner city yet again represented a
major area of low turnout for all the 2004 contests, but turnout levels were not as low in the
Greater Clondalkin area with levels in many of atypical low turnout parts of this area, with the
exception of Cherry Orchard, falling relatively close to the Dublin average.
Dublin Inner City
The Royal and Grand Canals largely bound the Dublin Inner City, with the area divided up
12 Adrian Kavanagh
area, such as the James Street area in the South West Inner City. Changes made by the 1998 Boundary Commission, however, succeeded in ensuring that division of the area is similar in the case for general and local elections. The area is also divided for administrative purposes and the Dublin Inner City Partnership has divided the area into four quadrants; North East
_~
_ _ _
~_ _
_
~~_ _
_
~Th_East and North West quadrants fall within the Dublin Central Dilil constituency and the North Inner City local electoral area, most of the South Wcst quadrant falls within the Dublin South Central Dail constituency and South West Inner City local electoral area, while the South East quadrant and eastern part of the South West quadrant fall within the Dublin South East Dail constituency and the North Inner City local electoral area. These constituencies tend to be
shared with areas that have higher turnout levels, such as Kilmainham in South West Inner City electoral area and the North Docklands area in North Inner City electoral area.
Figure S. Dublin Inner City as broken into by district electoral divisions
Turnout levels in the Dublin Inner City have tended to be significantly lower than the Dublin and national averages, although significant turnout variations exist within the inner-city areas also. This is illustrated by Table 5, which compares inner-city turnouts with those for the Dublin region and the rest of the country. Inner-city turnouts are shown to be considerably
Turnout or turned off? 13
the inner-city electoral divisions would rank amongst the 10 per cent lowest ranking within
Dublin in terms of turnout levels. The low inner-city turnout levels are partly a reflection of
the concentrating of social deprivation in parts of the inner city, the high levels of population mobility associated with this area, as well as the high proportion of non-nationals amongst
the inner-city electorate. 7.7 per cent of the total registered electorate in the inner city are non
-nationals and the average turnout level for this group in the 2004 local elections was
just 15.7 per cent. The 2004 local elections did, however, represent a highly significant
increase in the actual numbers voting represent to the 1999 contests, with a further
6,081 voting in the area, marking a 38.5 per cent increase in the number of voters.
That said, the number of voters fell relative to the number who voted in the 2002 General Election by 1,466 voters, amounting to a decline of 6.3 per cent in the
numbers voting.
Table S. Turnouts in Dublin Inner City, 1999-2004, as compared with average turnout rates for Dublin and the rest of Ireland
Dublin Inner Ci Dublin Rest of Ireland
Local Elections 2004 39.6-;0 53.0% 60.80/_
Nice Trea Referendum 2002 37.1% 50.2% 47.8%
General Election 2002 45.5% 56.3-/0 65.2%
Abortion Referendum 2002 34.30/0 47.9% 40.8%
Nice Trea Referendum 2001 29.50/0 38.1% 32.80/.
Local Elections 1999 29.6% 36.0% 55.80/.
There are significant turnout variations within the inner city itself. Electoral divisions such
as Merchants Quay D (including "The Tenters" area), Inns Quay A and Arran Quay E have relatively higher turnouts than other areas in the inner city for most elections, while very low turnouts in electoral divisions such as Ronmda B, Ushers B, Ushers A and North City
mark these as having rurnouts lower than the rest of the area and also as representing some of
the lowest turnout rates in the State. At lower levels of aggregation, such turnout differences
within the region are even more enhanced. Marked register analysis of turnout figures allows
for the provision of turnout data at housing estate, street or apartment levels. At this spatial
level, relatively high turnouts for the 2004 local elections were associated with areas such as
Clarence Place (71.8%), Clonliffe Gardens (70.7%), Gloucester Place (70.0%), Donore Road
(67.6%) and St. Thomas's Road (63.6%). On the other hand, very low turnout levels were to
be found in a number of parts of the inner city. Some of these were large institutions, such
as hospitals, hostels or anny barracks, including Clancy Barracks (0.0%), Bm Chaoimhinn, Cork Street (4.2%), Regina Coeli Hostel (4.8%), and Salvation Army. York Street (4.91110).
However, outside of the large institutions, very low turnouts were also to be found in a number
of areas within the inner city, including Custom House Harbour (9.8%), Stewart Hall (11.6%),
Bachelor's Walk Apartments (1 1.9'10), The Hardwick (12.6%), King's Court (14.2%), Buck
-ingham Village (14.3%) and Ha'penny Bridge House (14.9%).
Many of these areas are private 'gated' rented apartments that tend to house young profes-sional workers who are employed in the city centre, although some private apartments would
also tend to have a high number of council tenants on rent allowance. In general, these private
'gated' apartments tend to have low turnout levels, especially for local election contests. The
14 Adrian Kavanagh
tend to be inaccurate, while the people involved tend not to put roots down in the area and don't feel they have a stake in the local community and local political concerns. These very low turnouts in mainly middle-class, galed, private apartmenls, many of which account for significant nwnbers of registered electors, have the effect of significantly pushing down the average turnout of inner cily leading to a perception that the 'indigenous', mainly workin g-class, inner-city population is engaged little with the political and electoral systems. The facts emerging from the marked register analysis negate such ideas. While some Dublin City Council estates may have low turnout levels, such as New Street Gardens (19.2%), many other estates and flats complexes have turnout levels thai equate to the Dublin City average (52.0010), including Crampton Buildings (55.4%), Digges Street Flats (50.9%), Fatima Man-sions (Blocks F to S) (50.4%), Libeny House (50.3%) and Father Scully House (47.2%). In some areas, local election turnouts are actually higher than general election turnouts often involving quite significant differences, as will be discussed below. Relatively high levels of local election turnout reflect relatively high levels of interest in local political affairs amongst the council tenant population, many of whom would be long resident in the area. Higher turnouts in council estates and flats complexes are alsa associated with inlensive mobilisation of these areas by local, left-wing candidates, most notably those from the Sinn Fein party.
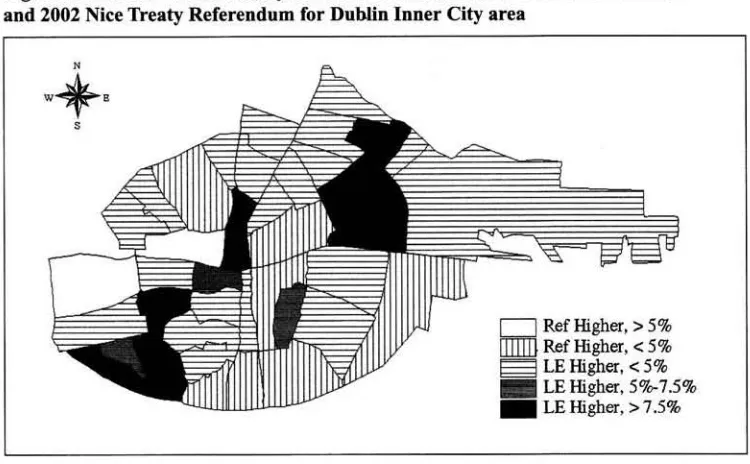
As Table 5 shows, there were significant variations between the average inner-city turnout for different election types, although these variations were nol as pronounced for the rest of Dublin or for the rest of the country. Turnout in the general election, on average, was higher than the turnouts for referenda and local elections, while local and referendum election turn -outs tended to be relatively similar, with differences between turnouts largely depending on the different contexts that these elections were held in. Turnout variations at the electoral level tended to replicate these patterns also. Within the inner city, only one electoral division, Ushers C, recorded a higher turnout for the 2004 local elections (42.3%) than for the 2002 General Election (41.8%), amounting to a somewhat higher local election turnout there. By contrast, general election turnouts were more than 10 per cent higher in the Arran Quay B, Merchants Quay E, St. Kevin's and Mansion House B electoral divisions. Given the relative similarity in the average inner-city turnout for the 2002 Nice Nice Referendwn and the 2004 local elections, variations between turnouts for these two elections at an electoral division level are quite telling. Referendum turnouts tended to be higher in the 'gentrifying' parts of the inncr city, with referendwn turnouts over 5 per cent higher in two electoral divisions, Arran Quay C (8.3% higher) and Ushers A (6.0% higher), thai have experienced considerable levels of private apartment development in recent years. By contrast, local election turnouts were over 7.5 per cent higher in parts of the North East and South West Inner City that, by and large, have not been impacted to the same degree by gentrification to the present date and which remain largely working-class areas. With a similar, though less defined, trend apparent in other parts of the inner city, as illustrated by Figure 6, the general pattern within the area is for relatively higher referendum turnouts to be associated with the more gentrified parts of the inner city and relatively higher local election turnouts to be found in the more traditional, working-class parts.
Turnout or turned off? J 5
Figure 6. 1Ornout differences, by electoral division, between 2004 local elections
and 2002 Nice Treaty Referendum for Dublin Inner City area
"
.
+
,
.
D
Ref Higher, > 5%mrrn
Ref Higher. < 5 %~ LEHigher, <5% _ LEHigher,5%-7.5% _ LE Higher. > 7.5%
turnouts were especially pronounced in the case of some private gated apartments or streets that are characterised by high numbers of residents in the private rental sector. In the South West Inner City, for instance, general election turnouts were 33.6 per cent higher in Ceannt Fort, 23.4 per cent higher in S1. James Wood, 21.0 per cent higher in Old Kilmainham Vil-lage, 18.2 per cent higher for Harrington Street, 14.4 per cent higher in Bertram Court, and 11.9 per cent higher in The Maltings. On the other hand, turnouts in the 2004 local elections were higher than those for the 2002 General Election in some Dublin City flats complexes and estates. For instance, local election turnouts were 13.4 per cent higher in SI. Teresa's Gardens, 12.9 per cent higher in Fatima Mansions and 12.6 per cent higher in Michael Mallin House in the South West Inner City, and 10.3 per cent higher in Alfred Byrne House and 8.4 per cent higher in Liberty House in the North East Inner City.
[image:15.482.52.427.83.315.2]16 Adrian Kavanagh
local elections in The Maltings. and 21.1 per cent of those registered in Old Kilmainham
Village, were not Irish nationals. Given the high numbers on the electoral registers for such
areas - 227 people were registered to vote in The Mailings in 2004, for
example - iI is readily apparent how low turnouts amongst the private 'gated' apartment
sector can push down the average turnout level in inner-city areas to a significant degree.
On the other hand, Figure 7 shows that turnouts in Dublin City fiats complexes of Michael
Mallin House and SI. Teresa's Gardens were relatively high, compared to the rest of Dublin City, for the 1999 local elections, but then fell by over 13 per cent for the 2002 General
Election, before 'rebounding' back to almost to their 1999 levels for the 2004 local elections.
These trends are refiective of two key infiuencing factors on turnout variation, particularly in urban working-class contexls; the imponance of a local candidate contesting an election
and the effect of mobilisation efforts by Sinn Fein and othcr left-wing parties or candidates.
A local Sinn Fein candidate, Ken Fitzgerald of Michael Mallin House, and Martina Kenna,
a member of the Teresa's Gardens residents association, who was a fanner member of Sinn Fein contesting the elections as an independent candidate, contested the 1999 local elections in the South West Inner City. Fitzgerald and Kenna were key to the relatively high turnouts
in their local areas in 1999 in what can be viewed as tantamount to a 'friends and neighbours' effect on turnout levels. The 'friends and neighbours' effect is generally associated with the manner in which an election candidate's suppollievels will tend to be highest in the areas clos
-est to their home base, or bailiwick, within a constituency. This effect is especially significant in Ireland's PR-STV electoral system. Voters can vote for a local candidate, irrespective of
their prospects of winning a seat, safe in the knowledge that such a vote need not be a wasted
one because it may be transferred to their next favoured candidate if that candidate is
elimi-nated during the count. (Such a facility is not offered in first-past-the-post electoral systems,
such as those of the UK and USA.)
Figure 7, Turnout levels in different private apartments and Dublin City Council ftat
complexes, drawn from marked register analyses of the 1999 local elections, 2002 Gen-eral Election and 2004 local elections
....
• 5.0
.0.1
35.0
25.1
11.1 15.1
I
'"
[image:16.484.60.433.434.654.2]Turnout or turned off? 17
Irish-based studies have shown evidence of how this effect has shaped support patterns for
election candidates in rural constituencies, as particularly evidenced in Parker's (1982) classic
study of Galway West, but Johnston (1985) has also found evidence of friends and neighbours style voting in Dublin. It can also be argued that this effect is associated with turnout varia-tion, as turnouts in local and general elections will tend to be higher than expectcd in areas
which have local candidates contesting thosc clcctions. This was very much the case for the St. Teresa's Gardens and Michael Mallin House estates in 1999; just as the Kenna and Fitzgerald
votes respectively peaked in these estates, so too were turnouts in these estates considerably higher than in other inner-city areas. However, no candidate local to the South West Inner
City contested the 2002 General Election and the lack of such a local candidate appears to have demobilised the local electorate. This was particularly the case in a number of Dublin
City Council estates, including Michael Mallin House and St. Teresa's Gardens, where
turn-out declined significantly, as noted above, against the general trend in which general election
turnouts are expected to be higher. The 2004 local elections were, however, contested suc-cessfully by Sinn Fein candidate, Andrew O'Connell from St. Teresa's Gardens, and turnout levels in this estate returned to their 1999 levels due to the rnobili$ation of voters to support
O'Connell as a local candidate. Similarly, turnout in Michael Mallin House increased to a level roughly similar to the 1999 local elections turnout, but the increased 2004 turnout level
was not particularly generated by Sinn Fein in this instance, but instead by support for locally-based Labour councillor, John Gallagher from The Coombe. Finally, a study of turnout levels
in Fatima Mansions shows that these were particularly low for the 1999 local elections. Turn-out in Fatima actually fell to a particularly low 5.3 per cent turnout rate for the Dublin South
Central by-election, which was held four months after the local elections, although the media reported an even lower turnout rate for the area for that election. Turnout levels in this large flats complex have, however, have increased steadily over the past two elections, peaking at a level of 41.9 per cent in the 2004 elections. These turnout increases resulted, in part, from locally based voter education programmes and the politicisation of the local population
aris-ing from their engagement with an urban regeneration project that was focused on the estate.
Greater Clonda/kin
The second of the two case studies areas focused on in this paper is the "Greater Clondalkin" area, which encompasses areas in the outer western suburbs of Dublin City and South Dublin
County, sueh as the BallyfennotlCherry Orchard, Clondalkin and Lucan areas. Figure 8 offers an electoral division-level breakdown of this arca, which was the area where electoral
partici-pation rates fell to their lowest levels in the State for the low turnout 1999 local elections,
with an average turnout of29.3 per cent in this area, slightly lower than the average inner-city turnout for those elections. Especially low turnouts in this area were associated with the North Clondalkin (22.7%) and the Cherry Orchard (\ 7.4%) areas, while turnouts for individual
hous-ing estates within these areas and the South Lucan area fell to even lowcr levels. Especially low turnouts were found in Colthurst (11.1 %), Abbeydale (11.7%), Earlsfort (13.2%) and Foxsborough (16.2%) estates in South Lucan, Kilmahhudrick (12.8%), Greenfort (13.4%),
Woodavens (15.5%) and St. Mark's (16.8%) estates in North Clondalkin, and Clifden Drive
(10.2%), Cherry Orchard Drive (10.9%) and Colepark Avenue (12.5%) in Cherry Orchard! Ballyfermot. A combination of high levels of population mobility, particularly in the new
housing estates in South Lucan, as well as low levels of political mobilisation and high levels
18 Adrian Kavanagh
Figure 8. GrtaCer Clondalkin areas, as divided inlo electoral divisions
"
.
-t
.
_ . . _Woo,0000I_"'"
-.-Over the 1999-2004 period, however, turnout in this area increased considerably relative to the low levels associated with the 1999 elections. with average turnouts of 51.5 per cent for
the 2002 General Election and 49.9 per cent for the 2004 local elections. While the average turnout in 1999 was 0.3 per cent lower than the average turnout in the Dublin Inner City, the
average turnout in 2002 was 6.0 per cent higher than in the inner city and the average turnout
in 2004 was 10.3 per cent higher. Thus, turnout in this area has increased considerably, par-ticularly in relation to the inncr city, which is now very much established as the low turnout area in Dublin and the State. It is worth noting that non-nationals account for a less significant proportion of the registered electorate than in the inner city, accounting for just 1.6 per cent of all those registered in 2004, and the average turnout for this group in the Greater Clondalkin area was, at 30.4 per cent, higher than that for the Dublin Inner City. In some parts of this area the turnout increases between 1999 and 2004 were even more dramatic. Turnout in the
South Lucan area (or the Lucan-Esker electoral division), which experienced considerable
population growth over the 1996-2002 period, increased by 25.1 per cent between the 1999 and 2004 elections. Thcre were also turnout increases of23.5 per cent for North Clondalkin,
TurnOUl or LUrned off! 19
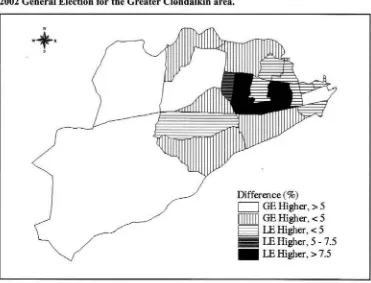
Figure 9. Turnout differences, by electoral division, between 2004 local elections and 2002 General Election for the Greater Clcmdalkin area •
.
+
•
.
Difference (%)
GE Higher
,
>5
GE Higher,
<5
LE Higher
,
<5
LEHigher,S-7.S
LE Higher
.
>7.5
Significant turnout variations at an electoral division level existed within this region, with turn-outs in 2004 lowest in Cherry Orchard A (33.6%), a significantly lower rale than in the high
turnout, and more middle-class, Palmerstown Village (63.2%), Lucan-Heights (59.6%) and Lucan-$t. Helens (58.7%) electoral divisions. Turnouts in 1999 in other working-class
elec-toral divisions, such as Cherry Orchard C (15.0%), Cama (23.0%), Kylemore (20.0%), Decies
(22.9%), Clondalkin-Rowlagh (17.9%) and Clondalkin-Moorefield (23.7%), were roughly
similar to the rate for Cherry Orchard A (18.8%). However, participation levels in 2004 were somewhat higher in these electoral divisions, with turnouts of 42.4 per cent in Cherry Orchard C, 51.5 per cenl in Carna, 44.1 per cenl in Kylemore, 47.2 per cent in Decies, 44.1 per cent
in Clondalkin-Rowlagh and 48.7 per cent in Clondalkin-Moorefield. Furthermore, these
turn-outs were higher than the general election turnouts in these mainly working-class electoral divisions, with local election turnouts higher by 4.7 per cent in Cherry Orchard A, 9.7 per cent
in Cherry Orchard C, 10.5 per cenl in Cama, 0.2 per cent in Kylemore, 2.2 per cent in Decies, 6.4 per cent in Clondalkin-Rowlagh and 8.7 per cent in C1ondalkin-Mooreficld. Such a pattern is unusual, given that the common wisdom in political science holds that turnout in first-order elections (general elections) will always be higher than in second-order elections (referenda,
local elections, by-elections, and European elections). However, the 'turnout twist' concept of
Horiuchi (2005) points to evidence of higher turnout in sub-national elections in some cases, and it is worth noting also that higher local election turnouts were also observed for some
[image:19.482.58.429.89.372.2]Lei-20 Adrian Kavanagh
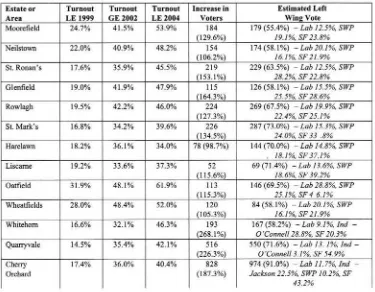
Table 6. Turnout levels, 1999-2004, and support levels for left wing/community parties
and candidates in 2004 local elections with.in North Clondalkin/Cherry Orchard area
41.5%
Glenfield 19.0% 41.9"10 47.9%
Rowlagh 19.5'!Io 42.20/. 46.0%
l.iscame
48.1% 61.9%
Orchard
II
(187.30/0)
179 Lob 12.5%. SWP SF 23.8%
,SWP
84 u.b 20. I%. SWP
. SF 21.9%
974 (91.0"10) 7%.
JOCQon 22.5%. SWP 102%. SF
43.1%
trim (Kavanagh, 2005). By contrast, general election rurnouts in more middle-class electoral
divisions in the Greater Clondalkin area tended to be higher, encompassing the Newcastle, Lucan and Palmerston areas, as Figure 9 shows.
Election-specific turnout variations al the electoral division level are even more dramatic
when expressed in terms of the percentage change in the raw number of voters turning out
to vote in different elections. The number of exira voters between 1999 and 2004 within the area increased by almost 20,000, almost amounting to a doubling of the numbers voting in
the local elections (approximating to a 93.0% increase in the numbers ofvolcrs). There was also an increase of over 1,500 in the numbers voting between the 2002 General Election and the 2004 local elections, obviously reflecting an increase in the size of the electorate given the slight decrease in the average turnout rate between these elections. These increases were particularly pronounced in certain parts of the areas. The number of vOlers in North Clondalkin, for instance, increased by over 3,500 between 1999 and 2004 (amounting 10 a
percentage increase of 123.7% in the numbers voting) and by almost 1,000 between 2002 and 2004 (16.9% increase). In Cherry Orchard, the number of voters increased by 828 between 1999 and 2004 (increase of 187.3% in numbers voting) and by 370 between 2002 and 2004
[image:20.482.53.428.100.392.2]Turnout or lUrned off? 21
an increase of 13,356. or 179.3 per cent, between 1996 and 2002. But in other areas the increase in the number of voters cannot be vtcwed as arising simply from an increase in popu· lation levels, particularly in the North Clondalkin electoral divisions of Clondalkin -Moore-field and Clondakin-Rowlagh. The number of voters increased over the 1999-2004 by 1,127 in Clondalkin Moorefield (112.1% increase) and 863 in Clondalkin·Rowlagh (\44.6%), yet these considerable increases occurred in electoral divisions that. based on the 2002 Census figures, experienced a decline in their populations over a similar time period, with popula. tion falling by 451 (decline of 6.7%) in Clondalkin Moorefield and 734 (decline of 14.(010)
in Clondalkin-Rowlagh. Thus other factors were responsible for the increased mobilisation of voters in North Clondalkin, as well as in parts ofBallyfermot and Cheny Orchard, which also
experienced population decline over this period.
A deeper understanding of the panems of, and the factors shaping, turnout variation and dif
-ferences between turnouts for different election types can be attained by applying Agnew's
microscopic place-based focus to this study. This, as with the inncHity study, is enabled by
an analysis of marked rcgister turnout figures for the 1999 local elections, 2002 General Elec -tion and 2004 local elections. These figures for 1999 showed some very low turnout levels
for some estates in South Lucan, Cheny Orchard. Ballyfermot and North Clondalkin, as noted above. although turnouts for some estates in more settled parts of Palmerstown, Lucan and Clondalkin were substantially higher, including the Lucan Heights (54.4%), Beechpark (52.8%) and Beech Grove (49.6%) estates in Lucan Village, and the Newlands (57.0010) and Floraville (51.9%) estates in Clondalkin Village. Newlands Park (76.1%) and Newlands Road (72.0%) in Clondalkin, and Ardeevin Avenue (74.2%), Hillcrest Lawns (73.2%), Kew Park (71.4%) and Esker Lawns (71.4%) in Lucan recorded even higher turnouts for the general eleclion. However, turnout levels still remained low in North Clondalkin estates, such as Harelawn Drive (14.1%), Harelawn Park (20.9%), SI. Ronan's Drive (25.0%) and Whitehorn Park (27.8%), as well as Croftwood Grove (21.3%) and Cherry Orchard Crescent (24.6%) in the Cherry Orchard area.
As Table 6 shows, however, turnouts for the 2004 local, European and Citizenship Refere n-dum elections increased significantly in a number of estates in the North Clondalkin and
Cheny Orchard areas, relatively to the turnout levels for those estates in the 1999 local elec-tions, and also relative to turnout levels in the 2002 General Election. In most cases, the turn-out rate for these estates more than doubled relative to the 1999 levels, with a significant increase relative to the levels for the 2002 General Election also. The increased turnout pro-pensity associated with these estates appears even more dramatic when one considers the percentage change in the raw number of voters over this period, with the numbers voting in these estates more than doubling in most instances and actually trebling in the cases of the Whitehorn and Quanyvale areas. Heightened voter mobilisation by political parties and
candidates, especially those of a left-wing slant, in the North Clondalkin and Cherry Orchard
areas, centred about contentious local issues, appears to have been particularly important in
increasing the turnouts in these areas. The increased turnout in North Clondalkin, and the rest
of the Clondalkin electoral area, for instance, resulted in Labour winning 1.916 more voles, Sinn Fein winning 1,799 more votes and the Socialist Workers' Party winning 1,014 more votes, amounting to left wing candidates winning an extra 22.3 per cent share of the vote in that constituency. The vote share won by left wing parties and candidates in most of these
22 Adrian Kavanagh
between higher turnout and increased Sinn Fein mobilisation in previous studies (Kavanagh, 2002b). However, as Table 4 shows, other parties, such as Labour and the Socialist Workers'
Party, and candidates also made a significant electoral impact in these areas. The number of votes by Sinn Fein in the Rowlagh NS polling district, including the Glenfield, Rowlagh, St. Mark's, Wheatfields and Oatfield estates, increased by 308 (190.1% increase) between 1999 and 2004, whilc the number of votes won by Labour increased by 264 (694.7% increase) between the two elections. Moreover, the Socialist Workers' Party, who had not contested the Clondalkin ward in 1999, won 333 votes in this district, more than offsetting the fact that
the Workers' Party, which won 119 votes in this area in 1999, was not contesting Clondalkin in 2004. In 1999 the area had been lightly canvassed, predominantly by Liam Lawlor, the Workers' Party and a less organised Sinn Fein campaign, with the low levels of mobilisation being particularly evident in the light postering of these areas. In 2004, by contrast, North Clondalkin was the focus of the campaigns of Shane O'Connor of Sinn Fein, Gino Kenny of
the Socialist Workers' Party, Marie Grogan of Labour, as well as Trevor Gilligan and O'Neil of Fianna Fail. These increased levels of canvassing were particularly focused on mobilising voters around anti-government sentiment, as well as a number of contentious local issues, such as the bin charges dispute, proposed apartmenl deveiopmenls in the village around the Round Tower, housing needs, as well as transport needs and traffic congestion.
Conclusion
Agnew envisages political behaviour as being particularly centred on three dimensions of place; those of locale, location and sense of place. This multidimensional concept of place offers a particularly potent framework for analysing the factors that shape turnout propensity, as well as the causes of the increased turnout levels in the 2004 local election in the Dublin
region. Sense of place highlights the importance of differential levels of residential mobility and stability in shaping turnout propensity, as especially evident in the concentration of low turnout in the inner-city area in Dublin in recent elections. The high levels of mobility associ-ated with this area are pushing down the average turnout in this area relative to other tradi-tional working-class areas such as Ballyfermot, Cherry Orchard and North Clondalkin, with
the lowest turnouts associated with new, often middle-class, private 'gated' apartments. Apart-ment dwellers do not feel that they have a stake in the inner-city areas where they are living.
Hence they are not mobilised to vote on the basis of local political issues, nor will they be
policy-Turnout or turned off? 23
making at govemmenlal or European Union levels, or the result of macro-level economic
restructuring and changes in social divisiol\s of labour. The structuralionist approaches of geographers such as Agnew (1987, 1996) and Massey (1984) have highlighted the factlhat places react to these macro-level influences in different ways, but also at different times. The response of socially-deprived areas in Dublin, such as those discussed in this paper, to
govern-ment indifference in the past has been largely expressed in tenns of electoral abstentionism. However the recent local election saw this response shift to one of increased political
partici-pation, often on an anti-governmental basis.
The multidimensional and microscopic analytical Agnewian framework, drawing on the rich data set gleaned from marked register analyses of turnout levels, offers an apt portrayal of electoral behaviour in Dublin at the start of the 21st Century, particularly in relation to
elec-toral participation levels. The general trend emerging from this analysis is one that suggests
that socia-structural factors help account for a considerable proportion of turnout variance
within the Dublin region, particularly those relating to demograph)', social well-being,
popula-tion mobility and housing tenure. In general, turnout is expected to be higher in the more a fflu-ent and mature, or settled, parts of the Dublin region, with turnout lower in areas with higher
concentrations of younger, more mobile and more deprived popUlations. However, as nOled
above, turnout behaviour is a more complex phenomenon than is suggested by correlation and regression analysis. There are different local responses to national and global trends. In addition, local issues, personalities and related mobilisation strategies, produce a highly dif -ferentiated and complex geography of turnout and turnout change within the Dublin region.
The turnout propensity of different places in Dublin may be a function of differential access to
differenl resources, whether these are based on financial, infonnation or community ties. The inner-city and western suburban cases studies have, however, shown that a targeted mo bilis-ing of the electorate, either on partisan or non-partisan bases, linked to contentious. often
locally focused, issues can combine to produce higher than expected turnouts in some
under-resourced communities, while levels remain low in others. This was notably the case in the 2004 local elections, where turnouts increased by considerable levels in the Cherry Orchard,
Ballyfennot and North Clondalkin areas. But the turnout increases were less pronounced in the inner city, which has, as a result, emerged as the low turnout area within the Dublin region,
or indeed within the state as a whole. The question remains, however, whether these turnout increases can be sustained within traditionally long-tenn low turnout areas, such as Ballyfc r-mot and Clondalkin, or whether turnouts in these areas will fall again if the electorates in these areas do not see any benefits arising from their increased engagement with the electoral
system.
References
Agnew, J. A. (1987) Place and politics: The geographical mediation of state and society,
Allen & Unwin, Boston.
Agnew, J. A. (1996) 'Mapping politics: how context counts in electoral geography'. Political
24 Adrian Kavanagh
Donnelly, S. (1999) Elections '99 - All kinds of everything, Brunswick Press, Dublin.
Horiuchi, Yusaku. (2005) Institutions, Incentives and Electoral Participation in Japan: Cross·
level and cross·national perspectives, Routledge Curzon, London.
Johnson, N. (1985) Some aspects of the 1981 General Election in Dublin: a geographical analysis. unpublished MA Thesis, University College Dublin.
Kavanagh, A. P. (2002a) Unequal Participation, Unequal Influence: Voter participation and
voter education in Dublin's South West Inner City. South West Inner City Network, Dublin.
Kavanagh, A. P. (2oo2b) Social Deprivation. Political Alienarion and Community Empower· ment: The Geography of voter turnout in Ireland, 1997-2002. and its association with social deprivation. unpublished PhD Thesis, NUl Maynooth.
Kavanagh, A. P. (2004) 'The 2004 local elections in the Republic of Ireland', Irish Political
Studies. 19 (2), 64·84.
Kavanagh, A. P., Mills, G. and Sinnott, R. (2004) 'The geography of Irish voter turnout: A case study of the 2002 General Election', Irish Geography. 37 (2), 177-186.
Kavanagh, A. P. (200S) 'Bin-chargc disputes, personality politics, Sinn Fein and increased
local election turnout: A spatial analysis of the increased electoral participation in the 2004
local elections in the Republic of Ireland', paper presented at 2005 Political Studies
Associa-tion Conference, University of Leeds, 6th April.
Lijphart, Arend (1997) 'Unequal participation: democracy's unresolved dilemma', American Political Science Review, 91(1), 1-14.
Lyons, P. and Sinnott, R. (2003) 'Voter turnout in 2002 and beyond' in Gallagher, M.,
Marsh, M. and Mitchell, P. (eds), How Ireland Voted 2002. Palgrave Macmillan, Basingstoke,
14J-58.
Marsh, M., Sinnott, R., Garry, J. and Kennedy, F. (2001) 'The Irish Election Study: Puzzles and priorities', Irish Political Studies, 16, 161-178.
Massey, D. (1984) Spatial Divisions of Labour: Social Structures and the Geography of Pro·
duction, Macmillan, London.
Parker, A. J. (1982) 'The "friends and neighbours" effect in thc Galway West constituency'. Political Geography Quarterly, 1(3),243-63.
Sinnott, R. (1995) Irish voters decide: Voting behaviour in elections and referendums since
1918. Manchester University Press, Manchester and New York.