Accepted Manuscript
Title: Validated TRNSYS model for forced circulation solar water heating systems with flat plate and heat pipe evacuated tube collectors
Authors: L.M. Ayompe, A. Duffy, S.J. McCormack, M. Conlon
PII: S1359-4311(11)00071-8
DOI: 10.1016/j.applthermaleng.2011.01.046 Reference: ATE 3411
To appear in: Applied Thermal Engineering
Received Date: 19 October 2010 Revised Date: 16 December 2010 Accepted Date: 29 January 2011
Please cite this article as: L.M. Ayompe, A. Duffy, S.J. McCormack, M. Conlon. Validated TRNSYS model for forced circulation solar water heating systems with flat plate and heat pipe evacuated tube collectors, Applied Thermal Engineering (2011), doi: 10.1016/j.applthermaleng.2011.01.046
M
AN
US
CR
IP
T
AC
CE
PT
ED
1
Validated TRNSYS model for forced circulation solar water heating systems with flat plate and heat pipe evacuated tube collectors
L.M. Ayompe#*, A. Duffy#*, S.J. McCormack+ and M. Conlon%*
#
Department of Civil and Structural Engineering, School of Civil and Building Services, Dublin Institute of Technology, Bolton Street, Dublin 1.
+Department of Civil, Structural and Environmental Engineering, Trinity College Dublin, Dublin 2.
%School of Electrical Engineering Systems, Dublin Institute of Technology, Kevin St, Dublin 8.
*Dublin Energy Lab, FOCAS Institute, Dublin Institute of Technology, Dublin 8.
Abstract
This paper presents a validated TRNSYS model for forced circulation solar water heating systems used in temperate climates. The systems consist of two flat plate collectors (FPC) and a heat pipe evacuated tube collector (ETC) as well as identical auxiliary components. The systems were fitted with an automated unit that controlled the immersion heaters and hot water demand profile to mimic hot water usage in a typical European domestic dwelling. The main component of the TRNSYS model was the Type 73 FPC or Type 538 ETC. A comparison of modelled and measured data resulted in percentage mean absolute errors for collector outlet temperature, heat collected by the collectors and heat delivered to the load of 16.9%, 14.1% and 6.9% for the FPC system and 18.4%, 16.8% and 7.6% for the ETC system respectively. The model underestimated the collector outlet fluid temperature by -9.6% and overestimated the heat collected and heat delivered to load by 7.6% and 6.9% for the FPC system. The model overestimated all three parameters by 13.7%, 12.4% and 7.6% for the ETC system.
Keywords: Solar water heater, flat plate collector, evacuated tube collector, TRNSYS.
1. Introduction
M
AN
US
CR
IP
T
AC
CE
PT
ED
2
generally heated by burning non-commercial fuels, namely, firewood as in the rural areas and commercial fuels such as kerosene oil, liquid petroleum gas (LPG), coal and electricity (either by geysers or immersion heaters) in urban areas [2]. In this regard, utilization of solar energy through solar water heating (SWH) systems plays a big role in the quantity of conventional energy required [3]. Solar water heaters therefore have significant potential to reduce environmental pollution arising from the use of fossil fuels [4].
Solar water heaters are the most popular means of solar energy utilization because of technological feasibility and economic attraction compared with other kinds of solar energy utilization. Solar water heater technology has been well developed and can be easily implemented at low cost [5].
Almost all solar water heating systems used in temperate climates are active systems that make use of pumps to circulate the heat transfer fluid. These systems commonly use flat plate or evacuated tube collectors, which absorb both diffuse and direct solar radiation and function even under clouded skies. Water is heated in the collectors and a pump is used to circulate a water glycol mixture used as the heat transfer fluid. A solar controller triggers the pump when the difference between the temperature of water at the bottom of the tank and the heat transfer fluid at the outlet from the collector exceeds a set value. A solar coil at the bottom of the hot water tank is used to heat water. This fluid has some desirable properties such as low freezing and high boiling points. Their ease of operation and low cost makes them suitable for low temperature applications below 80oC. An auxiliary heating system is used to raise the water temperature during periods when there is less heat available from the solar collector.
M
AN
US
CR
IP
T
AC
CE
PT
ED
3
weather in both summer and winter. One day it may be raining, the next it may be sunny. These climates are located in zones in the range of latitudes between 40 and 60/70o north.
Solar water heating collectors have been studied both experimentally and theoretically by a number of researchers. Azad [6] investigated the thermal behaviour of a gravity assisted heat pipe solar collector experimentally and theoretically using the effectiveness-NTU method. Hussein [7] developed and validated a simulation model for a wickless heat pipe flat plate solar collector with a cross flow heat exchanger. Riffat et al. [8] constructed a thin membrane flat plate heat pipe solar collector and developed an analytical model that was used to simulate heat transfer processes occurring in the collector and calculate its efficiency. Bong et al. [9] presented a validated theoretical model to determine the efficiency, heat removal factor, and outlet water temperature of a single collector and an array of flat plate heat pipe collectors. Ezekwe [10] analysed the thermal behaviour of solar energy systems using heat pipe absorbers and compared them with systems using conventional solar collectors. Bojić et al. [11] modelled and simulated the performance of a forced circulation
solar water heating system using a time marching model.
Most of the studies carried out on solar water heating systems have been focused on solar collectors rather than the complete systems with very few studies reported in literature. However, several researchers have carried out studies on hybrid PV-thermal systems as reported in Kalogirou [12]. He modelled and simulated the performance of a hybrid PV-thermal solar system using TRNSYS and typical meteorological year (TMY) conditions for Nicosia, Cyprus.
M
AN
US
CR
IP
T
AC
CE
PT
ED
4
conditions. The model could also be used for system optimisation under different load profiles.
2. System description
Typical solar water heating systems used in temperate climates consist of a hot water storage tank, control unit, pump station and either flat plate, evacuated tube or concentrating parabolic collectors. The collectors used in this study were installed on a flat roof of the Focas Institute building, Dublin Institute of Technology, Dublin, Ireland. They were south facing and inclined at 53o equal to the local latitude of the location. The hot water cylinders were installed nearby in the building’s plant room. The solar circuits consisted of 12 mm diameter copper pipes insulated with 22 mm thick Class O Armaflex. All pipe fittings were also insulated to reduce heat losses. The solar circuit pipe lengths for the heat pipe evacuated tube collector supply and return were 14 m and 15.4 m respectively, while they were 14 m and 15.6 m respectively for the flat plate collector system. Figs. 1 and 2 show pictures of the evacuated tube and flat plate collectors as well as the in-door installations of the experimental rig.
M
AN
US
CR
IP
T
AC
CE
PT
ED
5
with a small amount of working fluid. The heat is transferred as latent heat energy by evaporating the working fluid in a heating zone and condensing the vapour in a cooling zone, the circulation is completed by return flow of the condensate to the heating zone through the capillary structure which lines the inner wall of the container [14, 15].
The FPC system consisted of two K420-EM2L flat plate collectors each with a gross area of 2.18 m2 and aperture area of 2 m2 connected in series giving a total area of 4 m2. Each collector had maximum operating and stagnation temperatures of 120 oC and 191 oC respectively, a maximum operating pressure of 10 bar and fluid content of 1.73 litres.
Each system was equipped with a 300 litre stainless steel hot water cylinder (model HM 300L D/coil U44332). The cylinder height and diameter were 1,680 mm and 580 mm respectively, with an operating pressure of 3 bar. Each cylinder was fitted with two immersion heaters of 2.75/3.0 kW capacity located at the bottom and middle of the tank. The cylinders each had two heating coils with surface areas of 1.4 m2 and 21 kW rating. The bottom coil was used by the solar heating circuit while the top coil was reserved for use with auxiliary heating systems such as boilers.
A programmable logic controller (PLC) turned on the immersion heaters between 5-8 am and 6-9 pm daily just before the two peak hot water draw-offs. Analogue thermostats placed at the top of the hot water cylinders were set to turn-off the electricity supply to the immersion heaters when the temperature of water at the top of the tank exceeded 60oC. Fig. 4 shows a schematic diagram of the solar water heating systems.
M
AN
US
CR
IP
T
AC
CE
PT
ED
6
number 3, featuring 24 draw-offs with the energy output of 11.7 kWh equivalent to a total volume of 200 litres at 60 oC daily. It is based on the European Union mandate for the elaboration and adoption of measurement standards for household appliances EU M324EN [16]. Fig. 5 shows the recommended volume of hot water to be extracted at different times of the day.
3. Modelling
3.1 TRNSYS model
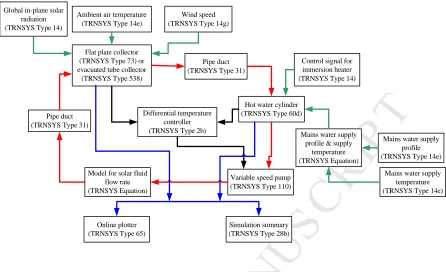
The solar water heating system model was developed using transient systems simulation (TRNSYS) software, which is a quasi-steady state simulation program. TRNSYS enables system components represented as proformas to be selected and interconnected in any desired manner to construct a system’s model. In order to facilitate the selection of the system components, it is important to develop an information flow diagram. The information flow diagram for the models is shown in Fig. 6.
M
AN
US
CR
IP
T
AC
CE
PT
ED
7
3.2 Weather data
Weather for three days notably clear sky in summer (02/06/2009), intermittent cloud cover in autumn (25/11/2009) and heavily overcast in winter (20/01/2010) were chosen to represent different weather conditions prevalent in Ireland. These data were used as inputs of the TRNSYS model. Fig. 7 shows plots of mean hourly values of solar radiation, ambient air temperature and wind speed. The maximum hourly values of in-plane solar radiation were 3,234 kJm-2, 1,463 kJm-2 and 745 kJm-2 during the three days. The maximum hourly ambient air temperatures were 25.0 oC, 9.9 oC and 8.0 oC while the maximum wind speeds were 3.1 ms-1, 14.6 ms-1 and 8.7 ms-1 respectively.
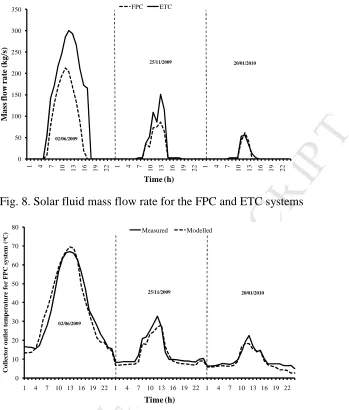
3.3 Mass flow rate
Fig. 5 shows plots of the measured solar fluid mass flow rate for the FPC and ETC systems. It is seen that the solar fluid mass flow rate was 212.4 kghr-1, 85.8 kghr-1 and 61.5 kghr-1 for the FPC system and 300.2 kghr-1, 151.5 kghr-1 and 54.9 kghr-1 for the ETC system during the clear sky, intermittent cloud covered and heavily overcast days respectively. For both systems the solar fluid mass flow rate shows clear dependence on the level of solar radiation.
The variable speed pump (TRNSYS Type 110) operates on an on/off sequence running at the maximum rate flow rates of 212 kghr-1and 330 kghr-1for the FPC and ETC systems respectively when on. This does not take into account the variable nature of the solar fluid mass flow rates shown in Fig. 8. The solar fluid mass flow rate was therefore modelled to reflect real-time operation of the actual pump. The fluid mass flow rate was seen to vary linearly with in-plane solar radiation and was modelled following the expression shown in Eq. 1.
b aG
M
AN
US
CR
IP
T
AC
CE
PT
ED
8
where, a and b are empirical coefficients with values of 0.0623 and -2.1394 for the FPC system and 0.0976 and 2.059 for the ETC system determined using measured data. The correlation coefficients (R2) for the FPC and ETC systems were 0.97 and 0.93 respectively. The solar fluid mass flow rate model in Eq. 1 was incorporated into the TRNSYS model using the equation proforma.
3.4 Heat collected
The useful energy collected by the solar energy collector is given as [17]:
coll f pf 1 6
Q =m C (T& −T )
(2)
3.5 Heat delivered
The heat delivered by the solar water heating system to the load was calculated as
load w pw 8,avg
Q =m C T&
(3)
3.6 Hot water demand
Since the hot water tanks used in this study are pressurised, the hot water demand profile shown in Fig. 5 was modelled using two TRNSYS Type 14e forcing functions each representing the mains water supply profile and temperature respectively. The outputs from the forcing functions were then combined using a TRNSYS equation proforma that had as output the mains water supply profile and temperature.
3.7 Model validation
M
AN
US
CR
IP
T
AC
CE
PT
ED
9
underestimation while a positive value indicates a net overestimation of the modelled values. PMAE and PME are given in Eqs. 4 and 5 as:
∑
=
−
= N
1
i i
i i
M M C N 100
PMAE (4) and
∑
=
−
= N
1
i i
i i
M M C N 100
PME (5) N is the total number of observations while Ci and Mi are the ith calculated and
measured values, respectively.
4. Results and Discussions
Table 4 presents percentage mean absolute errors (PMAE) and percentage mean error (PME) for collector outlet temperature (Tco), heat collected by the collector (Qcoll) and heat
delivered to the load (Qload) for both the FPC and ETC systems. The results show that the
model performed slightly better in all six cases for the FPC system. It however, predicted Qload for the FPC system with the least PMAE of 6.9% while it predicted Tco for the ETC
system with the highest PMAE of 18.4%. The negative value of PME for the FPC indicates an underestimation of Tco by the model.
Much of the discrepancies between the simulated and experimental results can be attributed to experimental errors which are a function of the accuracy of the measurement devices used. Also, the existing TRNSYS proformas for evacuated tube collectors might not be fully representative of heat pipes. Detailed plots of the results are presented in sections 4.1 to 4.3.
4.1 Collector outlet temperature
Fig. 9 shows plots of measured and modelled collector outlet temperature (Tco) for the
M
AN
US
CR
IP
T
AC
CE
PT
ED
10
The model however overestimated Tco during the bright sunny day (02/06/2009) while it
underestimated same during the other two days. Fig. 10 shows plots of measured and modelled values of Tco for the ETC system. Again it is seen that the modelled values follow
the same trend as the measured values. The model however, overestimated Tco during all
three days.
4.2 Heat collected
Fig. 11 shows plots of measured and modelled heat collected (Qcoll) by the FPC. It is
seen that the modelled values follow the same pattern as the measured values. The model slightly overestimated Qcoll on the bright sunny day (02/06/2009) and underestimated Qcoll
during the other two days. Fig. 12 shows plots of measured and modelled heat collected (Qcoll) by the ETC. It is seen that the modelled values follow the same pattern as the measured
values. The model slightly underestimated Qcoll on the bright sunny day (02/06/2009) and
overestimated Qcoll during the other two days.
The high discrepancy between the modelled and measured Qcoll for the ETC system
was as a result of the nature of operation of the heat pipe evacuated collector which has two different circuits. The evaporation and condensation cycle of the primary heat transfer fluid in the primary circuit as well as heat removal through the secondary circuit causes the pump to intermittently switch on and off in quick succession. This sometimes results in energy loss from the hot water tank thereby reducing the net energy collected.
4.3 Heat delivered to load
M
AN
US
CR
IP
T
AC
CE
PT
ED
11
Conclusions
A TRNSYS model was developed for forced circulation solar water heating systems with flat plate and heat pipe evacuated tube collectors. The model was validated using field trial data for systems installed in Dublin, Ireland. Results obtained showed that the model predicted the collector outlet fluid temperature with percentage mean absolute error (PMAE) of 16.9% and 18.4% for the FPC and ETC systems respectively. Heat collected and delivered to the load was also predicted with PMAE of 14.1% and 6.9% for the FPC system and 16.9% and 7.6% for the ETC system respectively. The model underestimated the collector outlet fluid temperature by -9.6% and overestimated the heat collected and heat delivered to load by 7.6% and 6.9% for the FPC system. The model overestimated all three parameters by 13.7%, 12.4% and 7.6% for the ETC system.
The validated TRNSYS model can be used to:
• Predict long-term performance of the solar water heating systems in different locations
• Simulate system performances under different weather and operating conditions
• Optimise solar water heating system sizes to match different load profiles.
Nomenclature
Cpf specific heat capacity of solar fluid (kJkg-1K-1)
Cpw specific heat capacity of water (kJkg-1K-1)
ETC evacuated tube collector FPC flat plate collector
Gt in-plane solar radiation (kJm-2) f
m& solar fluid mass flow rate (kghr-1)
w
m& water mass flow rate (kghr-1)
M
AN
US
CR
IP
T
AC
CE
PT
ED
12 Qcoll heat collected by solar collector (kJ)
Qload heat delivered to load (kJ)
T1 solar fluid temperature at collector outlet (K)
T6 solar fluid temperature at collector inlet (K)
T8,avg average hot water temperature delivered to load (K)
TRNSYS transient systems simulation SWH solar water heating
References
1. International Energy Agency, Energy use in the new millenium: Trends in IEA countries, 2007 <http://www.iea.org/textbase/nppdf/free/2007/millennium.pdf>. 2. D.W. Lee, A. Sharma, Thermal performances of the active and passive water heating
systems based on annual operation, Solar Energy 81(2) (2007) 207-215.
3. H. Gunerhan, A. Hepbasli, Exergetic modeling and performance evaluation of solar water heating systems for building applications, Energy and Buildings, 39(5) (2007) 509-516.
4. S.A. Kalogirou, Environmental benefits of domestic solar energy systems, Energy Conversion and Management 45(18-19) (2004) 3075-3092.
5. W. Xiaowu, H. Ben, Exergy analysis of domestic-scale solar water heaters, Renewable and Sustainable Energy Reviews 9(6) (2005) 638-645.
6. E. Azad, Theoretical and experimental investigation of heat pipe solar collector, Experimental Thermal and Fluid Science 32(8) (2008) 1666-1672.
7. H.M.S. Hussein, Theoretical and experimental investigation of wickless heat pipes flat plate solar collector with cross flow heat exchanger, Energy Conversion and Management 48(4) (2007) 1266-1272.
8. S.B. Riffat, X. Zhao, P.S. Doherty, Developing a theoretical model to investigate thermal performance of a thin membrane heat-pipe solar collector, Applied Thermal Engineering, 25(5-6) (2005) 899-915.
9. T.Y. Bong, K.C. Ng, H. Bao, Thermal performance of a flat-plate heat-pipe collector array, Solar Energy, 50(6) (1993) 491-498.
10. C.I. Ezekwe, Thermal performance of heat pipe solar energy systems. Solar & Wind Technology 7(4) (1990) 349-354.
11. M. Bojić, S. Kalogirou, K. Petronijević, Simulation of a solar domestic water heating
system using a time marching model, Renewable Energy, 27(3) (2002) 441-452. 12. S.A. Kalogirou, Use of TRNSYS for modelling and simulation of a hybrid
PV-thermal solar system for Cyprus, Renewable Energy, 23(2) (2001) 247-260.
13. S.A. Kalogirou, Solar thermal collectors and applications, Progress in Energy and Combustion Science, 30(3) (2004) 231-295.
14. P.D. Dunn, D.A. Reay, Heat pipe, third ed., Pergamon Press, New York, 1982. 15. A. Faghri, Heat pipe science, Taylor & Francis, London, 1995.
16. European Commission, Mandate to CEN and CENELEC for the elaboration and adoption of measurement standards for household appliances: water heaters, hot water storage appliances and water heating systems, Brussels, 2002.
M
AN
US
CR
IP
T
AC
CE
PT
ED
13
List of figures
Fig. 1. Evacuated tube and flat plate collectors Fig. 2. In-door installation of the experimental rig
Fig. 3. Schematic diagram of a heat pipe evacuated tube collector Fig. 4. Schematic diagram of the solar water heating systems Fig. 5. Volume of hot water draw-off at different times of the day
Fig. 6. TRNSYS information flow diagram for the forced circulation solar water heating systems
Fig. 7. Solar radiation, wind speed and ambient air temperature Fig. 8. Solar fluid mass flow rate for the FPC and ETC systems
Fig. 9. Measured and modelled collector outlet temperature for FPC system Fig. 10. Measured and modelled collector outlet temperature for ETC system Fig. 11: Measured and predicted heat collected by the FPC system
Fig. 12. Measured and modelled heat collected by the ETC system Fig. 13. Measured and modelled heat delivered to load by FPC system Fig. 14. Measured and modelled heat delivered to load by ETC system
List of tables
Table 1 Hot water cylinder parameters Table 2 Solar collector parameters Table 3 Pump parameters
Table 4 PMEA and PME for collector outlet temperature (Tco), heat collected by the
M
AN
US
CR
IP
T
AC
CE
PT
ED
14
Fig. 1. Evacuated tube and flat plate collectors
[image:15.595.140.496.77.680.2]Fig. 2. In-door installation of the experimental rig
M
AN
US
CR
IP
T
AC
CE
PT
ED
15Fig. 4. Schematic diagram of the solar water heating systems
Fig. 5. Volume of hot water draw-off at different times of the day
Pum p
Hot water out to demand Hot water tank Immersion heater Solar coil Solar controller Solar fluid Cold water in Pulse flow meter Pulse flow meter T6 T1 T2 T3 T8 T7 T4 T5 Hot water demand & auxiliary heating control system Thermostat Pulse flow meter Solenoid valve 2 24 2 2 62
2 2 2 2 2 2 2
6
2 2 2 2 2 2 2
M
AN
US
CR
IP
T
AC
CE
PT
ED
16 [image:17.595.87.533.85.357.2]Fig. 6. TRNSYS information flow diagram for the forced circulation solar water heating systems
Fig. 7. Solar radiation, wind speed and ambient air temperature
Global in-plane solar radiation (TRNSYS Type 14)
Ambient air temperature (TRNSYS Type 14e)
Flat plate collector (TRNSYS Type 73) or evacuated tube collector
(TRNSYS Type 538)
Pipe duct (TRNSYS Type 31)
Pipe duct (TRNSYS Type 31)
Differential temperature controller (TRNSYS Type 2b)
Variable speed pump (TRNSYS Type 110) Model for solar fluid
flow rate (TRNSYS Equation)
Hot water cylinder (TRNSYS Type 60d)
Mains water supply temperature (TRNSYS Type 14e) Control signal for
immersion heater (TRNSYS Type 14)
Mains water supply profile (TRNSYS Type 14e) Mains water supply
profile & supply temperature (TRNSYS Equation)
Online plotter (TRNSYS Type 65)
Simulation summary (TRNSYS Type 28b) Wind speed
(TRNSYS Type 14g)
0 500 1,000 1,500 2,000 2,500 3,000 3,500 0 5 10 15 20 25 30
1 4 7 10 13 16 19 22 1 4 7 10 13 16 19 22 1 4 7 10 13 16 19 22
S o la r ra d ia ti o n ( k J m -2) A m b ie n t te m p er a tu re ( oC ) a n d w in d s p ee d ( m s -1) Time (h)
Wind speed Ambient air temperature Solar radiation
02/06/2009
[image:17.595.80.536.93.611.2]M
AN
US
CR
IP
T
AC
CE
PT
ED
17Fig. 8. Solar fluid mass flow rate for the FPC and ETC systems
[image:18.595.146.495.64.474.2]Fig. 9. Measured and modelled collector outlet temperature for FPC system
Fig. 10. Measured and modelled collector outlet temperature for ETC system
0 50 100 150 200 250 300 350
1 4 7
1 0 1 3 1 6 1 9 2
2 1 4 7
1 0 1 3 1 6 1 9 2
2 1 4 7
1 0 1 3 1 6 1 9 2 2 M a ss f lo w r a te ( k g /s ) Time (h) FPC ETC 02/06/2009 25/11/2009 20/01/2010 0 10 20 30 40 50 60 70 80
1 4 7 10 13 16 19 22 1 4 7 10 13 16 19 22 1 4 7 10 13 16 19 22
C o ll ec to r o u tl et t em p er a tu re f o r F P C s y st em ( oC ) Time (h) Measured Modelled 02/06/2009 25/11/2009 20/01/2010 0 10 20 30 40 50 60 70 80
1 4 7 10 13 16 19 22 1 4 7 10 13 16 19 22 1 4 7 10 13 16 19 22
C o ll ec to r o u tl et t em p er a tu re f o r E T C s y st em ( oC ) Time (h) Measured Modelled
M
AN
US
CR
IP
T
AC
CE
PT
ED
18
Fig. 11: Measured and predicted heat collected by the FPC system
Fig. 12. Measured and modelled heat collected by the ETC system
0 500 1,000 1,500 2,000 2,500 3,000
1 4 7 10 13 16 19 22 1 4 7 10 13 16 19 22 1 4 7 10 13 16 19 22
H
e
a
t
co
ll
ec
te
d
b
y
F
P
C
s
y
st
em
(
k
J
)
Time (h) Measured Modelled
02/06/2009
25/11/2009 20/01/2010
0 500 1,000 1,500 2,000 2,500 3,000
1 4 7 10 13 16 19 22 1 4 7 10 13 16 19 22 1 4 7 10 13 16 19 22
H
ea
t
c
o
ll
ec
te
d
b
y
E
T
C
s
y
st
em
(
k
J
)
Time (h) Measured Modelled
02/06/2009
M
AN
US
CR
IP
T
AC
CE
PT
ED
19Fig. 13. Measured and modelled heat delivered to load by FPC system
Fig. 14. Measured and modelled heat delivered to load by ETC system
0 2,000 4,000 6,000 8,000 10,000 12,000 14,000 16,000 18,000 20,000
1 4 7 10 13 16 19 22 1 4 7 10 13 16 19 22 1 4 7 10 13 16 19 22
H e a t d el iv er ed t o l o a d b y F P C s y st em ( k J ) Time (h) Measured Modelled
02/06/2009 25/11/2009 20/01/2010
0 2,000 4,000 6,000 8,000 10,000 12,000 14,000 16,000 18,000 20,000
1 4 7 10 13 16 19 22 1 4 7 10 13 16 19 22 1 4 7 10 13 16 19 22
H e a t d el iv e r ed t o l o a d b y E T C s y st e m ( k J ) Time (h) Measured Modelled
M
AN
US
CR
IP
T
AC
CE
PT
ED
20 Table 1
Hot water cylinder parameters
Parameter Value Unit
User specified inlet positions 2
Tank volume 0.3 m3
Tank height 1.68 m
Height of flow inlet 1 0.2 m
Height of flow outlet 1 1.6 m
Fluid specific heat 4.19 kJkg-1K-1
Fluid density 1000 kgm-3
Tank loss coefficient 0.3 Wm-2K-1
Fluid thermal conductivity 1.4 kJhr-1m-1K-1
Boiling temperature 100 oC
Height of 1st auxiliary heater 1 m
Height of 1st thermostat 1.5 m
Set point temperature for element 1 60 oC
Dead band for heating element 1 5 delta C
Maximum heating rate of element 1 9900 kJhr-1
Fraction of glycol 0.4
Heat exchanger inside diameter 0.016 m
Heat exchanger outside diameter 0.02 m
Heat exchanger fin diameter 0.02 m
Total surface area of heat exchanger 1.4 m2
Heat exchanger length 2.0 m
Heat exchanger wall conductivity 1.8 kJhr-1m-1K-1
Heat exchanger material conductivity 1.8 kJhr-1mK-1
Height of heat exchanger inlet 0.4 m
Height of heat exchanger outlet 0.3 m
Table 2
Solar collector parameters
Parameter Unit FPC (Value) ETC (Value)
Number in series 2 1
Collector absorber area m2 3.95 3.021
Fluid specific heat kJkg-1K 3.708 3.708
Tested flow rate kghr-1m-2 80
Intercept efficiency 0.776 0.778
First order efficiency coefficient kJhr-1m-2K-1 14.22 3.276
Second order efficiency coefficient kJhr-1m-2K-2 0.0594 0.036
Maximum flow rate Kghr-1 212 330
Collector slope degrees 53 53
Absorber plate emmittance 0.7
Absorbance of absorber plate 0.8
Number of covers 1
Index of refraction of cover 1.526
M
AN
US
CR
IP
T
AC
CE
PT
ED
[image:22.595.106.520.100.750.2]21 Table 3 Pump parameters
Parameter Value Unit
Rated flow rate (FPC) 212 kghr-1
Rated flow rate (ETC) 330 kghr-1
Fluid specific heat capacity 3.708 kJkg-1K-1
Rated power 226.8 kJhr-1
Table 4
PMEA and PME for collector outlet temperature (Tco), heat collected by the collector (Qcoll)
and heat delivered to the load (Qload)
PMAE PME Tco Qcoll Qload Tco Qcoll Qload