mitochondrial Ca
2+
determines the severity of
inflammation in mouse lung microvessels
David J. Rowlands, … , Sunita Bhattacharya, Jahar
Bhattacharya
J Clin Invest.
2011;
121(5)
:1986-1999.
https://doi.org/10.1172/JCI43839
.
Shedding of the extracellular domain of cytokine receptors allows the diffusion of soluble
receptors into the extracellular space; these then bind and neutralize their cytokine ligands,
thus dampening inflammatory responses. The molecular mechanisms that control this
process, and the extent to which shedding regulates cytokine-induced microvascular
inflammation, are not well defined. Here, we used real-time confocal microscopy of mouse
lung microvascular endothelium to demonstrate that mitochondria are key regulators of this
process. The proinflammatory cytokine soluble TNF-
a
(sTNF-
a
) increased mitochondrial
Ca
2+, and the purinergic receptor P
2Y
2prolonged the response. Concomitantly, the
proinflammatory receptor TNF-
a
receptor–1 (TNFR1) was shed from the endothelial
surface. Inhibiting the mitochondrial Ca
2+increase blocked the shedding and augmented
inflammation, as denoted by increases in endothelial expression of the leukocyte adhesion
receptor E-selectin and in microvascular leukocyte recruitment. The shedding was also
blocked in microvessels after knockdown of a complex III component and after
mitochondria-targeted catalase overexpression. Endothelial deletion of the TNF-
a
converting enzyme (TACE) prevented the TNF-
a
receptor shedding response, which
suggests that exposure of microvascular endothelium to sTNF-
a
induced a Ca
2+-dependent
increase of mitochondrial H
2O
2that caused TNFR1 shedding through TACE activation.
These findings provide what we believe to be the first evidence that endothelial
mitochondria regulate TNFR1 shedding and thereby determine the severity of sTNF-
a
–
induced microvascular inflammation.
Research Article
Find the latest version:
Activation of TNFR1 ectodomain shedding
by mitochondrial Ca
2+
determines the severity
of inflammation in mouse lung microvessels
David J. Rowlands,1 Mohammad Naimul Islam,1 Shonit R. Das,1 Alice Huertas,1 Sadiqa K. Quadri,1
Keisuke Horiuchi,2 Nilufar Inamdar,1 Memet T. Emin,1 Jens Lindert,1 Vadim S. Ten,3
Sunita Bhattacharya,1,3 and Jahar Bhattacharya1
1Lung Biology Laboratory, Division of Pulmonary, Allergy, and Critical Care Medicine, Department of Medicine,
Columbia University College of Physicians and Surgeons, New York, New York, USA. 2Department of Orthopedic Surgery, School of Medicine, Keio University, Tokyo, Japan. 3Department of Pediatrics, Columbia University College of Physicians and Surgeons, New York, New York, USA.
Shedding of the extracellular domain of cytokine receptors allows the diffusion of soluble receptors into the
extracellular space; these then bind and neutralize their cytokine ligands, thus dampening inflammatory
responses. The molecular mechanisms that control this process, and the extent to which shedding regulates
cytokine-induced microvascular inflammation, are not well defined. Here, we used real-time confocal
micros-copy of mouse lung microvascular endothelium to demonstrate that mitochondria are key regulators of this
process. The proinflammatory cytokine soluble TNF-α (sTNF-α) increased mitochondrial Ca
2+, and the
puri-nergic receptor P
2Y
2prolonged the response. Concomitantly, the proinflammatory receptor TNF-α
recep-tor–1 (TNFR1) was shed from the endothelial surface. Inhibiting the mitochondrial Ca
2+increase blocked the
shedding and augmented inflammation, as denoted by increases in endothelial expression of the leukocyte
adhesion receptor E-selectin and in microvascular leukocyte recruitment. The shedding was also blocked in
microvessels after knockdown of a complex III component and after mitochondria-targeted catalase
overex-pression. Endothelial deletion of the TNF-α converting enzyme (TACE) prevented the TNF-α receptor
shed-ding response, which suggests that exposure of microvascular endothelium to sTNF-α induced a Ca
2+-depen-dent increase of mitochondrial H
2O
2that caused TNFR1 shedding through TACE activation. These findings
provide what we believe to be the first evidence that endothelial mitochondria regulate TNFR1 shedding and
thereby determine the severity of sTNF-α–induced microvascular inflammation.
Introduction
Although inflammation initiates as a defensive response against pathogenic stimuli, progression to severe inflammation leads to tissue injury. In the short term, severe inflammation causes life-threatening edema in critical organs such as the lung and brain. In the longer term, inflammation associates with multiple diseases including vascular plaque formation in atherosclerosis, malignant transformation, chronic obstructive pulmonary disease, and fibrot-ic diseases of the lung, liver, and kidney (1–5). There is therefore considerable interest in understanding mechanisms that regulate progression of the inflammatory process from defense to injury.
Ectodomain shedding of cytokines and cytokine receptors plays a major role in establishing this balance, as exemplified by the cytokine receptor TNF-α receptor–1 (TNFR1), which is critical to inflammatory progression (6, 7). The process initiates with TNFR1 ligation by soluble TNF-α (sTNF-α), plasma levels of which rise during inflammation (8, 9). A signaling cascade results, leading to NF-κB activation and proinflammatory gene transcrip-tion (10) as well as activatranscrip-tion of the cell surface metalloprotease TNF-α converting enzyme (TACE; ref. 11). Also referred to as a disintegrin and metallopeptidase domain 17 (ADAM17; ref. 12), TACE cleaves TNFR1. The TNFR1 ectodomains released in the extracellular space chelate sTNF-α, providing negative feedback to the TNF-α–induced inflammatory loop (13). Pathogenic bacteria,
including Chlamydia trachomatis, Neisseria meningitides, and
Staphy-lococcus aureus, have evolved TNFR1 shedding mechanisms as
a strategy for circumventing the host immune response (14–16). The role of mitochondria in these inflammatory events requires consideration. sTNF-α increases production of mitochondrial H2O2
(17) that could activate TACE by oxidizing cysteine thiols in the TACE prodomain (18). Mitochondrial superoxide dismutase cata-lyzes the dismutation of superoxide produced in the electron trans-port chain (ETC) to H2O2. The site of superoxide production in the
ETC depends on the cell type, being predominantly at complex I in skeletal muscle and neural cells (19), but at complex III for vascular smooth muscle cells (20), ECs (21), and alveolar epithelial cells (22). Mitochondrial H2O2 diffuses across the mitochondrial outer
mem-brane to access cytosolic targets, causing multiple functional out-comes, including mechano-oxidative coupling (23), insulin resistance (24), stabilization of hypoxia-inducible factor–1α (20), and tissue factor production (25). However, the role of mitochondrial H2O2 in
endothelial TNFR1 shedding remains unclear.
The vascular endothelium is a major regulator of inflammation. Many acute inflammatory diseases result from inflammation in microvascular beds, in which endothelial activation causes tran-scriptional expression of leukocyte adhesion receptors such as E-selectin (26). Endothelia of both large and small blood vessels express TNFR1 (27), which is critical to this process, as indicated by the fact that inflammation is abrogated in mice lacking TNFR1 (6). Endothelial TNFR1 shedding has been demonstrated in cul-tured human umbilical vein ECs (28) and in ECs incubated with
Conflict of interest: The authors have declared that no conflict of interest exists.
Figure 1
Lung microvessels shed TNFR1 ectodomains.
(A) Confocal images showing endothelial
fluo-rescence in microvessels infused with calcein
(5 μM, 20 minutes) or the anti-TNFR1 mAb
MCA2350 (40 μg/ml, 5 minutes). Images were
obtained 30 minutes after infusion with buffer or 0.01% TB. The image at right was obtained from a separate vessel 30 minutes after label-ing for TNFR1. Alv, alveolus; Lum, microvascular
lumen. Scale bar: 50 μm. (B and C) Endothelial
TNFR1 fluorescence in microvessels infused
with buffer control or sTNF-α (1 ng/ml) for 10
minutes. Scale bar: 25 μm. (D) Line-scan
analy-ses of endothelial immunofluorescence in
ves-sels given buffer control, goat IgG, sTNF-α, or
sTNF-α in the presence of TNFR1 blocking mAb
E20 (40 μg/ml). n = 4 per group per time point.
*P < 0.05 versus control. (E and F) Effects of
TACE (E) and LPS (F) on sTNF-α–induced
TNFR1 shedding in microvessels. Data were obtained 1 hour after intratracheal instillation.
TAP, TAPI-1 (50 μM); LPS (1 mg/kg). *P < 0.05
versus control; #P < 0.05 versus sTNF-α. (G) IB of lysates of lung tissue (replicated 3 times).
(H and I) TNFR1 surface expression in primary
microparticles from atherosclerotic plaques (29). However, it is not known whether microvascular endothelium in situ sheds TNFR1 and whether the shedding regulates the inflammatory process.
In myeloid cells, TNFR1 shedding commences in minutes (30), which suggests the involvement of rapidly activated signaling mechanisms attributable to second messengers such as Ca2+. The
optically imaged lung provides an excellent platform for in situ studies of endothelial second messengers (17, 23). We took advan-tage of this approach to determine the role of endothelial Ca2+ as a
determinant of endothelial TNFR1 shedding in microvessels. We tested this hypothesis by exposing lung microvascular endothe-lium to blood levels of sTNF-α occurring in sepsis (8, 9). Our find-ings indicate that sTNF-α causes endothelial TNFR1 ectodomain shedding through release of mitochondrial H2O2, implicating
mitochondria as regulators of the inflammatory response.
Results
Receptor shedding. To detect surface expression of TNFR1 on ECs in situ, we determined microvascular immunofluorescence using mAb MCA2350, which binds extracellular TNFR1. TNFR1 fluo-rescence colocalized with an endothelial cytosolic marker (Fig-ure 1A) and was stable for at least 1 hour (data not shown). The membrane-impermeable fluorescence quencher trypan blue (TB) abolished the fluorescence (Figure 1A), which affirmed that the immunofluorescence was on the endothelial surface. A 10-min-ute infusion of human sTNF-α initiated fluorescence loss that continued well after the end of sTNF-α infusion (Figure 1C) and was concentration dependent (Supplemental Figure 1A;
supple-mental material available online with this article; doi:10.1172/ JCI43839DS1). Buffer infusion was without effect (Figure 1B). Coinfusion of mAb E20, which blocks TNF-α binding to TNFR1 (31), inhibited the fluorescence loss (Figure 1D), ruling out non-specific effects. Responses caused by TNF-α receptor 2 (TNFR2) can be ruled out, since mAb E20 is specific for TNFR1, and human sTNF-α does not ligate mouse TNFR2 (32).
We considered the role of TACE, the proteolytic enzyme that cleaves surface TNFR1 on leukocytes (11). Since it is not known whether TACE cleaves TNFR1 in lung microvessels, we used the EC-specific TACE-deleted (EC-Tace–/–) mouse (33). sTNF-α–
induced TNFR1 shedding was completely blocked in EC-Tace–/–
mice, but not in Tacefl/fl floxed mice (Figure 1E). TNF-α–processing
inhibitor–1 (TAPI-1), which inhibits TACE, also inhibited sTNF-α– induced shedding (Figure 1E). These findings affirmed that sTNF-α–induced fluorescence loss resulted from TNFR1 shedding through activation of endothelial TACE.
We determined microvascular immunofluorescence of TNFR1 in a mouse model of pneumonitis established by instilling intratrache-al LPS. In WT mice, but not in Tnfa–/– mice, LPS markedly decreased
microvascular TNFR1 expression compared with intratracheal instillation of control buffer (Figure 1F). These findings affirm that LPS caused TNF-α–dependent, microvascular TNFR1 shedding.
[image:4.585.44.539.81.343.2]To determine global lung responses, we gave 10-minute intra-vascular infusions of sTNF-α through the main pulmonary artery. After 30 minutes, we homogenized the lungs and performed IB on lysates of lung tissue using mAb E20 that recognizes cytosolic TNFR1. Shedding of the TNFR1 ectodomain leaves a 27-kDa
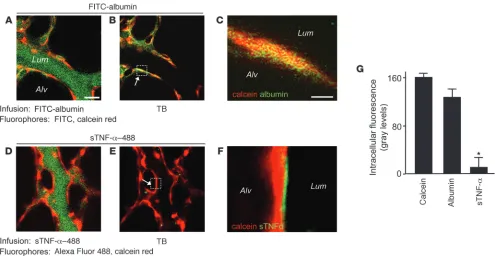
Figure 2
Lung microvascular endothelium does not internalize TNFR1. Lung microvessels were sequentially infused with red fluorescent calcein red
(5 μM, 20 minutes), then (A–C) green fluorescent FITC-conjugated albumin (5%, 10 minutes) or (D–F) green fluorescent sTNF-α–488 (1 ng/ml,
10 minutes). Each infusion was followed by buffer infusion for a further 20 minutes, then by TB. Scale bars: 25 μm. Colocalization of red and
green fluorescence is indicated by yellow pseudocolor in the microvessel (B) and in the high-power image of the boxed region showing a single
cytosolic fragment (34). The appearance of this fragment in WT and Tacefl/fl mice, but not in Tace–/– mice, confirmed that the
receptor’s ectodomain was shed. The continued presence of the 55-kDa band in sTNF-α–treated lungs (Figure 1G) indicated that nonendothelial TNFR1 — as, for example, that expressed in alveoli
[image:5.585.45.540.79.608.2](31) — was not shed, probably because the infused sTNF-α did not access TNFR1 at all lung sites. Flow cytometry of ECs, identified as the vWF-positive fraction in primary cell isolates from lung ves-sels, revealed loss of TNFR1 (Figure 1, H and I), affirming that the shedding response occurred in the lung as a whole.
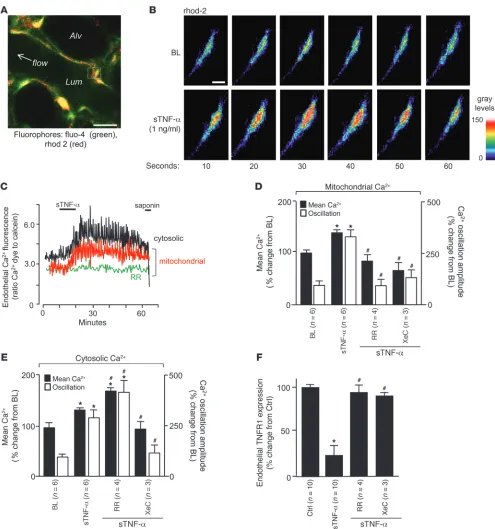
Figure 3
sTNF-α–induced TNFR1 shedding in lung microvessels is Ca2+ dependent. (A) Image shows fluorescence in pseudocolors, indicating Ca2+ levels in
the cytosol and mitochondria. Scale bar: 10 μm. (B and C) High-power view of rhod-2–loaded endothelium (B) and tracings (C) show time-dependent
fluorescence changes indicative of Ca2+ oscillations. Saponin (0.01%) was infused to confirm loss of cytosolic, but not mitochondrial, fluorescence,
Internalization versus shedding. To distinguish between receptor inter-nalization and receptor shedding, each of which could underlie the loss of TNFR1 fluorescence, we determined endothelial uptake of the fluorescent TNFR1 ligand Alexa Fluor 488–conjugated sTNF-α
(sTNF-α–488). We normalized fluorescence of sTNF-α–488 against the cytosolic fluorescence of calcein red. As a comparison, we deter-mined uptake of FITC-conjugated albumin (FITC-albumin), which is internalized by endothelium (35). As expected, infusion of FITC-albumin increased green fluorescence of the endothelial lining (Fig-ure 2, A and B). Fail(Fig-ure of TB to diminish the fluorescence (Fig(Fig-ure 2, B, C, and G) confirmed that the infused FITC-albumin was taken up by the endothelium. In contrast, the immediate postinfusion fluo-rescence of sTNF-α–488 on the endothelial lining was quenched by TB (Figure 2, D and E), confirming binding of the ligand to extracellular TNFR1. However, sTNF-α–488 did not colocalize with calcein (Figure 2F), which indicates that the ligand was not inter-nalized. sTNF-α–488 fluorescence decreased with a time course similar to that of TNFR1 fluorescence (Supplemental Figure 1, B and C). Together, these findings indicate that ligated TNFR1 was shed and not internalized.
Ca2+ responses. Quantifications of endothelial Ca2+ in the endothelial
cytosol and mitochondria indicated that sTNF-α increased mean Ca2+ as well as the amplitude of Ca2+ oscillations at both sites (Figure
3, A–C). Ligation of TNFR1 releases inositol-1,4,5-triphosphate (IP3;
ref. 36). Ligation of IP3 receptors on the ER releases ER Ca2+ to the
cytosol. Ca2+ uptake by the ER and mitochondria causes cytosolic
Ca2+ oscillations and mitochondrial Ca2+ increases (37).
Consis-tent with these concepts, the mitochondrial Ca2+ uptake inhibitor
ruthenium red (RR), which we and others have shown to be mem-brane permeable (23, 38), blocked only the mitochondrial responses, whereas the IP3 receptor antagonist xestospongin C (XeC) abolished
all responses (Figure 3, C–E). These findings confirmed that the cytosolic Ca2+ transients were upstream of the mitochondrial Ca2+
responses. Importantly, inhibition of the mitochondrial Ca2+ increase
completely blocked the loss of endothelial TNFR1 fluorescence (Fig-ure 3F), affirming a mitochondrial role in TNFR1 shedding.
A consistent feature was the prolonged duration of the Ca2+
responses that persisted for up to 1 hour, lasting well beyond the 10-minute sTNF-α infusion. Since increase of mitochondrial Ca2+ increases ATP production by the ETC (39), and since ATP is
secreted (40), we considered the role of the purinergic receptor P2Y2
(encoded by P2Y2). In P2Y2–/– mice, both cytosolic and
mitochon-drial Ca2+ oscillations were augmented during sTNF-α infusion, as
in WT mice. However, the prolonged oscillations were completely inhibited (Figure 4). In contrast, no inhibition occurred in P2Y1
receptor–deficient P2Y1–/– mice (Figure 4), which indicates that the
P2Y2 receptor was responsible for the prolonged Ca2+ responses.
Mitochondrial ROS. To determine whether the increased
mito-chondrial Ca2+ augmented mitochondrial ROS production (23),
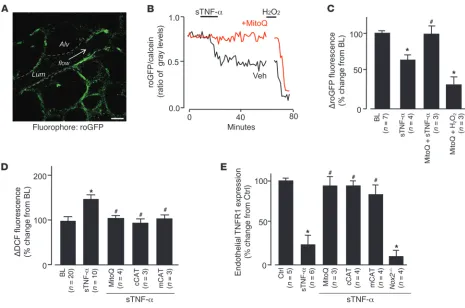
we expressed the fluorescent protein roGFP (see Methods) in lung microvessels. We confirmed the expression through IB of lung tis-sue and fluorescence imaging of lung microvessels (Figure 5A and Supplemental Figure 2, A and B). To affirm roGFP as a valid ROS detector in situ, we confirmed the expected inverse relationship between probe fluorescence and H2O2 concentration
(Supplemen-tal Figure 2, C and D). To determine the response to sTNF-α, we coloaded roGFP-expressing microvessels with calcein red. sTNF-α
decreased roGFP fluorescence relative to calcein fluorescence (Fig-ure 5, B and C), indicative of increased endothelial ROS.
[image:6.585.86.501.81.347.2]To determine the mitochondrial role in ROS production, we infused microvessels with the mitochondria-specific antioxidant MitoQ (41), which consists of the lipophilic triphenylphosphonium
Figure 4
Purinergic receptors are required for sustained sTNF-α–induced endothelial Ca2+ oscillations. Traces from single microvessels and group data show
(TPP) cation bound to the antioxidant ubiquinol. The negative mito-chondrial potential localizes the cationic compound to mitochon-dria, where the MitoQ complex undergoes oxidation reduction reac-tions. In MitoQ-treated microvessels, the sTNF-α–induced decrease of roGFP fluorescence was completely blocked (Figure 5, B and C), which indicates that MitoQ blocked ROS production. As a positive control, we confirmed that exposure to H2O2 decreased the
fluores-cence (Figure 5, B and C). The inhibition by MitoQ indicated that the ROS were of mitochondrial origin.
In microvessels in which we detected ROS by the dichlorofluores-cein (DCF) method, the mitochondrial role was further affirmed: the sTNF-α–induced DCF response was completely blocked by pretreating vessels with the mitochondrial complex I inhibitor rotenone (Supplemental Figure 4, A and B). The ROS response was not inhibited in microvessels treated with the flavoprotein inhibitor diphenylene iodonium or the eNOS antagonist rotenone (G)-nitro-l-arginine methyl ester (l-NAME), which indicated
that the DCF responses were specific to ROS. Further, the ROS response was not inhibited in microvessels of Nox2–/– mice
(Sup-plemental Figure 4C), ruling out a role for this NOX isoform. To identify the ROS, we overexpressed the H2O2 hydrolyzing
agent catalase targeted to mitochondria and the cytosol (mCAT and cCAT, respectively; Supplemental Figure 5, A–D). We used
DCF fluorescence as the ROS reporter. In microvessels expressing these catalases, the sTNF-α–induced ROS increases were complete-ly inhibited (Figure 5D), whereas no inhibition occurred with the empty vector (data not shown). The inhibition by mCAT indicated that ROS fluorescence was caused by mitochondrial H2O2. The
inhibition by cCAT indicated that H2O2 diffused from
mitochon-dria to the cytosol. The similar inhibitions of ROS by mCAT and cCAT indicate that overexpression of catalase at either site was suf-ficient to reduce all of the H2O2 in the cell. In microvessels of WT
mice treated with MitoQ or expressing mCAT or cCAT, TNFR1 shedding was abrogated, whereas shedding was not blocked in microvessels of Nox2–/– mice (Figure 5E). sTNF-α–induced
mito-chondrial Ca2+ increases were not affected by MitoQ treatment
or mCAT overexpression (Supplemental Figure 3), ruling out the possibility that these treatments blocked the sTNF-α–induced mitochondrial Ca2+ response.
[image:7.585.57.522.80.388.2]The Rieske iron sulphur protein (RISP) of mitochondrial com-plex III is a major source of mitochondrial ROS in lung cells (20). To determine the role of RISP in the present responses, we intravenously injected mice with fluorophore-labeled siRNA against RISP (siRISP) complexed with cationic liposomes. These procedures did not increase endogenous sTNF-α in blood or in the BAL, and leukocyte BAL counts were unchanged (Supplemental Figure 6, B and C), affirming
Figure 5
Mitochondrial H2O2 mediates sTNF-α–induced TNFR1 shedding. DCF (2.5 μM). (A) roGFP fluorescence in mouse lung endothelium. Dashed
lines indicate microvascular walls; arrow denotes direction of flow. Scale bar: 25 μm. (B and C) Single experiment (B) and group data (C)
show-ing endothelial roGFP fluorescence responses after infusion of sTNF-α (1 ng/ml, 10 minutes) in the presence of MitoQ (100 nM) or vehicle (Veh;
ethanol). H2O2 (10 μM) was administered by microvascular micropuncture. (D) Group data for DCF-loaded microvessels infused with sTNF-α
in the presence or absence of MitoQ or in lungs from mice transfected with cCAT or mCAT. Responses in vector-transfected animals were not
significantly different from control (n = 3 for each empty vector; not shown). (E) Effect of ROS inhibition on sTNF-α–induced shedding of TNFR1
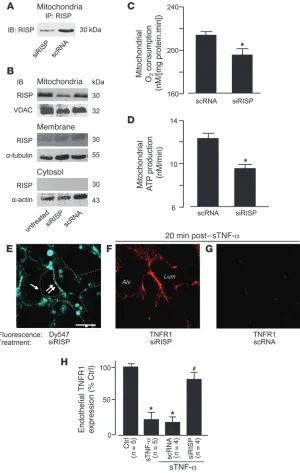
that the liposome-siRNA treatment did not cause detectable innate immune responses (42). At 2 days after injection, in mitochondrial fractions of lung ECs or lung tissue lysates, RISP was markedly lower in siRISP-treated lungs than in those treated with scrambled siRNA (scRNA; Figure 6, A and B, and Supplemental Figure 6A). Although a faint RISP band was present in the nonmitochondrial membrane fraction (Figure 6B), there was no knockdown of this band, which suggests it was caused by nonspecific binding by the IB antibody. No RISP band was present in the cytosolic fraction (Figure 6B). In isolat-ed lung mitochondria, RISP knockdown decreasisolat-ed rates of both ATP production and O2 consumption (Figure 6, C and D, and
Supplemen-tal Figure 6D). The mitochondrial uptake of a potential-sensitive dye was similar in siRISP- and scRNA-treated lungs (Supplemental Figure 6E), consistent with reports that the present ATP decrease does not change the mitochondrial membrane potential (43).
siRISP fluorescence in microvessels was patchy: fluorescence was bright in some regions, but rela-tively dim in others (Figure 6E). After sTNF-α
infusion, siRISP-expressing microvessels showed sustained TNFR1 fluorescence (Figure 6, F and H), which indicates that RISP knockdown abrogated the shedding response. In contrast, the infusion induced loss of TNFR1 fluorescence in scRNA-expressing microvessels (Figure 6, G and H), which indicates that shedding was present in these ves-sels. We interpret that knockdown of mitochon-drial RISP protected against TNFR1 shedding; this is the first evidence to our knowledge that mitochondrial RISP determines ectodomain shedding of a proinflammatory receptor.
In one experiment, we took advantage of the uneven siRISP expression in different microves-sels in order to determine whether blockade of TNFR1 shedding was also uneven. At baseline, there was no correlation between siRISP and TNFR1 fluorescence (Supplemental Figure 7A), which indicates that RISP knockdown did not affect the expression of unligated TNFR1. In con-trast, sTNF-α infusion induced a strongly positive correlation between the expression levels of RISP and TNFR1 (Supplemental Figure 7B), which indicates that sites of high siRISP expression were also sites at which TNFR1 shedding was blocked. These findings affirm that the extent of mitochondrial RISP expression determined the extent of TNFR1 shedding.
To assay TACE expression in the alveolo-capillary region, we determined immunofluorescence of the TACE extracellular domain by injecting fluorescent antibodies by alveolar or micro-vascular micropuncture. At baseline, TACE immunofluorescence was well developed on both alveolar epithelium and micro-vascular endothelium in Tacefl/fl mice (Figure 7A). However, in
EC-Tace–/– mice, TACE fluorescence was absent on the
endothe-lium, although VE-cadherin fluorescence (positive control) was present (Figure 7A). In EC-Tace–/– mice or in microvessels given
TAPI-1 infusion, the sTNF-α–induced cytosolic and mitochon-drial Ca2+ and ROS responses were enhanced (Figure 7, B–D).
[image:8.585.46.346.83.556.2]These findings indicate that sustained expression of TNFR1, resulting from inhibition of TNFR1 shedding, caused enhanced
Figure 6
Mitochondrial RISP is required for TNFR1 shed-ding in lung microvessels. Mice were treated with
the indicated siRNAs. (A–D) Lungs were analyzed
2 days after for RISP expression by IB on lysates derived from primary isolates of lung ECs (A; n = 3) and lung homogenates (B; n = 3) in the indicated cell fractions. Determinations on isolated lung mitochon-dria are shown (C and D; n = 4). *P < 0.05 versus
scRNA. (E–G) Microvessels at baseline (E) and 20
minutes after sTNF-α (1 ng/ml, 10 minutes)
infu-sion (F and G). Regions of low (single arrow) and
high (double arrow) siRISP uptake are indicated
(E). Dashed lines indicate microvascular walls. (H)
sTNF-α–induced Ca2+ and ROS responses. We interpret these
find-ings to suggest that ligation of TNFR1 by sTNF-α led to TACE activation by mitochondria-derived H2O2.
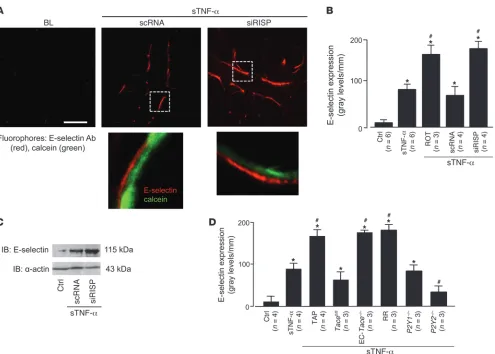
Leukocyte recruitment. To assess inflammatory responses, we
determined microvascular expression of the leukocyte adhesion receptor E-selectin. Although not present at baseline, E-selectin fluorescence was clearly evident 2 hours after the 10-minute sTNF-α infusion (Figure 8, A and B). This response was dimin-ished in P2Y2–/– mice (Figure 8D), which indicates that the
P2Y2 receptor played a role in inducing endothelial E-selectin.
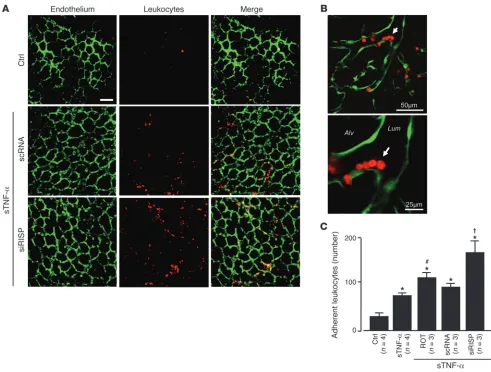
The sTNF-α infusion also increased microvascular leukocyte adhesion in 2 hours (Figure 9, A–C). Both E-selectin expression and leukocyte adhesion responses were markedly enhanced in microvessels treated with siRISP or with inhibitors of mito-chondrial electron transport (Figure 8, A–D, and Figure 9C). These findings indicate that inhibitors of mitochondrial func-tion blocked the inflammatory responses.
Discussion
sTNF-α caused rapid TNFR1 shedding in lung microvessels, providing the first evidence to our knowledge that ECs in situ shed the receptor. Injection of sTNF-α also increased endothelial cytosolic Ca2+, mitochondrial Ca2+, and mitochondrial ROS.
These responses confirm our previous findings in which IP3
-induced increase of cytosolic Ca2+ sequentially caused the
mito-chondrial responses, independently of external Ca2+ (17, 23). We
now report that TNFR1 shedding was blocked after inhibition of mitochondrial Ca2+ by RR or inhibition of ROS by mitochondrial
RISP knockdown. Overexpression of mCAT, which hydrolyzes H2O2, also blocked the shedding. These findings indicate that
H2O2 is the ROS responsible for the shedding and that
mitochon-drial Ca2+ increase is upstream of H
2O2 production. Together, our
previous (17, 23) and present findings suggest that mitochondrial Ca2+ increase caused RISP-induced ROS production in
[image:9.585.42.527.79.484.2]microves-sels, leading to endothelial TNFR1 shedding.
Figure 7
TNFR1 shedding enhances sTNF-α–induced lung endothelial responses. (A) Alveolar and vascular immunofluorescence of TACE and the
Our results indicate that an inflammatory response occurred despite TNFR1 shedding. Thus, the sTNF-α–treated microvessels expressed endothelial E-selectin. Induction of E-selectin, which is not normally expressed by microvessels, indicates that sTNF-α
caused proinflammatory transcription (44, 45) that might have been induced by the increase in cytosolic Ca2+ (46, 47).
Microvascu-lar leukocyte recruitment was also evident, occurring possibly as a consequence of increased E-selectin expression. Notably, when we blocked mitochondrial Ca2+ and ROS production, TNFR1
shed-ding was blocked. Consequently, endothelial TNFR1 expression was sustained, resulting in a stronger inflammatory response. This was indicated by enhanced E-selectin expression and leukocyte recruitment. To our knowledge, these findings provide the first evidence for a signaling sequence in which mitochondrial inhibi-tion enhances the inflammatory response to sTNF-α (Figure 10). We propose that TNFR1 shedding by mitochondrial H2O2
pro-tects against progression of inflammation.
The Ca2+ increases occurred in 2 phases: first as an initial phase
dur-ing the 10-minute sTNF-α infusion, and then as a prolonged phase that persisted for up to 1 hour, even after the infusion had stopped. Increase of mitochondrial Ca2+ activates mitochondrial
dehydroge-nases, increasing ATP production by the ETC (37). ECs secrete ATP, which ligates the P2Y2 receptor to induce IP3-dependent cytosolic
Ca2+ increases (40, 48). Here, lack of the P2Y2 receptor, namely in P2Y2–/– mice, blocked the prolonged phase of Ca2+ oscillations, but
not the initial phase. Concomitantly, the induced E-selectin expres-sion was also markedly suppressed. Although the P2Y2 receptor has
been implicated in leukocyte recruitment (49), to our knowledge, underlying signaling mechanisms have not been defined. Our find-ings indicate that by prolonging microvascular Ca2+ oscillations, the
P2Y2 receptor critically regulates the inflammatory response.
[image:10.585.47.542.78.432.2]Endothelial TACE (12) has previously been implicated in patho-logical neovascularization (33). Our findings are suggestive of a new role for endothelial TACE, namely as a determinant of the
Figure 8
TNFR1 shedding determines lung microvascular E-selectin expression. (A) Upper images show live E-selectin immunofluorescence (red)
in microvessels coloaded with cytosolic fluorescence of calcein (green). Lungs are from mice transfected with scRNA or siRISP. The
microvessels were infused with sTNF-α for 10 minutes, then imaged 2 hours later. E-selectin Ab (40 μg/ml) was microinjected. Unbound
antibody was removed by buffer wash. Bar: 25 μm. Lower images show ECs in the boxed regions at high power, indicating increased
density of E-selectin in a siRISP-treated mouse. (B) Effect of mitochondrial inhibitors on E-selectin expression, determined by endothelial
line-scan analyses. ROT, rotenone (1 μM). (C) IB representative for 3 separate experiments of untreated control or sTNF-α–infused
scRNA or siRISP-transfected lungs. (D) Lung E-selectin expression. sTNF-α was infused as indicated in WT, Tacefl/fl, Tace–/–, P2Y1–/–, and
microvascular inflammatory response. Under inflammatory conditions in which leukocytes adhere to ECs, endothelial ecto-domain shedding could potentially be activated by proteases on the leukocyte surface (50). Definitive exclusion of this possibility was achieved by the availability of mice carrying floxed alleles of
Tace and a Cre recombinase expressed in ECs (Tie2-Cre). Although mice lacking TACE die in the perinatal period (51), EC-Tace–/–
mice survive to adulthood, expressing no obvious developmental abnormalities (33). In these adult EC-Tace–/– mice, there was no
sTNF-α–induced TNFR1 shedding, which indicates that the shed-ding was entirely regulated by endothelial TACE.
TACE activity is enhanced by oxidation of cysteine thiol groups in its disintegrin/cysteine-rich region (18). A proposed mechanism of TACE activation is that proinflammatory sec-ond messengers such as ROS (52, 53) and NO (54) disrupt the thiol-zinc linkage, resulting in shedding of TACE substrates such as TNFR1 (55). Consistent with this proposal, we found that after infusion of MitoQ (41) or overexpression of cCAT or mCAT, TNFR1 shedding was blocked. These findings, taken
together with the considerations discussed above, indicate that sTNF-α–induced mitochondrial H2O2 activated TACE to
estab-lish the shedding responses.
Loss of TNFR1 from the cell surface could be due to shedding or cellular internalization. Cultured ECs grown in static media inter-nalize shed TNFR1 ectodomains (56). However, in an in situ assay that we believe to be novel, we failed to detect any evidence for endothelial internalization of the TNFR1 ectodomains, although our assay successfully detected albumin internalization, thereby ruling out nonspecific errors. Extracellular release of TNFR1 ecto-domains was also indicated in flow cytometry and IB analyses of primary vascular cell isolates recovered from sTNF-α–treated lungs. We conclude from these findings that in the presence of blood flow, which is likely to wash out cleaved proteins from the endothelial surface, shed ectodomains are not internalized by microvascular endothelium.
[image:11.585.41.532.80.452.2]Redox studies in vivo have been hampered by nonspecificities attributable to pharmacological inhibitors and fluorescein-based dyes. In cultured cells, the ROS-sensitive protein roGFP provides
Figure 9
Mitochondrial mechanisms determine sTNF-α–induced microvascular leukocyte recruitment. (A and B) Low- (A) and high-magnification (B)
confocal images show leukocytes (red) adherent to lung endothelium (green). Lungs were infused as indicated with buffer control or sTNF-α for
10 minutes. Images were obtained after 2 hours. Arrow denotes adherent leukocytes at a microvessel branch-point. Scale bars: 50 μm (A and
B, top); 25 μm (B, bottom). (C) Number of adherent leukocytes per lung, determined as the average for 5 regions viewed at low magnification.
specific quantification of cytosolic H2O2 (57). In its first in vivo
application to our knowledge, we expressed the roGFP-encoding construct in microvessels. In roGFP, engineered cysteines form a disulfide crosslink between β strands adjacent to the chromo-phore in GFP (58). Specificity of the probe as an oxidant reporter is attributable to the fact that cysteine oxidation causes struc-tural, hence spectral, changes. Our validation studies confirmed that roGFP was a reliable indicator of H2O2 for in situ
determi-nations. In addition, we selectively overexpressed catalase in the mitochondria or the cytosol. These approaches, including the RISP knockdown with siRNA, provided specific strategies for addressing mitochondrial redox responses in vivo.
The clinical significance of our findings bears on the emerging importance of mitochondria in inflammatory disease. Here, we show that TNFR1 shedding, an antiinflammatory effect, occurred in a TNF-α–dependent manner in lung microvessels as well as in LPS-treated lungs. To the extent that endothelial mitochondria are responsible for the shedding response, as we show here, loss of mitochondrial function might be proinflammatory. Inflamma-tory conditions such as sepsis cause loss of lung mitochondrial function, as demonstrated by decreased lung ATP (59, 60). Our findings indicate that in such conditions, therapy aimed at restor-ing endothelial mitochondrial function might protect against the deleterious effects of increasing inflammation.
Methods
Fluorophores
DCF (2′,7′-dichlorodihydrofluorescein diacetate), fluo-4 AM, rhod-2 AM, calcein red AM, calcein green AM, and FITC-conjugated albumin were pur-chased from Invitrogen.
Antibodies
RISP mAb was purchased from Invitrogen. TNFR1 blocking anti-body E20 (17, 31), and antibodies against E-selectin (H300), TACE (extracellular epitope; H170), GFP, catalase, α-tubulin, and voltage-dependent anion channel (VDAC; C20) were purchased from Santa Cruz. Antibodies E-selectin (extracellular epitope), VE-cadherin (rat anti-mouse), α-actin, and vWF were purchased from BD Biosciences. mAb MCA2350 against the TNFR1 extracellular epitope was purchased from AbD Serotec. For flow cytometry and in situ immunofluorescence
studies, supplier-recommended nonimmune IgG controls were used. TNF-α levels in BAL and plasma were assayed in duplicate by ELISA (eBiosciences) per the manufacturer’s specifications.
Agents
RR, XeC, human recombinant sTNF-α, LPS, l-NAME, dithiothreitol, p-trifluoromethoxy carbonyl cyanide phenyl hydrazone (FCCP), and TB were purchased from Sigma-Aldrich. TAPI-1, saponin, and diphenyl-ene iodonium were purchased from Calbiochem. MitoQ and negative control agent decyl TPP were provided by M.P. Murphy (University of Cambridge, Cambridge, United Kingdom). Antibodies and TNF-α were fluorescently labeled with Alexa Fluor 633 and Alexa Fluor 488 using standard protocols.
Animals
Animal procedures were approved by the Institutional Animal Care and Use Committee of Columbia University Medical Center. Tacefl/fl mice
and EC-Tace–/– mice (Tacefl/flTie2-Cre; ref. 33) were provided by C.P. Blobel
(Hospital for Special Surgery, Medical College of Cornell University, New York, New York, USA). P2Y1–/– and P2Y2–/– mice (both C57BL/6
background) were provided by B.H. Koller (University of North Caro-lina, Chapel Hill, North CaroCaro-lina, USA). Nox2–/– and Tnfa–/– mice (both
C57BL/6 background) and age-, gender- and strain-matched WT mice were purchased from Jackson Laboratory.
Lung preparation
Lungs were prepared according to our previously reported methods (61). Briefly, mice were anesthetized (ketamine-xylazine), and lungs were excised en bloc. Lungs were continuously pump-perfused with autologous blood (final hematocrit, 10%) diluted in HEPES (150 mmol/l Na+, 5 mmol/l
K+, 1.0 mmol/l Ca2+, 1 mmol/l Mg2+, and 20 mmol/l HEPES at pH 7.4)
containing 4% dextran (70 kDa) and 1% fetal bovine serum at pH 7.4 and osmolarity of 295 mosM at a rate of 0.5 ml/min at 37°C. Lungs were con-stantly inflated through an airway cannula at airway pressure of 5 cmH2O.
Pulmonary artery and left atrial pressures were held at 10 and 3 cmH2O,
respectively. The lung surface was moistened with saline and covered with Saran Wrap during imaging to prevent drying. For assay of leukocyte adhe-sion, we enriched the lung perfusate with 2.5 × 10⁵ cells/ml of fluorescently
[image:12.585.45.323.83.274.2]labeled (calcein red) leukocytes (62) for 30 minutes followed buffer wash for 20 minutes to remove nonadherent leukocytes. Leukocytes were counted in each lobe of the lung from images taken with a ×10 objective.
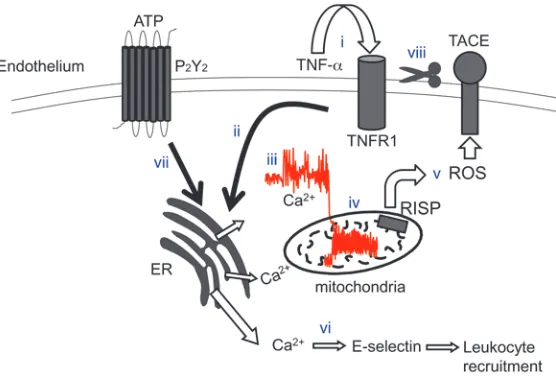
Figure 10
Sequence of events underlying sTNF-α–induced TNFR1
shedding in lung endothelium. Ligation of TNFR1 by sTNF-α
(i) leads to IP3-induced store release of Ca2+ (ii), resulting in increase of cytosolic Ca2+ (iii), increase of mitochondrial
Ca2+ (iv), and RISP-dependent ROS generation at
com-plex III (v). Elevation of cytosolic Ca2+ leads to E-selectin expression and leukocyte recruitment (vi). Release of ATP ligates the P2Y2 receptor and potentiates the cytosolic Ca2+ increase (vii). ROS-dependent activation of TACE (viii)
limits further sTNF-α signaling by stimulating ectodomain
Imaging
Live fluorescence imaging was carried out using our previously described methods (23). Briefly, microvessels were fluorescence loaded by 20-minute infusions of fluorophores given in the lung perfusion, followed by a 10-minute buffer wash. Microvessels were viewed by confocal microscopy (LSM 5; Zeiss). Ca2+ responses were recorded at 1 image/10 seconds and DCF at 1 image/30
seconds. The longer interval prevented dye photoactivation. To rule out poten-tial errors attributable to local changes in cell volume, fluorescence of Ca2+ and
ROS-sensitive dyes was normalized against fluorescence of a soluble cytosolic dye (calcein or calcein red). In all experiments in which more than 1 dye was loaded, we confirmed absence of bleed-through between fluorescence emis-sion channels. Spatial selectivity of cytosolic (fluo-4 AM) and mitochondrial (rhod-2 AM) Ca2+ dyes was determined by infusion of saponin at the end of
an experiment, which selectively abolishes cytosolic Ca2+ fluorescence (63). To
assay fluorophore internalization, infusion of fluorophore-conjugated agents was followed by vascular infusion of the fluorescence-quenching agent TB. To label endothelial surface proteins (TNFR1 and E-selectin), fluorophore-conju-gated antibodies were infused by micropuncture (64) of lung microvessels for 5 minutes followed by buffer wash to remove unbound antibody. Endothelial fluorescence was quantified using MetaMorph software through analyses based on region-of-interest (Ca2+ and ROS), line scan (antibody fluorescence),
and segmentation (leukocyte adhesion) tools.
In vivo transfection
Constructs for human cCAT and mCAT were provided by J.A. Melendez (Albany Medical College, Albany, New York, USA; ref. 65) and subcloned into the pBI-CMV bidirectional vector for the fluorescent protein DsRed (Clontech). A plasmid for the ROS probe, roGFP, was provided by S.J. Remington (Univer-sity of Oregon, Eugene, Oregon, USA; ref. 58). roGFP contains 2 engineered cys-teine residues to generate a redox-sensitive GFP protein that displays decreased emission maxima upon oxidation when excited at 484 nm. For control, mice were transfected with the appropriate empty vector. Custom-designed fluo-rophore-conjugated (Dy547) siSTABLE (stability-enhanced) siRISP was pur-chased from Dharmacon. siRISP and scRNA sequences were as follows: sense, Dy547-5′-CGACUUCUCUGACUAUCGUUU-3′; antisense, 5′ -ACGAAUAGU-CAGAGAAGUCGUU-3′. For control experiments, we used nontargeting oligo-nucleotides as follows: sense, Dy547-5′-UAGCCGACUAAACACAUCAAUU-3′; antisense, 5′-GUGAUGUGUUUAGUCGCUAUU-3′.
Stock solutions (2.5 μg/μl) of siRNA and scRNA oligonucleotides or plasmids (2.5 μg/μl) were complexed with freshly extruded unilamellar liposomes (20 μg/μl, 100-nm pore size; DOTAP, Avanti Lipids) in sterile PBS to a final oligonucleotide concentration of 0.5 μg/μl. Mice were given the nucleic acid–liposome mixture as a 100-μl injection by tail vein. Lungs from transfected animals were excised 48 hours later.
Isolation of lung vascular cells
Isolation of lung vascular cells has been described elsewhere (66). Briefly, the lung vasculature was perfused with 5 ml ice-cold buffer (PBS with 0.1% BSA) to clear blood, then sequentially infused with collagenase (0.5 ml, 1,000 U/ml, 15 minutes), PBS with 5% BSA (5 ml), and buffer (25 ml, 10 minutes), and the mixed effluent was collected. The sample was filtered (100-μm pore filter; BD) and then centrifuged (650 g, 10 min) and pellet washed 3 times by repeated centrifugations in buffer.
Flow cytometry
Lung vascular cells were stained with fluorophore-labeled antibodies (Alexa Fluor 633, Alexa Fluor 488, FITC) under nonpermeabilized con-ditions to enable surface staining. Flow cytometry (FACScalibur, BD) gating conditions were set against isotype- and fluorophore-matched nonimmune IgGs.
IP and IB
Lungs were homogenized (Tissue Tearor; Biospec Products), and mitochon-drial and cytosolic fractions were separated (mitochonmitochon-drial isolation kit; Pierce). Purity of cell fractionation was determined by reciprocal IB for VDAC in mitochondrial and cytosolic fractions. For cell surface proteins (TNFR1 and E-selectin), whole lungs were homogenized, and membrane fractions were lysed in 2% SDS. For IP, lysates containing 2 mg total protein were precleared with appropriate control IgG for 30 minutes at 4°C with 20 μl prewashed protein A/G and processed as previously described (66). Equal amounts of protein from lysates were separated by SDS-PAGE, electrotrans-ferred onto nitrocellulose membrane overnight at 4°C, blocked in Starting Block Blocking Buffer (Pierce) for 1 hour, and then subjected to IB.
Mitochondrial assays
All assays were conducted on mitochondria isolated from lung tissue according to previously reported methods (67).
O2 consumption and ATP production. The mitochondria (50 μg protein)
were suspended in respiration buffer (0.5 ml, 32°C; 200 mM sucrose, 25 mM KCl, 2 mM K2HPO4, 5 mM HEPES-KOH at pH 7.2, 5 mM MgCl2,
0.2 mg/ml BSA, 30 μM Ap5A(P1,P5-di[adenosine 5′]-pentaphosphate
[inhibitor of adenylate kinase], 5 mM glutamate, and 5 mM succinate). The mitochondrial suspension was assayed for O2 concentration by
means of a Clark-type electrode (ml/g protein; Oxytherm, Hansatech Instruments). Briefly, after obtaining baseline measurements (state 4 res-piration), ADP (100 nM) was added to the suspension to increase mito-chondrial O2 consumption (state 3 respiration). ATP concentration was
determined by the bioluminescence assay (Abcam) at baseline (ATPpre) and
after the ADP-induced increase in O2 consumption had reached a plateau
(ATPpost). ATP production rate was determined as (ATPpost — ATPpre)/t,
where t is time of state 3 or ADP-phosphorylating respiration.
Membrane potential. Mitochondrial membrane potential was assayed in terms of the mitochondrial uptake of the potential-sensitive dye safranin O, as previously described (68, 69). Briefly, isolated mitochondria were sus-pended in respiration buffer containing safranin O (1 μM). Potential-induced uptake of safranin fluorescence in the mitochondrial matrix decreased buffer fluorescence (Hitachi F-7000 FL fluorescence spectrophotometer; excitation 495 nm; emission 585 nm) (Supplemental Figure 6E). Addition of the mito-chondrial depolarizer FCCP (60 nM) abrogated fluorescence uptake.
Statistics
Results are expressed as mean ± SEM. 1-way ANOVA followed by New-man-Keuls post-hoc analyses (MiniTab) was used for comparisons between groups. A P value less than 0.05 was accepted as significant. All group data were obtained from experiments repeated in separate lungs unless otherwise stated.
Acknowledgments
This work was supported by NIH grants HL57556, HL36024, and HL69514 to J. Bhattacharya. The TNF-α ELISAs were supervised by C.W. Schindler (Columbia University Medical Center, New York, New York, USA). Tara Guclu assisted with manuscript preparation.
Received for publication May 26, 2010, and accepted in revised form February 9, 2011.
1. Blank U, Essig M, Scandiuzzi L, Benhamou M, Kanamaru Y. Mast cells and inflammatory kidney disease. Immunol Rev. 2007;217:79–95.
2. Grivennikov SI, Greten FR, Karin M. Immunity, inflammation, and cancer. Cell. 2010;140(6):883–899. 3. Hotchkiss RS, Karl IE. The pathophysiology and treat-ment of sepsis. N Engl J Med. 2003;348(2):138–150. 4. Libby P, Okamoto Y, Rocha VZ, Folco E.
Inflam-mation in atherosclerosis: transition from theory to practice. Circ J. 2010;74(2):213–220.
5. Wheeler AP, Bernard GR. Acute lung injury and the acute respiratory distress syndrome: a clinical review. Lancet. 2007;369(9572):1553–1564. 6. Kneilling M, et al. Direct crosstalk between mast
cell-TNF and TNFR1-expressing endothelia mediates local tissue inflammation. Blood. 2009; 114(8):1696–1706.
7. Xanthoulea S, et al. Tumor necrosis factor (TNF) receptor shedding controls thresholds of innate immune activation that balance opposing TNF functions in infectious and inflammatory diseases. J Exp Med. 2004;200(3):367–376.
8. Ding J, Song D, Ye X, Liu SF. A pivotal role of endothelial-specific NF-kappaB signaling in the pathogenesis of septic shock and septic vascular dysfunction. J Immunol. 2009;183(6):4031–4038. 9. Taudorf S, Krabbe KS, Berg RM, Pedersen BK,
Moller K. Human models of low-grade inflamma-tion: bolus versus continuous infusion of endo-toxin. Clin Vaccine Immunol. 2007;14(3):250–255. 10. Chen G, Goeddel DV. TNF-R1 signaling: a
beauti-ful pathway. Science. 2002;296(5573):1634–1635. 11. Bell JH, Herrera AH, Li Y, Walcheck B. Role of
ADAM17 in the ectodomain shedding of TNF-alpha and its receptors by neutrophils and macro-phages. J Leukoc Biol. 2007;82(1):173–176. 12. Black RA, et al. A metalloproteinase disintegrin
that releases tumour-necrosis factor-alpha from cells. Nature. 1997;385(6618):729–33.
13. Van Zee KJ, Kohno T, Fischer E, Rock CS, Moldaw-er LL, Lowry SF. Tumor necrosis factor soluble receptors circulate during experimental and clini-cal inflammation and can protect against excessive tumor necrosis factor alpha in vitro and in vivo. Proc Natl Acad Sci U S A. 1992;89(11):4845–4849. 14. Deghmane AE, Veckerle C, Giorgini D, Hong E,
Ruckly C, Taha MK. Differential modulation of TNF-alpha-induced apoptosis by Neisseria menin-gitidis. PLoS Pathog. 2009;5(5):e1000405. 15. Gomez MI, O’Seaghdha M, Magargee M, Foster TJ,
Prince AS. Staphylococcus aureus protein A activates TNFR1 signaling through conserved IgG binding domains. J Biol Chem. 2006;281(29):20190–20196. 16. Paland N, Bohme L, Gurumurthy RK, Maurer A,
Szczepek AJ, Rudel T. Reduced display of tumor necrosis factor receptor I at the host cell surface supports infection with Chlamydia trachomatis. J Biol Chem. 2008;283(10):6438–6448.
17. Parthasarathi K, Ichimura H, Quadri S, Issekutz A, Bhattacharya J. Mitochondrial reactive oxygen species regulate spatial profile of proinflammatory responses in lung venular capillaries. J Immunol. 2002;169(12):7078–7086.
18. Wang Y, Herrera AH, Li Y, Belani KK, Walcheck B. Regulation of mature ADAM17 by redox agents for L-selectin shedding. J Immunol. 2009; 182(4):2449–2457.
19. Tretter L, Sipos I, Adam-Vizi V. Initiation of neuronal damage by complex I deficiency and oxi-dative stress in Parkinson’s disease. Neurochem Res. 2004;29(3):569–577.
20. Guzy RD, et al. Mitochondrial complex III is required for hypoxia-induced ROS production and cellular oxygen sensing. Cell Metab. 2005;1(6):401–408. 21. O’Malley Y, Fink BD, Ross NC, Prisinzano TE,
Siv-itz WI. Reactive oxygen and targeted antioxidant administration in endothelial cell mitochondria. J Biol Chem. 2006;281(52):39766–39775.
22. Bell EL, et al. The Qo site of the mitochondrial complex III is required for the transduction of hypoxic signaling via reactive oxygen species pro-duction. J Cell Biol. 2007;177(6):1029–1036. 23. Ichimura H, Parthasarathi K, Quadri S, Issekutz
AC, Bhattacharya J. Mechano-oxidative cou-pling by mitochondria induces proinflammatory responses in lung venular capillaries. J Clin Invest. 2003;111(5):691–699.
24. Anderson EJ, et al. Mitochondrial H2O2 emission and cellular redox state link excess fat intake to insulin resistance in both rodents and humans. J Clin Invest. 2009;119(3):573–581.
25. Banfi C, et al. Mitochondrial reactive oxygen spe-cies: a common pathway for PAR1- and PAR2-medi-ated tissue factor induction in human endothelial cells. J Thromb Haemost. 2009;7(1):206–216. 26. Barnes PJ. New molecular targets for the treatment
of neutrophilic diseases. J Allergy Clin Immunol. 2007;119(5):1055–1062.
27. Baluk P, et al. TNF-alpha drives remodeling of blood vessels and lymphatics in sustained airway inflamma-tion in mice. J Clin Invest. 2009;119(10):2954–2964. 28. Islam A, et al. Extracellular TNFR1 release
requires the calcium-dependent formation of a nucleobindin 2-ARTS-1 complex. J Biol Chem. 2006;281(10):6860–6873.
29. Canault M, et al. Microparticles of human ath-erosclerotic plaques enhance the shedding of the tumor necrosis factor-alpha converting enzyme/ ADAM17 substrates, tumor necrosis factor and tumor necrosis factor receptor-1. Am J Pathol. 2007;171(5):1713–1723.
30. Dri P, et al. TNF-Induced shedding of TNF recep-tors in human polymorphonuclear leukocytes: role of the 55-kDa TNF receptor and involvement of a membrane-bound and non-matrix metalloprotein-ase. J Immunol. 2000;165(4):2165–2172. 31. Kuebler WM, Parthasarathi K, Wang PM,
Bhat-tacharya J. A novel signaling mechanism between gas and blood compartments of the lung. J Clin Invest. 2000;105(7):905–913.
32. Tartaglia LA, Weber RF, Figari IS, Reynolds C, Palladino MA Jr, Goeddel DV. The two different receptors for tumor necrosis factor mediate dis-tinct cellular responses. Proc Natl Acad Sci U S A. 1991;88(20):9292–9296.
33. Weskamp G, et al. Pathological neovasculariza-tion is reduced by inactivaneovasculariza-tion of ADAM17 in endothelial cells but not in pericytes. Circ Res. 2010; 106(5):932–940.
34. Hawari FI, et al. Release of full-length 55-kDa TNF receptor 1 in exosome-like vesicles: a mechanism for generation of soluble cytokine receptors. Proc Natl Acad Sci U S A. 2004;101(5):1297–1302. 35. Predescu D, Horvat R, Predescu S, Palade GE.
Transcytosis in the continuous endothelium of the myocardial microvasculature is inhibited by N-ethylmaleimide. Proc Natl Acad Sci U S A. 1994; 91(8):3014–3018.
36. Murphy HS, et al. Superoxide responses of endothelial cells to C5a and TNF-alpha: diver-gent signal transduction pathways. Am J Physiol. 1992;263(1 pt 1):L51–L59.
37. Putney JW Jr, Thomas AP. Calcium signaling: double duty for calcium at the mitochondrial uni-porter. Curr Biol. 2006;16(18):R812–815. 38. Victor VM, Nunez C, D’Ocon P, Taylor CT,
Esplu-gues JV, Moncada S. Regulation of oxygen distribu-tion in tissues by endothelial nitric oxide. Circ Res. 2009;104(10):1178–1183.
39. Rizzuto R, et al. Ca(2+) transfer from the ER to mitochondria: when, how and why. Biochim Biophys Acta. 2009;1787(11):1342–1351.
40. Bodin P, Burnstock G. Increased release of ATP from endothelial cells during acute inflammation. Inflamm Res. 1998;47(8):351–354.
41. Kelso GF, et al. Selective targeting of a redox-active
ubiquinone to mitochondria within cells: anti-oxidant and antiapoptotic properties. J Biol Chem. 2001;276(7):4588–4596.
42. Ma Z, et al. Lipid-mediated delivery of oligonucle-otide to pulmonary endothelium. Am J Respir Cell Mol Biol. 2002;27(2):151–159.
43. Kajikawa M, et al. Ouabain suppresses glucose-induced mitochondrial ATP production and insu-lin release by generating reactive oxygen species in pancreatic islets. Diabetes. 2002;51(8):2522–2529. 44. Bevilacqua MP, Nelson RM, Mannori G, Cecconi
O. Endothelial-leukocyte adhesion molecules in human disease. Annu Rev Med. 1994;45:361–378. 45. Suarez Y, Wang C, Manes TD, Pober JS. Cutting edge:
TNF-induced microRNAs regulate TNF-induced expression of E-selectin and intercellular adhesion molecule-1 on human endothelial cells: feedback con-trol of inflammation. J Immunol. 2010;184(1):21–25. 46. Chen KH, Chang BH, Younan P, Shlykov SG,
San-born BM, Chan L. Increased intracellular calcium transients by calmodulin antagonists differentially modulate tumor necrosis factor-alpha-induced E-selectin and ICAM-1 expression. Atherosclerosis. 2002;165(1):5–13.
47. Dolmetsch RE, Xu K, Lewis RS. Calcium oscilla-tions increase the efficiency and specificity of gene expression. Nature. 1998;392(6679):933–936. 48. Kiefmann R, Islam MN, Lindert J, Parthasarathi K,
Bhattacharya J. Paracrine purinergic signaling deter-mines lung endothelial nitric oxide production. Am J Physiol Lung Cell Mol Physiol. 2009;296(6):L901–L910. 49. Inoue Y, Chen Y, Hirsh MI, Yip L, Junger WG. A3
and P2Y2 receptors control the recruitment of neu-trophils to the lungs in a mouse model of sepsis. Shock. 2008;30(2):173–177.
50. Garton KJ, Gough PJ, Raines EW. Emerging roles for ectodomain shedding in the regulation of inflammatory responses. J Leukoc Biol. 2006; 79(6):1105–1116.
51. Horiuchi K, et al. Cutting edge: TNF-alpha-con-verting enzyme (TACE/ADAM17) inactivation in mouse myeloid cells prevents lethality from endo-toxin shock. J Immunol. 2007;179(5):2686–2689. 52. Myers TJ, et al. Mitochondrial reactive oxygen
species mediate GPCR-induced TACE/ADAM17-dependent transforming growth factor-alpha shed-ding. Mol Biol Cell. 2009;20(24):5236–5249. 53. Zhang Z, et al. Reactive oxygen species mediate
tumor necrosis factor alpha-converting, enzyme-dependent ectodomain shedding induced by phor-bol myristate acetate. FASEB J. 2001;15(2):303–305. 54. Zhang Z, et al. Activation of tumor necrosis
factor-alpha-converting enzyme-mediated ect-odomain shedding by nitric oxide. J Biol Chem. 2000;275(21):15839–15844.
55. Wang Y, Zhang AC, Ni Z, Herrera A, Walcheck B. ADAM17 activity and other mechanisms of soluble L-selectin production during death receptor-induced leukocyte apoptosis. J Immunol. 2010;184(8):4447–4454.
56. D’Alessio A, Al-Lamki RS, Bradley JR, Pober JS. Cave-olae participate in tumor necrosis factor receptor 1 signaling and internalization in a human endothelial cell line. Am J Pathol. 2005;166(4):1273–1282. 57. Waypa GB, et al. Hypoxia triggers subcellular
com-partmental redox signaling in vascular smooth muscle cells. Circ Res. 2010;106(3):526–535. 58. Hanson GT, et al. Investigating mitochondrial
redox potential with redox-sensitive green fluo-rescent protein indicators. J Biol Chem. 2004; 279(13):13044–13053.
59. Szabo C, Zingarelli B, Salzman AL. Role of poly-ADP ribosyltransferase activation in the vascular contractile and energetic failure elicited by exog-enous and endogexog-enous nitric oxide and peroxyni-trite. Circ Res. 1996;78(6):1051–1063.
depletion and oedema formation in the lung. Eur J Anaesthesiol. 2007;24(3):258–266.
61. Parthasarathi K, et al. Connexin 43 mediates spread of Ca2+-dependent proinflammatory responses in lung capillaries. J Clin Invest. 2006;116(8):2193–2200. 62. Kiefmann R, Rifkind JM, Nagababu E,
Bhattacha-rya J. Red blood cells induce hypoxic lung inflam-mation. Blood. 2008;111(10):5205–5214. 63. Kuebler WM, Parthasarathi K, Lindert J,
Bhattacha-rya J. Real-time lung microscopy. J Appl Physiol. 2007;102(3):1255–1264.
64. Lindert J, Perlman CE, Parthasarathi K,
Bhat-tacharya J. Chloride-dependent secretion of alveolar wall liquid determined by optical-sec-tioning microscopy. Am J Respir Cell Mol Biol. 2007; 36(6):688–696.
65. Bai J, Rodriguez AM, Melendez JA, Cederbaum AI. Overexpression of catalase in cytosolic or mitochondrial compartment protects HepG2 cells against oxidative injury. J Biol Chem. 1999; 274(37):26217–26224.
66. Bhattacharya S, et al. High tidal volume venti-lation induces proinflammatory signaling in rat lung endothelium. Am J Respir Cell Mol Biol.
2003;28(2):218–224.
67. Ratner V, Starkov A, Matsiukevich D, Polin RA, Ten VS. Mitochondrial dysfunction contributes to alveolar developmental arrest in hyperoxia-exposed mice. Am J Respir Cell Mol Biol. 2009;40(5):511–518. 68. Zanotti A, Azzone GF. Safranine as membrane
potential probe in rat liver mitochondria. Arch Bio-chem Biophys. 1980;201(1):255–265.