© 2017, IRJET | Impact Factor value: 5.181 | ISO 9001:2008 Certified Journal
| Page
557
Performance measurement of individual manufacturing firm under
fuzzy performance index model
Bhuneshwar Kumar Dixena
1, Raghavendra Singh Kashyap
2M-Tech Scholar
1, Assistant Professor
2Department of Mechanical Engg,
Dr. C.V. Raman University, Kota, Bilaspur, (C.G.), India
---***---Abstract - In last decade, each firm has begun to establishthe production with rapid rate in compensating the high demand of goods with rich-quality of service level. In order to respond these, many firm perceived the necessity to balance the production chain of organization. In the presented research work, a 2nd second level hierarchical Lean-Resilient supply chain module structure has been constructed, where Fuzzy Performance Index model has been applied to assess the overall performance of crank and shaft vendor firm.
Key Words: Benchmarking, L-R (Leanness-Resilient) Supply Chain, Performance Measurement (PM), Fuzzy Performance Index (FPI).
1. INTRODUCTION
Supply Chain Management (SCM) is described as the procedure of planning and executing, and at the same time managing the supply chain by the mainly efficient potential way. Supply chain management involves controlling of finished products from the source of origin the consumption level. The conventional supply chain concerned with two or more firms, which were enabled the connection among the consumers and the vendors. In this conventional technique, therefore the finished products are delivered to the purchasers through a chain of warehouses. SC is a system of business that are involved, through upstream and downstream connection, in the dissimilar procedure and actions, which create worth in the term of goods and services in the hands of the final purchasers.
SCM integrate vendors, goods producers, warehouses and stores, in order that goods / services are produced and distributed to the consumers at right quantity, at right site, at right time, at right price by removing the system wide price while fulfilling the service level requirement of customers. Performance measurement is counted as vital constituent of effective forecast and controlling as well as decision making. It provides essential criticisms or information to expose growth, augment in enthusiasm and identify problems. Performance measurement is consider as a part of methods, metrics, courses and systems , used in firms to explain strategies into tactics, observe implementation, and supply insight to get better
financial and operations. Supply chain management networking is shown in Fig.1.
Fig.1. Supply chain management networking
2. FUZZY SET THEORY:
Prof. Zadeh proposed the concept of fuzzy logic in 1965. Fuzzy logic theory is a control tool and technique, which encompasses the data by allowing partial set membership rather than crisp set membership or non-membership. Fuzzy logic deals with the concept of partial truth, where the truth value may range between completely true and completely false. Fuzzy logic found their application where the valuable information is neither completely true nor completely false, or which are partly true and partly false (Sahu et al., 2015a, b, Sahu et al., 2016c, Sahu et al., 2017b, e).
Fuzzy logic deals with reasoning that is approximate rather than fixed and exact. Compared to traditional binary sets. Fuzzy logic variables may have a truth value that ranges in degree between 0 and 1.
3. RESEARCH OBJECTIVES:
© 2017, IRJET | Impact Factor value: 5.181 | ISO 9001:2008 Certified Journal
| Page
558
Amongst proposed SC philosophies, Lean-Resilient (L-R) strategies of SC worked seminal to solve many problems of firms. Performance measurement is utilized as a tool to quantify overall efficiency cum effectiveness via Lean-Resilient (L-R) assist to reduce the waste and assess the capability of firm against disasters. After literature survey, it is realized that there is need to develop a multi criterion decision making performance appraisement hierarchical module (constituted by mixing the segregated Lean-Resilient L-R 2nd layers of SC measures / drivers and their corresponding interrelated metrics conjunctive with Fuzzy Performance Index model in purpose to estimation the overall performance of individual firm.
4. METHODS:
Considering an L-R, 2nd level appraisement hierarchical module, included criterion at 1st and 2nd level followed below said notations to compute the performances of Choice / Alternative crank manufacturing and shaft manufacturing firms.
i
C
=i
th
1st level assessment index;i
1,2,..., .
m
ij
C
= thj
2nd level assessment index which is underi
th
1st level assessment indexi
C
;j
1,2,..., .
n
The calculated fuzzy rating of individual 1st level assessment criterion-attribute can be computed as (Equa. 7), (Lin et al., 2006, Sahu et al., 2014).
1 1 n ij ij j i n ij jw
U
U
w
………...…….…………(1) Here ijU
represents aggregated fuzzy performance(rating) of core derivers and
ij
w
represent aggregatedfuzzy importance grade with respect to attributes
ij
C
at2nd level. Also,
i
U
represents the calculated fuzzyperformance (rating) of core derivers with respect to the index
i
C
at 1st level. Thus, overall fuzzy performanceindex
U FPI
can be acquired as follows.
1
1 m i i i m i i
w
U
U FPI
w
……….………… (2) Herei
U
rating ofth
i
1st level assessment indexC
i
;i
w
Importance grade ofth
i
1st level assessment indexi
C
.Defuzzifying the fuzzy performance importance index is done in comparing the performance in case of numerical value (may be set by executives of cross functional departments of manufacturing firm).
Also the single numerical value of the fuzzy number
1,
2,
3,
4
~
a
a
a
a
A
based on Center of Area (COA)technique can be articulated by following relation:
3
2 4
1 2 3
3
2 4
1 2 3
1 4
2 1 4 3
1 4
2 1 4 3
2 2 1 1
1 2 3 4 3 4 3 3 2 1 1 2 3 4
( ) ( ) ( ) ( ) ( ) . a a a
a a a
a
a a
a a a
x x dx defuzz A
x dx
x a a x
xdx xdx xdx
a a a a
x a a x
dx dx dx
a a a a
a a a a a a a a
a a a a
……….……….……(3)5. PROPOSED LEAN-RESILIENT (L-R) SUPPLY CHAIN EVALUATION MODEL: EMPIRICAL CASE RESEARCH:
The practical steps for measuring the performance of a crank and shaft manufacturing firm under Lean-Resilient (L-R) supply chain actions are presented.
Step 1: Construction of a cluster of expert’s panel for assessing the overall Lean-Resilient (L-R) performances of supply chain management of crank and shaft manufacturing firm.
Step 2: Evaluation of suitable linguistic scale in terms of appropriateness ratings and importance weight against evaluation criterion.
Step 3: Evaluation of performance ratings as well as weights against criterion associated with module up to 2nd level hierarchy and weight of 1st level hierarchy. Step4: Transform the linguistic variables into generalized trapezoidal fuzzy number set (GTFNs) and then aggregated the assigned linguistic terms (as rating and weights) converts into single responses.
Step 5: Applied fuzzy performance index model to calculate the ratings of 1st level criterion.
© 2017, IRJET | Impact Factor value: 5.181 | ISO 9001:2008 Certified Journal
| Page
559
6. An empirical case research of crank and shaft manufacturing firm:
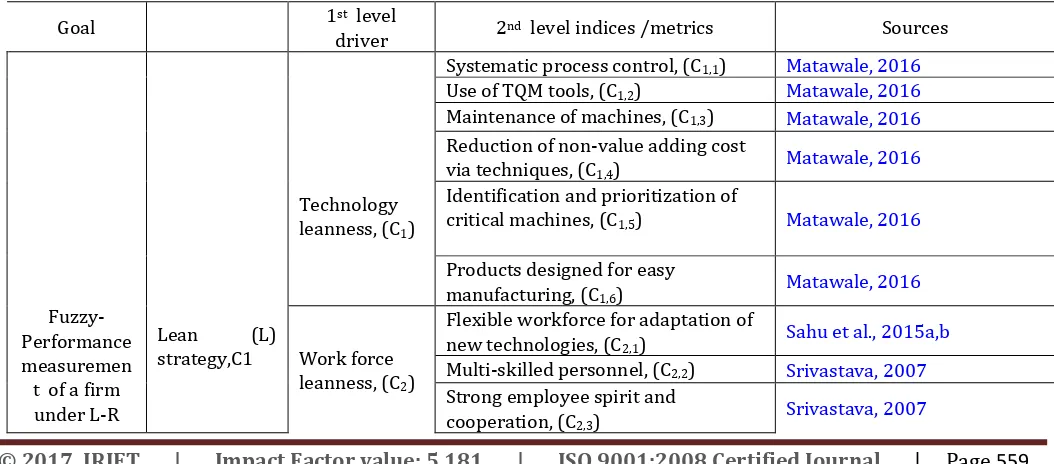
A case research of crank and shaft manufacturing firm is carried out, where Lean-Resilient (L-R) supply chain based appraisement module is constructed in purpose to measure the performance of an crank and shaft manufacturing firm. In the presented work, a decision support system (consist of multi criterion hierarchical module coupled with fuzzy performance index model) is proposed to calculate the performance of said firm under lean-resilient supply chain management strategies. In proposed module, Lean (L) and Resilient (R) has considered as strategy, while Technology leanness, (C1), Work force leanness, (C2), Manufacturing management, (C3), Collaborative planning, (C4), Resiliency, (C5) have counted as 1st level drivers. Apart from that, Systematic process control, (C1,1), Use of TQM tools, (C1,2), Maintenance of machines, (C1,3), Reduction of non-value adding cost via techniques, (C1,4), Identification and prioritization of critical machines, (C1,5), Products designed for easy manufacturing, (C1,6), Flexible workforce for adaptation of new technologies, (C2,1), Multi-skilled personnel, (C2,2), Strong employee spirit and cooperation, (C2,3), Employee empowerment, (C2,4), Improvement culture, (C3,1), JIT delivery to customers, (C3,2), Optimization of processing sequence and flow in shop floor, (C3,3), Overall Manufacturing waste reduction, (C3,4), Material planning, (C4,1), Production planning, (C4,2), Supplier planning, (C4,3), Distributor inventory planning, (C4,4), Effective handling of question and answer, (C5,1), Information discovery, (C5,2), Decision-coordination, (C5,3), Business intelligence, (C5,4) have considered as core drivers.
The multi level hierarchical appraisement module, shown in Table 1. An appropriate linguistic scale is elected, shown in Table 2, which facilitated the experts to state their oral opinions in the terms of priority weight (significances) and appropriateness ratings against evaluation criterion. For computing importance and ratings of criterion, available at different hierarchical levels, a committee of six expert’s panel,
2 1
,
DM
DM
,DM35
4
,
DM
DM
andDM
6 is formed to express priorityweight (significances) and appropriateness ratings in terms of linguistic variables against 2nd level indices, shown in Tables 3-4 for crank and shaft manufacturing firm.
[image:3.595.37.564.548.780.2]Similarly, Expert’s panel (E) expressed their importance in linguistic terms against 1st level criterion for alternative, shown in Tables 5. By using trapezoidal fuzzy operators given by (Arbos 2002), (Beamon 1999), the fuzzy importance and ratings against individual 2nd level criterion for alternative is aggregated, depicted in Table. 6. Next same trapezoidal fuzzy operators given by (Arbos 2002), (Beamon 1999), is used to compute importance against individual 1st level criterion as shown in Table 6. Considering a Lean-Resilient (L-R) supply chain activities 2nd level appraisement hierarchical module, included criterion at 1st and 2nd level, followed, Equation 1 is used to compute the rating performances of 1st level and Equation 2 for computing overall FPI, which computed as (0.508179, 0.639028, 1.085557; 1.356745) for alternative crank and shaft manufacturing firm. The crisp score has computed as 0.90 by exploring (Equ. 3).
Table: 1 L-R SC performance appraisement module
Goal 1driver st level 2nd level indices /metrics Sources
Fuzzy-Performance measuremen
t of a firm under L-R
Lean (L) strategy,C1
Technology leanness, (C1)
Systematic process control, (C1,1) Matawale, 2016 Use of TQM tools, (C1,2) Matawale, 2016 Maintenance of machines, (C1,3) Matawale, 2016 Reduction of non-value adding cost
via techniques, (C1,4) Matawale, 2016 Identification and prioritization of
critical machines, (C1,5) Matawale, 2016
Products designed for easy
manufacturing, (C1,6) Matawale, 2016
Work force leanness, (C2)
Flexible workforce for adaptation of
new technologies, (C2,1) Sahu et al., 2015a,b Multi-skilled personnel, (C2,2) Srivastava, 2007 Strong employee spirit and
© 2017, IRJET | Impact Factor value: 5.181 | ISO 9001:2008 Certified Journal
| Page
560
supply chain,
(C) Employee empowerment, (C2,4) Green et al., 1998
Manufacturing management, (C3)
Improvement culture, (C3,1) Sahu et al., 2016a,b JIT delivery to customers, (C3,2) Sahu et al., 2016a,b Optimization of processing sequence
and flow in shop floor, (C3,3) Sahu et al., 2017a,c,d
Overall Manufacturing waste
reduction, (C3,4) Sahu et al., 2017a,c,d,f,g
Resilient (R) staregy,C2
Collaborative planning, (C4)
Material planning, (C4,1) Sahu et al., 2017a,c,d,f,g Production planning, (C4,2) Green et al., 1998
Supplier planning, (C4,3) Sahu et al., 2017a,b,c,d,e,f,g Distributor inventory planning, (C4,4) Sahu et al., 2017a,b,c,d,e,f,g
Resiliency, (C5)
Effective handling of question and
answer, (C5,1) Sahu et al., 2017a Information discovery, (C5,2) Sahu et al., 2017c
[image:4.595.42.564.71.321.2]Decision-coordination, (C5,3) Kainumaa and Tawara 2006 Business intelligence, (C5,4) Kainumaa and Tawara 2006
Table 2: Nine-member linguistic terms and their corresponding fuzzy representations
Linguistic terms for weights Linguistic terms for performance ratings
Fuzzy representation
DL: Definitely low DL: Definitely low (0.0, 0.0, 0.0, 0.0; 1.0) VL: Very low VL: Very low (0.0, 0.0, 0.02, 0.07; 1.0)
L: Low L: Low (0.04, 0.10, 0.18, 0.23; 1.0)
ML: More or less low ML: More or less low (0.17, 0.22, 0.36, 0.42; 1.0) M: Middle M: Middle (0.32, 0.41, 0.58, 0.65; 1.0) MH: More or less high MH: More or less high (0.58, 0.63, 0.80, 0.86; 1.0)
H: High H: High (0.72, 0.78, 0.92, 0.97; 1.0)
VH: Very high VH: Very high (0.93, 0.98, 1.0, 1.0; 1.0) DH: Definitely high DH: Definitely high (1.0, 1.0, 1.0, 1.0; 1.0)
Table 3: Weights of 2nd level indices assigned by DMs
2nd level indices Weights of 2nd level indices assigned by DMs
DM1 DM2 DM3 DM4 DM5 DM6
C11 H H VH H H VH
C12 MH H H MH H H
C13 H MH MH H MH MH
C14 MH MH MH MH MH MH
C15 MH MH MH MH MH MH
C16 MH MH MH MH MH MH
C21 VH VH DH VH VH DH
C22 H VH DH H VH DH
C23 VH H VH VH H VH
C24 DH H H DH H H
C31 MH H MH MH H MH
C32 H MH H H MH H
C33 MH M MH MH M MH
[image:4.595.51.542.360.512.2]© 2017, IRJET | Impact Factor value: 5.181 | ISO 9001:2008 Certified Journal
| Page
561
C41 H MH ML H MH ML
C42 MH M M MH M M
C43 M MH ML M MH ML
C44 MH MH L MH MH L
C51 L ML L L ML L
C52 VL ML ML VL ML ML
C53 ML L ML ML L ML
C54 DL L L DL L L
Table 4: Rating of 2nd level indices assigned by DMs
2nd level indices Rating of 2nd level indices assigned by DMs
DM1 DM2 DM3 DM4 DM5 DM6
C11 VH H MH VH H MH
C12 H M MH H M MH
C13 M H VH M H VH
C14 VH VH VH VH VH VH
C15 VH VH VH VH VH VH
C16 VH VH VH VH VH VH
C21 H VH VH H VH VH
C22 VH VH H VH VH H
C23 H M NH H M NH
C24 H M MH H M MH
C31 VH H DH VH H DH
C32 VH H DH VH H DH
C33 H VH VH H VH VH
C34 DH VH VH DH VH VH
C41 VH VH H VH VH H
C42 H H DH H H DH
C43 VH M H VH M H
C44 DH M VH DH M VH
C51 H MH H H MH H
C52 VH MH H VH MH H
C53 MH H VH MH H VH
[image:5.595.66.529.232.558.2]C54 MH H DH MH H DH
Table 5: Weights of 1st level drivers assigned by DMs
1st level indices Weights of 1st level indices assigned by DMs
DM1 DM2 DM3 DM4 DM5 DM6
C1 VH DH H VH DH H
C2 H H H H H H
C3 DH VH DH DH VH DH
C4 MH H MH MH H MH
C5 MH M MH MH M MH
Table 6: Aggregated fuzzy importance weights and calculated fuzzy ratings of 1st level drivers
1st level
© 2017, IRJET | Impact Factor value: 5.181 | ISO 9001:2008 Certified Journal
| Page
562
C3 [0.976, 0.993, 1.000, 1.000;1] [0.605, 0.748, 1.223, 1.466;1] C4 [0.626, 0.680, 0.840, 0.896;1] [0.467, 0.624, 1.203, 1.554;1] C5 [0.493, 0.556, 0.726, 0.790;1] [0.229, 0.458, 1.531, 2.986;1]
RESULTS:
The result has shown that evaluated fuzzy performance is (0.508179, 0.639028, 1.085557; 1.356745;1) in term of fuzzy scale and 0.90 in crisp value, can be compared with the actual/standard performance of firm.
Performance can be escalated by enchaining the performance of measures.
CONCLUSIONS:
In the presented work, the constructed multi criterion decision making performance appraisement module (constituted by mixing the segregated the Lean-Resilient (L-R) SC strategy and their corresponding five (5) core drivers and twenty two (22) interrelated metrics) conjunctive with Fuzzy Performance Index model called DSS (Decision Support System) has been practical implemented on crank and shaft manufacturing firm to estimation the overall performance of a organization. The evaluated fuzzy performance is (0.508179, 0.639028, 1.085557; 1.356745; 1) in term of fuzzy scale and 0.90 in crisp value, which can be compared with the actual performance of firm. Performance can be hiked by enchaining the performance of criterion.
REFERENCES:
1. Arbos, L.C. (2002). Design of a rapid response and high efficiency service by lean production principles: Methodology and evaluation of variability of performance. International Journal of Production Economics, 80(2), 169-183.
2. Beamon, B. M. (1999). Designing the green supply chain. Logist. Inform. Manage, 12(4), 332-342.. 3. Greeen, K., Morton, B., & New, S. (1998). Green
purchasing and supply policies: Do they improve companies’ environmental performance. Supply Chain Management, 3(2), 89-95.
4. Huiyu, C., & Weiwei, W. (2010). Green supply chain management for a Chinese auto manufacturer. Department of Technology and Built Environment, university of GAVLE.
5. Kainuma, Y., & Tawara, N. (2006). A multiple attribute utility theory approach to lean and green supply chain management. International Journal of Production Economics, 101(1), 99-108.
6. Lin, C., Chiu, T. H., and Tseng, Y. H. (2006). Agility evaluation using fuzzy logic. Int. J. Prod. Econ, 101(2), 353-368.
7. Matawale, C.R., Datta, S. and Mahapatra, S.S. (2014a). Leanness Estimation Procedural Hierarchy using Interval-Valued Fuzzy Sets
(IVFS), Benchmarking: an International Journal, Vol. 21, No. 2, pp. 150-183, Emerald Group Publishing Limited, UK.
8. Matawale, C.R., Datta, S. and Mahapatra, S.S. (2014b). Lean Metric Evaluation in Fuzzy Environment, International Conference on Computational Intelligence and Advanced Manufacturing Research (ICCIAMR-2013), organized by Department of Mechanical Engineering, VELS University, Chennai-600117. 9. Srivastava, S.K. (2007). Green supply-chain
management: a state-of-the-art literature review. International Journal of Management Review, 9(1), 53-80.
10. Sahu A. K., Sahu, N. K., and Sahu, A. (2014), Appraisal of CNC machine tool by integrated MULTI MOORA-IGVN circumstances: an empirical study’’ International Journal of Grey Systems: Theory and Application (IJGSTA), Emerald, Group Publishing limited, Vol. 4, No.1., pp. 104-123. 11. Sahu, N. K., Sahu A. K., and Sahu, A. K (2015a)
‘’Appraisement and Benchmarking of Third Party Logistic Service Provider by Exploration of Risk Based Approach’’, Cogent business and management, Taylor and Francis, Vol. 2, pp. 1-21 12. Sahu A. K., Sahu, N. K., and Sahu, A. K.
(2015b)‘’Benchmarking CNC machine tool using hybrid fuzzy methodology a multi indices decision making approach”, International Journal of Fuzzy System Applications, Vol. 4, No. 2, pp. 28-46, IGI Global Journal Publishing Limited, USA.
13. Sahu A. K., Sahu, N. K., and Sahu, A. K. (2016a) ‘Application of Integrated TOPSIS in ASC index: Partners Benchmarking perspective’, International Journal: benchmarking, Emerald Group Publishing limited, UK, Vol. 23, No. 3, pp. 540-563.
14. Sahu A. K., Sahu, N. K., and Sahu, A. K. (2016b) Appraisal of Partner Enterprises under GTFNS Environment in Agile SC”, International Journal of Decision Support System Technology (IJDSST), Vol. 8, No. 3, pp. 1-19.
© 2017, IRJET | Impact Factor value: 5.181 | ISO 9001:2008 Certified Journal
| Page
563
Journal of Computer Aided Engineering and Technology (IJCAET), Vol. 8, No. 3, pp.234–259. 16. Sahu A. K., Sahu, A. K. and Sahu, N. K. (2017a),
"Appraisements of material handling system in context of fiscal and environment extent: a comparative grey statistical analysis", International Journal of Logistics Management, Vol. 28 No.1, pp. 2-28.
17. Sahu N. K., Sahu, A. K., and Sahu, A. K. (2017b) ‘Optimization of weld bead geometry of MS plate (Grade: IS 2062) in the context of welding: a comparative analysis of GRA and PCA–Taguchi approaches, Indian Academy of Sciences, Vol. 8, No. 3, pp.234–259.
18. Sahu A. K., Sahu, N. K. and Sahu, A. K. (2017c), Performance Estimation of Firms by GLA Supply Chain under Imperfect Data, Theoretical and Practical Advancements for Fuzzy System Integration, pp. 245-277.
19. Sahu N. K., Sahu, A. K. and Sahu, A. K. (2017d), Fuzzy-AHP: A Boon in 3PL Decision Making Process, Theoretical and Practical Advancements for Fuzzy System Integration, pp. 97-125.
20. Sahu A. K., Sahu, A. K. and Sahu, N. K. (2017e), Benchmarking of Advanced Manufacturing Machines Based on Fuzzy-TOPSIS Method, Theoretical and Practical Advancements for Fuzzy System Integration, pp. 309-350.
21. Sahu A. K., Sahu, N. K. and Sahu, A. K. (2017f), Fuzziness: A Mathematical Tool, Theoretical and Practical Advancements for Fuzzy System Integration, pp. 1-30.
22. Sahu A. K., Sahu, N. K. and Sahu, A. K. (2017g), Appraise the Economic Values of Logistic Handling System under Mixed Information, Theoretical and Practical Advancements for Fuzzy System Integration, pp. 278-308.
23. Zadeh, L.A. (1965) “Fuzzy Sets’’, Information and Control, Vo. 8, pp. 338-353.
BIOGRAPHY
Bhuneshwar Kumar Dixena