© 2017, IRJET | Impact Factor value: 5.181 | ISO 9001:2008 Certified Journal | Page 1726
Study on Performance of simulation analysis on Multimedia Network
Shiferaw Hermela Shimelash
1, Li Yao Hui
2,Fares Mohmmed Mehdi Hassan
31,2
Tianjin University of Technology and Education, School of Applied Computer Technology
Add: 1310 Dagu Nan Road, Hexi District
Tianjin, P.R.China
3
Nanjing Forestry University, School of mechanical and electrical engineering
Add: No.159 Lonpan Road
Nanjing,P,R, China
Abstract
:
On these days, the Internet is used for multimedia applications, such as streaming audio and video to users. There is also great interest in delivering conversational voice to Internet users. As users, will expect the same services to be available on the wireless Internet as they enjoy on the wired Internet, it is important showing that mobility schemes can support multimedia applications. Indeed, it can be argued that for data applications such as web browsing, it is mostly acceptable to re-establish a session when a user moves between networks, as data requests are typically separated by a couple of seconds. However, this is not acceptable in multimedia applications. In this thesis, try to a handover scheme for a simulated voice application is presented based on a modified version of the Stream Control Transmission Protocol (SCTP). Multimedia applications are sensitive to delay, so SCTP was modified to monitor the available networks and to transport data over the network with the lowest delay and learn about on the jitter and latency performance of wired voice over internet protocol (VOIP). The performance of voice communication over wired connections is done using NS-2 simulator.Keywords:VoIP, SCTP, wired LAN, Ns2.
1.
INTRODUCTION
Voices over Internet Protocol (VoIP) allow users to make calls and receive calls by connecting through internet protocols to deliver voice data. The reasons behind growing popularity of VoIP include; low cost, efficient bandwidth, and flexibility over Public Switched Telephone Network (PSTN). VoIP operates by transferring voice signals between IP addresses, which means that those signals have to transform into pieces of data small enough to transmit. Vocals samples from the sender are broken down into voice “packets”, which are given routing information and sent to the receiving end.
The packets transmit one-by-one, and then re-form as close to the original state as possible, creating one whole voice.
This process compresses the voice signal and then decompresses the signal for the receiver.
Wired networks exist between a number of devices connected to each other using connecting media, such as cables and routers. Wired networks can be applied within an area limited by the cables and routers that allow for sending and receiving data.
A communication network topology refers to the schematic representation of switching elements, routers, transmission links and other peripherals. It acts as a layout for a communication network which exists in real time scenario. Network topologies can be classified into two types based on the layouts:
1. Physical network layout 2. Logical network layout
Physical network layout is the actual layout of computer cables, routers, and other network devices. Logical network layout is the way in which network appears to the devices in use. Commonly used topologies are bus, ring, and star. The analysis of a sophisticated network becomes difficult as there is a hectic calculation involved at each and every node spaced at a 100-200 km interval. The next section provide an overview of SCTP (stream control transmission protocol)
2.
SCTP OVERVIEW
© 2017, IRJET | Impact Factor value: 5.181 | ISO 9001:2008 Certified Journal | Page 1727
to manage SS7 applications and services over an IPinfrastructure. SS7 is a protocol suite for managing PSTN and other telecommunication networks. The upper layers of SS7 are designed to operate over a circuit-switched control channel of the industry’s TDM phone system network. Therefore SCTP is oriented towards providing connection oriented reliable message streams between communication endpoints. While SCTP was originally designed for signaling transport and much of the current work on SCTP in the IETF is centered on this application the protocol is capable of broader application [1].
SCTP attempts to enhance the services of UDP and overcomes the limitation of TCP. SCTP is a reliable message-based connection-oriented transport protocol, which according to [1], provides the following services
Acknowledged error-free non-duplicated transfer of user data.
Congestion avoidance behavior,
Sequenced delivery of user message within multiple streams with an option order of arrival delivery of individual user messages.
Data fragmentation to conform to discovered path MTU size,
Optional bundling of multiple user messages into a single SCTP packet,
Network level fault tolerance through support of multihoming at either or both ends of an association, and
Resistance to flooding and masquerade attacks.
Stream Control Transmission Protocol is hybrid of TCP and UDP and it offers features of both these protocols. It is a reliable, message-oriented transport layer protocol compared to TCP and UDP. SCTP is a multiple streams are allowed in each connection. Can be used as the transport protocol for applications where monitoring and detection of loss of session are required. For such applications, the SCTP path/session failure detection mechanisms, especially the heartbeat, will actively monitor the connectivity of the session. SCTP distinguishes different Streams of messages within one SCTP association. This enables a delivery scheme where only the sequence of messages needs to be maintained per stream (partial in-sequence delivery), which reduces unnecessary head-of-line blocking between independent streams of messages.
SCTP operates on two levels:
Within an association, the reliable transfer of datagrams is assured by using a checksum, a sequence number, and a selective retransmission mechanism. Without taking the initial sequence into account, every correctly received data chunk is delivered to a second, independent level.
The second level realizes a flexible delivery mechanism, which is based on the notion of several independent streams of datagrams within an association. Chunks belonging to one or several streams may be bundled and transmitted in one SCTP packet provided they are not longer than the current path MTU. Detection of loss and duplication of data chunks is enabled by numbering all data chunks in the sender with the so-called Transport Sequence Number (TSN).
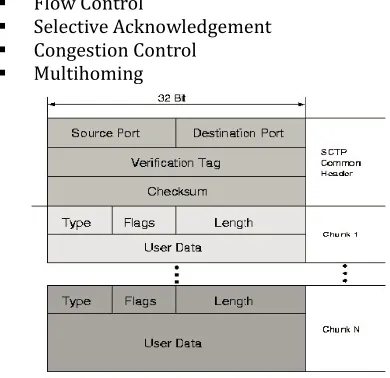
The acknowledgments sent from the receiver to the sender are based on these sequence numbers. Retransmissions are timer-controlled. The timer duration is derived from continuous measurements of the round-trip delay. Whenever such a retransmission timer expires, (and congestion control allows transmissions) all non-acknowledged data chunks are retransmitted and the timer is started again doubling its initial duration (like in TCP). When the receiver detects one or more gaps in the sequence of data chunks, each received SCTP packet is acknowledged by sending a Selective Acknowledgement (SACK), which reports all gaps. The SACK is contained in a specific control chunk. Whenever the sender receives four consecutive SACKs reporting the same data chunk missing, this data chunk is immediately retransmitted (fast retransmit). Some of the key advantages of using SCTP are given below.
Flow Control
Selective Acknowledgement Congestion Control
Multihoming
[image:2.612.344.539.516.705.2]© 2017, IRJET | Impact Factor value: 5.181 | ISO 9001:2008 Certified Journal | Page 1728
SCTP PacketsThe protocol data units (PDU) of SCTP are called SCTP packets. SCTP runs over IP, an SCTP packet forms the payload of an IP packet. An SCTP packet is composed of a common header and chunks. Multiple chunks may be multiplexed into one packet up to the Path-MTU size. A chunk may contain either control information or user data.
3. Implementation, Simulations, Calculations
and Result Simulation with ns-2
The tests will be carried out in NS-2. C++ scripts will be used to parse the resulting simulation trace files, and evaluate the latency, jitter, and packet loss. The test topology includes VoIP clients, sending two-way traffic to each other to simulate normal voice communication. The VoIP traffic is running at the start of the simulation. At a later time, background traffic is being added to evaluate its effects on the VoIP traffic. The background traffic is sent via separated nodes/clients, while only sharing the transmission paths. Of course the SCTP protocol will be used for this scenario:
Fig- 2: VOIP simulation topology
In the implementation, a G.711 codec is used since it is known one. This codec uses a 64kbps bit rate and packet size of 160 bytes. The background traffic is sending at a constant bit rate of 128kbps. The topology setup is shown in Figure 2, with red denoting two-way traffic between the VoIP clients. The green denotes two-way traffic between the background sources. Node 1 & Node 3 is a VoIP traffic and also Node 0 & Node 2is the background. There is two-way traffic for both background and VoIP. The bandwidth limits for the routers (Node 4 & Node 5) is set to the same bitrate as the background traffic with 20 milliseconds. Once the background traffic starts, the links between the
routers are overloaded and the impact on the VoIP application can be seen. The queue build-up exists at the center link, serving as a bandwidth bottleneck.
The simulation of this thesis will be done using the
Network Simulator Ns-2.30 Ns-2 is an open source discrete event simulator used by the research community for research in networking. It has support for both wired and wireless networks and can simulate several network protocols. The standard ns-2 distribution runs on Linux. However, a package for running ns-2 on Cygwin (Linux Emulation for Windows) is available. In this mode, ns-2 runs in the Windows environment on top of Cygwin. Gnuplot be used to graph the resulting data.
Fig -3: basic architecture of NS-2
According to the specific topology on the above
description, the simulation result will be as follows. On the below fig shows the animator or name file (the animation simulation) from the network simulator 2. The four types of color refer different packet moving from source to destination node. Which will help to distinguish which node is communicated to which node?
[image:3.612.336.567.290.401.2] [image:3.612.98.238.394.528.2] [image:3.612.354.548.527.693.2]© 2017, IRJET | Impact Factor value: 5.181 | ISO 9001:2008 Certified Journal | Page 1729
4. AWK Performance Calculations
Latency is a measure of time delay experienced in a system. In simulation, the delay is measured by taking the time difference between when a packet is sent from the source node, and when it reaches its destination. The latency (end-to-end delay) will be measured for each packet sent from a VoIP client and reaches its partner. The
instantaneous latency formula is given as:
Instantaneous Latency = Receive time of destination node – Send time of source node--- (2)
The instantaneous latency can be presented graphically, where the end-to-end delay (in seconds, y-axis) for a specific packet is posted at the time it was received by the destination node (x-axis). The Average Latency is a single value, calculated from the formula given below:
Average Latency = cumulative total of instantaneous latency / simulation runtime--- (3)
The average latency produces a single value which can be easily used to carry out performance comparisons between different scenarios.
Packet Delay Variation (Jitter) Jitter is an informal name for IP packet delay variation (IPDV), but it is often used in electronics and telecommunication. Jitter is the undesired deviation from true periodicity of an assumed periodic signal in computer network. “As an example, say packets are transmitted every 20ms. If the 2nd packet is received 30ms after the 1st packet, IPDV = −10ms. This is referred to as dispersion. If the 2nd packet is received 10ms after the 1st packet, IPDV = +10ms. This is referred to as clumping [5].”
Instantaneous Jitter = Current Latency – Previous Latency --- (4)
Instantaneous Jitter is graphed over the simulation period, and each data point will be mapped to its respective time in the Instantaneous Latency graph. This allows
examination of the stability of the network as the traffic pattern constantly changes throughout the simulation. The average jitter can be calculated as:
Instantaneous Jitter = sum (Current Latency – Previous Latency) / simulation runtime--- (5)
5. Performance Result
[image:4.612.366.538.373.555.2]After the simulation, we find the trace file. The trace file helps as to see the performance of the specific topology and animator. This is the sample of the trace file.
Table -1: Trace file format
Which describe event status r for receive (at to node) + for enqueue, - for dequeue, d for drop.
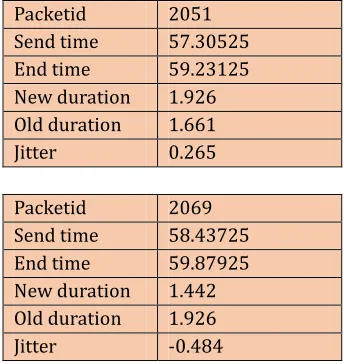
Therefore, using the trace file (.tr) and the awk file we can get the result of the performance on different parameters, but in our case of thesis latency and jitters (Delay variation) are our concern. Those from below are some packet status result.
Packetid 2051 Send time 57.30525 End time 59.23125 New duration 1.926 Old duration 1.661
Jitter 0.265
Packetid 2069 Send time 58.43725 End time 59.87925 New duration 1.442 Old duration 1.926
Jitter -0.484
Table-2: Result of jitter on specific Packet ID
It explains which packet id is sent on which specific sending time and ending time and also calculate the duration so that it give the result of delay variation.
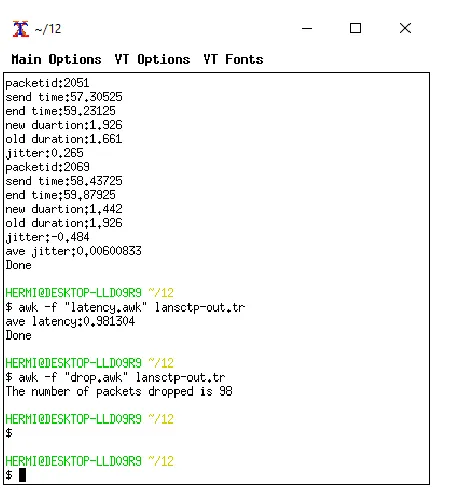
Ave jitter: 0.00600833 the average delay variation.
And finally, we can see the average jitter from all the packets. Not only jitter the packet drop status and the end to end delay result as below.
Ave latency: 0.981304 the average latency result. A number of packets dropped is 98.
EVENT TIME FROME
NODEL PKT TYPE
FLAGS FID ARC
ADDR DST ADDR
SEQ NUM
PKT ID
r 1.0085 1 4 Sctp 56 3 1.0 3.1 -1 5 + 1.0085 4 5 Sctp 56 3 1.0 3.1 -1 5 - 1.0085 4 5 Sctp 56 3 1.0 3.1 -15
© 2017, IRJET | Impact Factor value: 5.181 | ISO 9001:2008 Certified Journal | Page 1730
Fig 5: Result on specific parameters
It's known that the Excessive network latency creates bottlenecks in the network, which lead to as reduction of effective bandwidth. When determining network speed, it is important to use not only a bandwidth calculator but also to run a network latency test. According to the chart below is the performance of the latency with respect to simulation time on the x-axis.
Fig -6: latency (delay) performance using Gnuplot
Since each packet may take a different route to its
destination, network congestion or improper configuration can result in significant variations in packet delay.
[image:5.612.54.283.90.335.2]We can also see the result from the perspective of specific nodes with sctp and cbr delay simulation.
Fig -7: delay performances within 2-10ms simulation times
[image:5.612.326.529.123.279.2]The time delay on transferring the voice packets from the source to the destination result as show the latency result is not greater than 150ms. This will help deterioration of call quality performance.
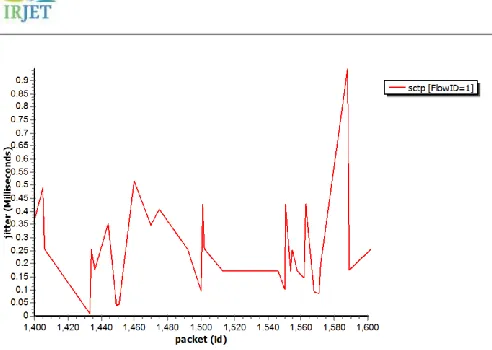
Fig -8: jitter performance on Gnuplot
[image:5.612.325.576.382.578.2] [image:5.612.49.275.462.633.2]© 2017, IRJET | Impact Factor value: 5.181 | ISO 9001:2008 Certified Journal | Page 1731
Fig -9: jitter performances with respect to packetThese explain with the range of 1400 to 1600 packet id deliberation of packets with the y-axis which is jitter in milliseconds. As we can see the jitter performance it’s not more than 0.9ms. Which refer to it’s not that bad
performance.
6. Conclusion and Future work
Network simulation provides a reliable alternative to calculate the performance of a given topology network. The NS2, which is open source simulation software, predicts the performance of the different agent. NS2 checks the functioning of any given network virtually and presents the performance characteristics of the network, which is a better alternative to a tedious calculation of performance characteristics such as end to end delay and average number of packets received at each node, the jitter and how many packets its drop and so on.
In this thesis, It has been designed a four node with the access point and router wired network with TCL script as a front end to the simulator. The TCL script uses compiled C++ hierarchy to achieve efficiency in simulation and faster execution time. After defining the topology using tool command language, agents such as CBR over SCTP are attached to the respective nodes of the network topology. The traffic flow between the nodes allows us to calculate the performance of the network. The latency and jitter of the network have been calculated. Also by using the Gnuplot as we seen the above, I plotted the performance in a graphs form. All these results extending as to think SCTP protocol is also good to use in outside of the world. The Future work will be extending this simulation to future idea by relating with the queuing theory which is queuing delay it could be M/M/1 or M/M/m with n servers or single server, so that studying about the arrival process by calculating the arrival rate, packet delay in queue and so on.
7. References
[1] R.stewart et al. Stream control transsmission protocol.RFC 2960, October 2000.
[2] NS3 doxygen “NS3 Documentation,” https://www.nsnam.org/doxygen/ [Accesses: January 27, 2016]
[3] “Voice Over IP - Per Call Bandwidth Consumption,” Available:http://www.cisco.com/c/en/us/support/do cs/voice/voicequality/7934-bwidth-consume.html [4] [Accessed: January 27, 2016]
[5] Wikipedia. “Packet delay variation,” Available: http://en.wikipedia.org/wiki/Packet_delay_variation [Accessed: January 27, 2016]
[6] Hole, D.P. Tobagi, F.A. "Capacity of an IEEE 802.11b Wireless Lan supporting VoIP," Communications, 2004 IEEE International Conference on, vol.1, no., pp. 196-201
[7] http://forum.wsnlab.org/threads/how-to-install-cygwin-ns2-in-windows.14/
[8] www.isi.edu/nsnam/ns/tutorial/
[9] Salvatore Loreto, Antonio Pescape and Giorgio Ventre "Measuring SCTP Through put and Jitter over Heterogeneous Networks"
[10]PreethiNatarajan, Paul. D. Amer and Randall Stewart "SCTP: An Innovative Transport layer Protocol fortheWeb"
[11]R. Rajamani, S. Kumar, andN. Gupta. "SCTP versus: Comparing the Performance ofTransportprotocols for web traffic".
[12]R. Stewart et al., "Stream Control Transmission Protocol," RFC 4960, IETF, Sep. 2007.