http://dx.doi.org/10.4236/ajps.2015.61011
DNA Barcodes in Fig Cultivars (
Ficus carica
L.) Using ITS Regions of Ribosomal DNA, the
psbA-trnH
Spacer and the
matK
Coding
Sequence
Carlos Castro
1, Alejandro Hernandez
2, Luis Alvarado
2, Dora Flores
2 1Agribiotecnología de Costa Rica S.A., Alajuela, Costa Rica2Instituto Tecnológico de Costa Rica (ITCR), Cartago, Costa Rica
Email: [email protected]
Received 17 December 2014; accepted 30 December 2014; published 13 January 2015
Copyright © 2015 by authors and Scientific Research Publishing Inc.
This work is licensed under the Creative Commons Attribution International License (CC BY). http://creativecommons.org/licenses/by/4.0/
Abstract
Molecular markers provide a useful method for genotype characterization and allow a high preci-sion determination of the genetic relationship between cultivars and varieties. A system based on DNA sequences—which is known as DNA barcoding—will choose one or several standard loci which can be sequenced and compared to differentiate between species. In this research, the ITS,
matK, and trnH-psbA sequences were evaluated for the molecular identification of seven F. carica
genotypes, generating complete sequences for the first two loci, but unable to produce bidirec-tional sequences by using the trnH-psbA sequence. The ITS sequence presented the highest varia-tion rates, while the phylogeny constructed with the matK sequence obtained the highest percen-tage of solved monophyletic groups. Through Pearson’s correlation analysis, it was possible to de-termine the existence of a significant correlation between the ITS region and psbA-trnH, and the
matK and psbA-trnH sequences, but not between ITS and matK. The phylogenies constructed with the ITS + matK barcodes and ITS + matK + psbA-trnH presented the highest percentage for resolu-tion. However, considering the cost efficiency and the facilitated recovery by using PCR, the matK + ITS combination is recommended.
Keywords
Ficus carica, DNA Barcodes, ITS, psbA-trnH, matK
1. Introduction
horti-culture in the Mediterranean basin. It is a known fact that fig was domesticated from a group of various species from the South and East regions of the Mediterranean, possibly in the same time span as cereals were domesti-cated, hence suggesting its cultivation since early Neolithic times [1].
Morphological, physiological, and agronomical performance parameters are frequently used in fig trees in order to establish the descriptors required for the identification of existing genotypes, with the parameters re-lated to leaves and fruits being the most selective. However, these traits are very sensitive and are dependent upon environmental conditions; hence the number of descriptors is limited and in some cases; it does not allow separating the phenotypes in different groups [2] [3].
Presently, different DNA analysis methods have allowed a precise identification of the different genotypes, and they can be classified into three basic types [4]. One of these categories corresponds to methods which are not based on polymerase chain reaction (PCR), where it is possible to find, for example, restriction fragment length polymorphism analysis (RFLP) and the variable number tandem repeats (VNTRs). The second classifica-tion includes techniques that employ arbitrary or semi-arbitrary primers; for instance, multiple arbitrary PCR primers such as (MAAP), RAPD and RAMPO. The third category is the one where a PCR with a specific objec-tive is used, enumerating the microsatellite markers (SSR) and the inter-single sequence repeats (ISSR).
Recently, due to the development of fast, efficient, and accessible technologies for DNA sequencing, a new system based on DNA sequences and used for the identification of living organisms has been developed. Known as “DNA barcoding”, it consists of choosing one or several standard loci that can be sequenced routinely and re-liably, resulting in easily comparable data that allows distinguishing species from one another. The defendants of this initiative establish that DNA barcoding facilitates the identification of species and contributes to the re-newal of biological collections, while it also allows acceleratinge biodiversity inventory [5].
In the Ficus genus, different molecular markers have been used to characterize the germplasm; however, the results are limited in comparison to other plant species [6]. In F. carica,studies report the use nuclear ITS, the trnH-psbA intergenic spacer or the matK sequence as DNA barcodes, for the phylogeny reconstruction in dif-ferent population groups [7] [8].
The aim of this research was to evaluate the use of ITS regions of ribosomal DNA, the psbA-trnH spacer, and the matK sequence as markers for molecular identification through DNA barcoding of different Ficus carica L. accessions present at the Centro de Investigaciónen Biotecnología of InstitutoTecnológico de Costa Rica.
2. Materials and Procedures
2.1. DNA Extraction, Amplification and DNA Sequencing
Total DNA extraction was obtained from young leaf tissue of seven different accessions of F. carica (Table 1), using the “DNeasy plant extraction mini kit” (Qiagen Inc.), according to the protocol suggested by the manu-facturer. The concentration and purity of the DNA was quantified through spectrophotometric analysis, by de-termining the absorbance at 260 nm and 280 nm.
[image:2.595.179.417.603.718.2]The PCR reactions were performed in a final volume of 50 μL, using DreamTaq™ Master Mix 2X (Fermen-tas), 1.5 ng of the primers and 0.5 µL of genomic DNA. Amplification of the ITS region was achieved using the primers 5’-AAGGTTTCCGTAGGTGAAC-3’ and 5’-TATGCTTAAACTCAGCGGG-3’, KIM3F and KIM1R primers for matK, and finally, psbA3’f and trnH primers for the psbA-trnH spacer.
Table 1. F. carica accessions found at the Centro de Investigación en Biotecnología of Instituto Tecnológico de Costa Rica.
Accession Variety or origin
Fc 1 Guarinta
Fc 2 Brown Turkey
Fc 3 Brogiotto Bianco
Fc 4 Colombia
Fc 5 El Salvador
Fc 6 Negro San Juan
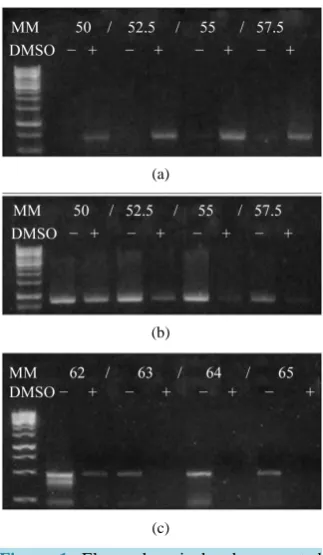
PCR chain reaction was optimized through a temperature gradient trial (∆T) between 50˚C and 57.5˚C, with a gradual temperature increase of 2.5˚C for ITS and matK sequences, and between 62˚C and 65˚C with a 1˚C in-crease for psbA-trnH; using, in all cases, the following thermal profile: [94˚C 2 min, (94˚C for 30 s, ∆T for 30 s, 72˚C for 50 s) × 30 cycles. Furthermore, the effect of adding dimethyl sulfoxide (DMSO) in a final concentra-tion of 5% (v/v), as an adjunct in the PCR reacconcentra-tions, was also assessed.
The sequencing process of the amplified products was obtained by sending 20 μL of each sample to Macro-gen Inc. (USA).
2.2. Editing, Sequence Alignment and Phylogenetic Reconstruction
The DNA sequences were edited using BioEdit program [9], assembled through the CAP3 tool [10], and aligned to their homologous sequences using the EMBL-EBI MUSCLE tool [11]. The multiple alignment file was ana-lyzed with the MEGA v 5.0 software [12] in order to calculate the genetic distance per loci between the acces-sions; according to the number of base pair substitutions between the sequences, eliminating all the positions with missing data, and using Kimura’s 2-parameter model. Additionally, a Pearson’s correlation analysis was performed between the distance matrices from the three loci. The development of a phylogenetic tree was achieved through the maximum likelihood (ML) method with a 500 replicate bootstrap. To estimate the resolu-tion of each DNA barcode, the percentage of monophyletic groups generated was calculated using a bootstrap higher than 50% as a parameter to define the nodes, according to the recommendation provided by Tripathi et al. (2013) [13].
3. Results
3.1. DNA Extraction, Amplification and Sequencing
The Qiagen D Neasyplant extraction mini kit obtained total DNA from the seven fig accessions at an average concentration of 31.70 μg/mL with an average A260/A280 ratio of 1.24. In the optimization of the PCR chain
reaction, the 55˚C temperature allowed the generation of more intense bands for the ITS region and matK se-quence, while for the psbA-trnH sequence, the best results were achieved at 64˚C. Moreover, it was determined that adding 5% (v/v) of DMSO benefited the PCR chain reaction for the ITS region sequence, however, in matK and psbA-trnH it presented an inhibitory effect (Figure 1).
From the analyzed loci, matK presented a longer sequence and psbA-trnH has the shortest one; meanwhile, the highest G-C content was obtained with the ITS and the smallest content with psbA-trnH. In the case of psbA-trnH, there were no bidirectional sequences produced; hence the longest amplified sequence was the one reported (Table 2).
3.2. Editing, Sequence Alignment and Phylogenetic Reconstruction
(a)
(b)
(c)
Figure 1. Electrophoretic bands generated during the optimization of the PCR. ITS (a),
matK (b) and psbA-trnH (c).
Table 2. Size and percentage of G-C content for the ITS region, matK and
psbA-trnH sequences.
Locus Size (pb) GC content (%)
ITS 613 - 618 63.72
matK 892 - 895 33.09
psbA-trnH 267 16.70
Table 3. Efficiency of the DNA barcodes of individual locus and their combinations.
Locus or multilocus Alignment length (pb) Percentage of variable points Average intraspecific distance (K2P) monophyletic groups Percentage of
ITS 613 6.20 0.0188 28.57
matK 892 2.24 0.0109 85.71
psbA-trnH 244 2.87 0.0108 50.00
ITS + matK 1504 3.52 0.0121 100
ITS + psbA-trnH 880 4.43 0.0143 57.14
matK + psbA-trnH 1159 2.50 0.0109 57.14
ITS + matK+ psbA-trnH 1700 3.53 0.0096 100
4. Discussion
4.1. DNA Extraction, Amplification and Sequencing
[image:4.595.232.394.82.360.2] [image:4.595.86.537.516.648.2]tex and endogenous phenols of the fig’s leaf tissue were not totally eliminated with the kit. Regarding this matter, Weiblen (2000) [15] mentions that modifications in extraction procedures have been required in order to obtain DNA of increased purity, due to the presence of latex in F. carica tissue.
The amplified ITS region, with an average of 614 pb, was similar to the one reported by Baraket et al. (2009)
[7], who found ITS regions of 697 pb in 31 fig cultivars. The G-C content in the ITS sequence of the evaluated accessions was of 63.72%, which is comparable to the ones obtained by Baraket et al. (2009) [7], which ranged between 53.1% to 64.1%. Due to the high percentage of G + C content present in the ITS region, its amplifica-tion through PCR was inhibited, since the considerable intermolecular forces formed by the triple hydrogen bonds in the DNA generate structures which are difficult to denature [16]. DMSO interrupts the formation of a secondary structure in the DNA, resulting in a destabilization of the double helix structure, and hence aiding the PCR chain reaction [17]. These results are consistent with those obtained by Razafimandimbison et al. (2004)
[18], who recommended the use of DMSO or BSA along with TMACl in the final PCR chain reaction. Similarly, Kress et al. (2009) [8] mentioned adding a final concentration of 5% DMSO in all the PCR reactions.
The amplified matK sequence of 894 pb was analogous to the one reported by Kress et al. (2009) [8], with an average of 850 pb in a plant community from Panamá, which included samples from the Ficus genus. In contrast to the ITS region, the percentage of the G + C content of this locus was below 40%; which explains the reason why adding DMSO inhibited the PCR chain reaction instead of optimizing it. Even though low recovery per-centages were reported for the sequence, the amplification problems for matK were not due to the sequence composition; but they were rather caused by the efficiency and specificity of the primers used [19] [20]. How-ever, the KIM3F and KIM1R primers were effective for the locus amplification in the varieties of F. carica that were analyzed.
In this study, it was not possible to generate a complete bidirectional sequence for the psbA-trnH sequence, and only 267 pb segment was obtained, which is smaller than the 386 pb sequence amplified by Roy et al. (2010)
[21] for the Ficus genus, and the 488 pb reported for F. carica by Kirin et al. (gb|KC584953.1|; unpublished). The complications in generating bidirectional sequences in this locushave been previously documented by sev-eral research groups. Li et al. (2011) [22] explained that the sequence interruption occurs because of the mono-nucleotide repetitions; meanwhile Fazekas et al. (2008) [23] argue that the problems in producing bidirectional sequences is caused mainly by the presence of homopolymers in the electrophoresis runs.
4.2. Editing, Sequence Alignment and Phylogenetic Reconstruction
The percentage of variable sites and the intraspecific distances of the loci evidenced the presence of polymor-phisms between the analyzed F. carica cultivars, with the ITS region being the locus that presented the most va-riability out of the three loci used. Fu et al. (2011) [24] found similar results when comparing the ITS, rbcL, matK,and trnH-psbAsequences, since the researchers determined that the ITS region showed the highest average genetic distance as well as the number of variable sites. On the other hand, Tripathiet al. (2013) [13] mention that, in an intraspecific level, rbcL and trnH-psbA are the least divergent loci, matching the present research in which psbA-trnH had the lowest average K2P distance value.
In regards to the resolution of the monophyletic groups, the ITS region by its own was the locus with the lowest resolution (25.57%), contrary to the findings of Roy et al. (2010) [21] who reached the best species reso-lution of the Ficus genus with this molecular marker. The existence of a strong, common genetic basis among the accession could be the possible explanation for these results [25]. On the other hand, the matK sequence presented the highest individual resolution percentage (85.71%), followed by psbA-trnH (50%). Even though, in many cases, matK has been considered efficient in differentiating species, there are opposing reports on using trnH-psbA as a locus for DNA barcoding [13].
The individual phylogenies of the three loci presented two main inconsistencies. In the first place, some indi-viduals were grouped together with the ITS sequence, but were then divided in two or more groups when using the plastome sequences; and secondly, the species which were grouped together using the psbA-trnH sequence, were then divided when grouping them with matK, both belonging to the plastid DNA. These scenarios suggest hybridization and introgression between closely related varieties, the existence of shared ancestral polymor-phisms, and/or a different mutation rate between some of the sequences [22].
sequences have different origins from a molecular level viewpoint, and can differ in their application when searching for genetic diversity and establishing the relationship between the genotypes.
The strong and statistically significant correlation observed between ITS and psbA-trnH, as well as with matK and psbA-trnH suggest that the phylogenetic information between these locus pairs is closely related, while no significant correlation between ITS and matK indicate the presence of different evolutionary events between the two regions, allowing each other to complement the distinction between genotypes [7].
The multilocus DNA codes allowed a more clear phylogenetic separation of the fig varieties, and in general, they provided a similar grouping pattern for the accessions, especially when the ITS region was complemented with the information from any of the plastome sequences.
While the greatest K2P distance was observed in the multilocusITS + psbA-trnH,the highest percentage of monophyletic groups was achieved only when the ITS + matK combination was present. Li et al. (2011) [22]
presented similar results when establishing that matK allows greater species differentiation. On the other hand, Fu et al. (2011) [24] reported high monophyly percentages when combining ITS with the matK+ rcbLbarcode.
Additionally the multilocus phylogenetic analysis evidenced the speciation process that the cultivars from Colombia, El Salvador, Negro San Juan and Pacayas have experienced from the traditional varieties of Brown Turkey and Brogiotto Bianco; which is a connection that is not fully evident from the analysis based only on the plastome sequences (Figure 2).
[image:6.595.165.458.422.529.2]When identifying varieties of F. carica, the most efficient DNA barcodes were the matK + ITS and the matK + psbA-trnH + ITS combinations, since they allowed a 100% monophyly differentiation of the species. However, considering cost efficiency and the difficulty in obtaining bidirectional psbA-trnH sequences, the recommenda-tion would be to use a two-sequence multilocus rather than one with three sequences. The reported results are consistent to those gathered by Li et al. (2011) [22], who found a higher species differentiation percentage with the matK + psbA-trnH + ITS multilocus,but recommended the matK + ITS combination based on cost efficiency.
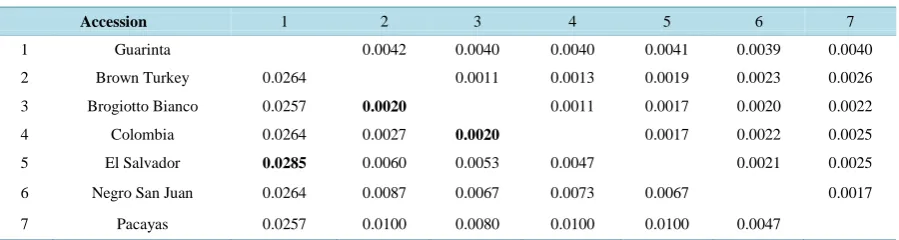
Table 4 shows the genetic distance matrix of the analyzed accessions, using the proposed barcode, while the ITS + matK multiple sequence alignment is found in Appendix 6. The genetic distance of the cultivars ranged between 0.0020 and 0.0285, being the Guarinta accession the one presenting the highest divergence when com-pared to the rest. Related results were obtained by Baraket et al. (2009) [7] who reported that the genetic dis-
[image:6.595.90.540.580.700.2]Figure 2. Phylogeny reconstruction based on the nrITS + matK sequences and using the maximum likelihood (ML).
Table 4. Genetic distance matrix between the F. carica accessions, calculated using Kimura’s 2-parameter model with the ITS + matK barcode*.
Accession 1 2 3 4 5 6 7
1 Guarinta 0.0042 0.0040 0.0040 0.0041 0.0039 0.0040
2 Brown Turkey 0.0264 0.0011 0.0013 0.0019 0.0023 0.0026
3 Brogiotto Bianco 0.0257 0.0020 0.0011 0.0017 0.0020 0.0022
4 Colombia 0.0264 0.0027 0.0020 0.0017 0.0022 0.0025
5 El Salvador 0.0285 0.0060 0.0053 0.0047 0.0021 0.0025
6 Negro San Juan 0.0264 0.0087 0.0067 0.0073 0.0067 0.0017
7 Pacayas 0.0257 0.0100 0.0080 0.0100 0.0100 0.0047
*
tances calculated when comparing the ITS sequences of nine F. carica cultivars from Tunisia ranged from 0.027 to 0.386. Similarly, Baraket et al. (2011) [25] found a genetic distance ranging from 0.004 to 0.170 in 31 F. ca-rica cultivars with the ITS + trnL-trnF multilocus.
5. Conclusion
The gathered data demonstrated that the local fig germplasm was characterized by its genetic diversity. Despite the low genetic variation levels in the F. carica accessions, the multilocus ITS + matK barcode was not only the most reliable and cost efficient alternative for the identification of the cultivars but it also was useful for ex-plaining the phylogenetic relationships in this taxonomic level. Furthermore, the three analyzed locus presented their particular strengths and weaknesses for genotype identification in F. carica at intraspecific taxonomic level, which should be accounted before designating them as universal DNA barcodes for plants.
Acknowledgements
The authors would like to thank the InstitutoTecnológico de Costa Rica and the Fondo Especial para el Finan-ciamiento de la Educación Superior Estatal (FEES), for funding the project.
References
[1] Zohary, D. and Hopf, M. (1993) Domestication of Plants in the Old World. Clarendon Press, Oxford.
[2] Saddoud, O., Salhi-Hannachi, A., Chatti, K., Mars, M., Rhouma, A., Marrakchi, M. and Trifi, M. (2005) Tunisian fig (Ficus carica L.) Genetic Diversity and Cultivar Characterization Using Microsatellite Markers. Fruits, 60, 143-153. http://dx.doi.org/10.1051/fruits:2005018
[3] Guasmi, F., Ferchichi, A., Farés, K. and Touil, L. (2006) Identification and Differentiation of Ficus carica L. Cultivars Using Inter Simple Sequence Repeat Markers. African Journal of Biotechnology, 5, 1370-1374.
[4] Karp, A., Kresovich, S., Bhat, K., Ayad, W. and Hodgkin, T. (1997) Molecular Tools in Plant Genetic Resources Con-servation: A Guide to the Technologies. International Plant Genetic Resources Institute, Roma.
[5] Hollingsworth, P.M., Graham, S.W. and Little, D.P. (2011) Choosing and Using a Plant DNA Barcode. PLoS ONE, 6. http://dx.doi.org/10.1371/journal.pone.0019254
[6] Achtak, H., Oukabli, A., Ater, M., Santoni, S., Kjellberg, F. and Khadari, B. (2009) Microsatellite Markers as Reliable Tools for Fig Cultivar Identification. Journal of the American Society for Horticultural Science, 134, 624-631.
[7] Baraket, G., Saddoud, O., Chatti, K., Mars, M., Marrakchi, M., Trifi, M. and Salhi-Hannachi, A. (2009) Sequence Analysis of the Internal Transcribed Spacers (ITSs) Region of the Nuclear Ribosomal DNA (nrDNA) in Fig Cultivars (Ficus carica L.). Scientia Horticulturae, 120, 34-40. http://dx.doi.org/10.1016/j.scienta.2008.09.013
[8] Kress, W.J., Erickson, D.L., Jones, A.F., Swenson, N.G., Perez, R., Sanjur, O. and Bermingham, E. (2009) Plant DNA Barcodes and a Community Phylogeny of a Tropical Forest Dynamics Plot in Panama. Proceedings of the National Academy of Sciences of the United States of America, 106, 18621-18626. http://dx.doi.org/10.1073/pnas.0909820106
[9] Hall, T.A. (1999) BioEdit: A User-Friendly Biological Sequence Alignment Editor and Analysis Program for Windows 95/98/NT. Nucleic Acids Symposium Series, 41, 95-98.
[10] Huang, X. and Madan, A. (1999) CAP3: A DNA Sequence Assembly Program. Genome Research, 9, 868-877. http://dx.doi.org/10.1101/gr.9.9.868
[11] Edgar, R.C. (2004) MUSCLE: Multiple Sequence Alignment with High Accuracy and High Throughput. Nucleic Acids Research, 32, 1792-1797. http://dx.doi.org/10.1093/nar/gkh340
[12] Tamura, K., Peterson, D., Peterson, N., Stecher, G., Nei, M. and Kumar, S. (2011) MEGA5: Molecular Evolutionary Genetics Analysis Using Maximum Likelihood, Evolutionary Distance, and Maximum Parsimony Methods. Molecular Biology and Evolution, 28, 2731-2739. http://dx.doi.org/10.1093/molbev/msr121
[13] Tripathi, A.M., Tyagi, A., Kumar, A., Singh, A., Singh, S., Chaudhary, L.B. and Roy, S. (2013) The Internal Tran-scribed Spacer (ITS) Region and trnhH-psbA Are Suitable Candidate Loci for DNA Barcoding of Tropical Tree Spe-cies of India. PLoS ONE, 8, e57934. http://dx.doi.org/10.1371/journal.pone.0057934
[14] Glasel, J.A. (1995) Validity of Nucleic Acid Purities Monitored by A260/A280 Absorbance Ratios. Biotechniques, 18, 62-63.
[15] Weiblen, G.D. (2000) Phylogenetic Relationships of Functionally Dioecious Ficus (Moraceae) Based on Ribosomal DNA Sequences and Morphology. American Journal of Botany, 87, 1342-1357. http://dx.doi.org/10.2307/2656726
Gene, 274, 293-298. http://dx.doi.org/10.1016/S0378-1119(01)00621-7
[17] Simon, L.S., Grierson, L.M., Naseer, Z., Bookman, A.A. and Zev-Shainhouse, J. (2009) Efficacy and Safety of Topical Diclofenac Containing Dimethyl Sulfoxide (DMSO) Compared with Those of Topical Placebo, DMSO Vehicle and Oral Diclofenac for Knee Osteoarthritis. Pain, 143, 238-245. http://dx.doi.org/10.1016/j.pain.2009.03.008
[18] Razafimandimbison, S.G., Kellogg, E.A. and Bremer, B. (2004) Recent Origin and Phylogenetic Utility of Divergent ITS Putative Pseudogenes: A Case Study from Naucleeae (Rubiaceae). Systematic Biology, 53, 177-192.
http://dx.doi.org/10.1080/10635150490423278
[19] Kress, W.J. and Erickson, D.L. (2008) A Two-Locus Global DNA Barcode for Land Plants: The Coding rbcL Gene Complements the Non-Coding trnH-psbA Spacer Region. PLoS ONE, 2, e508.
http://dx.doi.org/10.1371/journal.pone.0000508
[20] Lahaye, R., Van der Bank, M., Bogarin, D., Warner, J., Pupulin, F., Gigot, G. and Savolainen, V. (2008) DNA Bar-coding the Floras of Biodiversity Hotspots. Proceedings of the National Academy of Sciences of the United States of America, 105, 2923-2928. http://dx.doi.org/10.1073/pnas.0709936105
[21] Roy, S., Tyagi, A., Shukla, V., Kumar, A., Singh, U.M., Chaudhary, L.B. and Tuli, R. (2010) Universal Plant DNA Barcode Loci May Not Work in Complex Groups: A Case Study with Indian Berberis Species. PLoS ONE, 5, e13674. http://dx.doi.org/10.1371/journal.pone.0013674
[22] Li, D.Z., Gao, L.M., Li, H.T., Wang, H., Ge, X.J., Liu, J.Q. and Duan, G.W. (2011) Comparative Analysis of a Large Dataset Indicates That Internal Transcribed Spacer (ITS) Should Be Incorporated into the Core Barcode for Seed Plants.
Proceedings of the National Academy of Sciences of the United States of America, 108, 19641-19646. http://dx.doi.org/10.1073/pnas.1104551108
[23] Fazekas, A.J., Burgess, K.S., Kesanakurti, P.R., Graham, S.W., Newmaster, S.G., Husband, B.C. and Barrett, S.C. (2008) Multiple Multilocus DNA Barcodes from the Plastid Genome Discriminate Plant Species Equally Well. PLoS ONE, 3, e2802. http://dx.doi.org/10.1371/journal.pone.0002802
[24] Fu, Y.M., Jiang, W.M. and Fu, C.X. (2011) Identification of Species within Tetrastigma (Miq.) Planch. (Vitaceae) Based on DNA Barcoding Techniques. Journal of Systematics and Evolution, 49, 237-245.
http://dx.doi.org/10.1111/j.1759-6831.2011.00126.x
[25] Baraket, G., Abdelkrim, A.B., Mars, M. and Salhi-Hannachi, A. (2011) Cyto-Nuclear Discordance in the Genetic Rela-tionships among Tunisian Fig Cultivars (Ficus carica L.): Evidence from Non Coding trnL-tfnF and ITS Regions of Chloroplast and Ribosomal DNAs. Scientia Horticulturae, 130, 203-210.