© 2017, IRJET | Impact Factor value: 5.181 | ISO 9001:2008 Certified Journal | Page 1
Modeling of Solar PV system under Partial Shading using Particle
Swarm Optimization based MPPT
Ujjwala Rai
11Assistant Professor, Dept. EED, SGSITS College, MP, INDIA
---***---Abstract -
This work presents the effects of changingenvironmental conditions on the solar photovoltaic energy conversion system. Partial shading causes oscillations in output characteristics of the PV (photovoltaic) array and distracts the system to track MPP (maximum power point). In this paper, generalized approximate model of the solar cell is implemented using MATLAB/Simulink software package. In order to track maximum power efficiently from the PV array, evolutionary search technique PSO (particle swarm optimization) algorithm is used. Finally the developed model for PV array is interfaced with DC/DC boost converter using SimPowerSystems tool box to extract stepped up voltage from solar array. The duty cycle of the converter is controlled by the MPPT algorithm and PI (Proportional integral) controller. The PV array model is developed and simulated to produce higher output voltage under partial shading conditions.
Key Words
:
Solar photovoltaic systems, Partialshading, Maximum power point tracking (MPPT), Particle swarm optimization (PSO) algorithm, Boost converter.
1.
INTRODUCTION
Due to the fact that conventional energy resources are in a state of diminution, there is a call for utilizing renewable energy resources to generate electrical energy worldwide. Solar energy is one of the promising natural resource that is used expansively to produce electricity globally using the concept of solar photovoltaic. Solar cell which is made up of P-N junction diode fabricated in a thin layer of semiconductor material is considered as the main fundamental unit for solar photovoltaic energy conversion system [1]. Since, solar cell alone cannot be used for high power generation, hence they are connected in series-parallel configuration to form modules and further these modules are connected as well to make array to get increased voltage. Solar insolation and temperature are the important factors that affect the output characteristics of the PV cell [2]. However, PV array operations suffer complexity in the output P-V characteristics under partial shading situation caused by the clouding, shadows of trees, obstruction of buildings, bird litters on the array and so forth. The total power in such an array is lower than the sum of the individual rated power of each module. When solar cells are connected in series, all the cells carry the same current. Although, a few cells under shade produce
less current, these cells are also forced to carry the same current as the other fully illuminated cells. The shaded cells may get reverse biased, acting as loads, draining power from fully illuminated cells [3]. The PV plants are being built in a fixed series-parallel configuration and each module is set with bypass diodes in anti-parallel. This is used to bypass the single module, when it may reduce the current of the whole photovoltaic array. The bypass diode across the group of cells will begin conducting when shading causes a cell to go far enough into reverse bias. The bypass diode allows current from part and limits the effects of shading to the only neighboring group of cells protected by the same bypass diode. This solution is easily adoptable and allowed to improve the energy production from the whole PV array. The characteristics of an array with bypass diodes differ from that of an array without diodes [3], [4]. Authors in [5] proposed a novel algorithm based on several critical observations made out of the PV characteristics and the behavior of the global and local peaks under partially shaded conditions. The proposed algorithm works in conjunction with a DC/DC converter to track the GP (global peak). In order to accelerate the tracking speed, a feed forward control scheme for operating the DC/DC converter is also proposed.
© 2017, IRJET | Impact Factor value: 5.181 | ISO 9001:2008 Certified Journal | Page 432 then a buck-boost converter is interfaced with the whole
PV array. Reference [9] proposed PSO technique to control several PV arrays with one pair of voltage and current sensors. The multidimensional search based technique is able to detect the global MPP and also compared some other MPP techniques with PSO technique. Reference [10] presented a hybrid algorithm of PSO and Artificial Neural Network (ANN) MPPT algorithm for the detection of global peak among multiple peaks occurs in the PV output characteristics. Reference [11] presented PSO and PSO combined with Incremental conductance algorithm to track MPP, modeling of a PV module along with an innovative procedure to optimize the performance and efficiency of the MPPT algorithm and comparison of SPV (solar photovoltaic) panel output with and without optimization is also presented. Reference [12] presented an extraction of maximum energy from SPV array by optimal selection of array size using PSO technique. The algorithm is tested for different set of input insolation and temperature patterns; analysis of various SPVA configurations with respect to environment parameters by developing a more realistic model using MATLAB M-file has been presented. Reference [13] presented complexity in output characteristics of PV array by analyzing different shading situations. This is done by simulation in MATLAB/Simulink and experimentally on two commercial panels. Reference [14] presented a power electronic circuit oriented model with one diode circuit modeling of PV module. The model is realized using power system block set under MATLAB/Simulink. The developed model is integrated with standard power electronic model of DC/DC boost converter. Reference [17] proposed a novel smart-PID controller for optimal control of DC-DC boost converter used as voltage controller in PV systems has been presented.
2.
SOLAR PV ARRAY MODELING
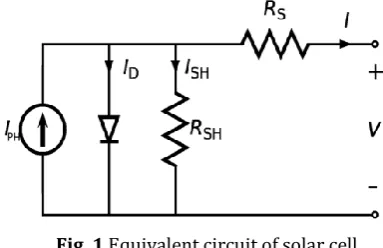
The equivalent circuit of a solar cell contains a current source in parallel with a diode; in practice no solar cell is ideal, so a shunt resistance (RSH) and a series resistance
(RS) component are added to the circuit as shown in Fig. 1.
Fig. 1 Equivalent circuit of solar cell
A PV cell generates less than 2W at 0.5V-0.8V. Therefore, for high power generation, PV cells are connected in series
–parallel to form PV module and array. The value of parallel resistance RSH is generally very large and hence
neglected to simplify the model [1]. The circuit diagram for approximate model is shown in Fig. 2.
Fig. 2 Generalized approximate array model
The generalized PV module can be modeled mathematically by using MATLAB/Simulink software package by the following equations [1], [2].
Module Photocurrent IPH:
IPH = [ISC + 𝜇(Tk − Tref)] * G/1000 (1)
Module Reverse Saturation Current IRS:
𝐼𝑅𝑆= 𝐼𝑆𝐶[(𝑒𝑥𝑝_𝑞𝑉𝑂𝐶/𝑁𝑆𝑘𝐴𝑇𝑘) – 1] (2)
Module Saturation Current IS or diode current:
𝐼𝑆=𝐼𝑅𝑆[𝑇/𝑇𝑟𝑒𝑓]3𝑒𝑥𝑝 [𝑞∗𝐸𝑔𝐴𝑘{1/𝑇𝑟𝑒𝑓−1/𝑇𝑘}] (3)
Module Output Current IPV: The mathematical equation of
output current of PV module for generalized approximate model can be described as:
𝐼𝑃𝑉=𝑁𝑃∗𝐼𝑃𝐻−𝑁𝑝∗I𝑆[𝑒𝑥𝑝{𝑞∗ (𝑉𝑃𝑉+𝐼𝑃𝑉𝑅𝑆)/NSAkT}−1] (4)
Where,
IPH: Light generated current or photocurrent
ISC: Cell’s short-circuit current
𝜇 : Temperature coefficient for ISC
Tk: Actual cell’s temperature in Kelvin
Tref: Reference temperature in Kelvin
G: Solar irradiation (W/m2)
IRS: Cell’s reverse saturation current at a reference
temperature and a solar radiation
A: Ideality factor (1.3) depends on PV technology [1] IPV: Output current
VPV: Output voltage
IS: Cell saturation of dark current
Eg: Bang-gap energy for silicon (1.1eV)
q: Electron charge =1.6 ×10⁻¹⁹ C
k: Boltzmann’s constant = 1.38 ×10⁻²³J/K
[image:2.595.336.540.161.283.2] [image:2.595.65.257.608.732.2]© 2017, IRJET | Impact Factor value: 5.181 | ISO 9001:2008 Certified Journal | Page 433
Table I: Electrical characteristics data of Solkar 36 W PV
module ratings
The electrical specifications are under standard test conditions (STCs) which means an irradiation of 1000 W/m2 with an AM 1.5 spectrum at 25℃.
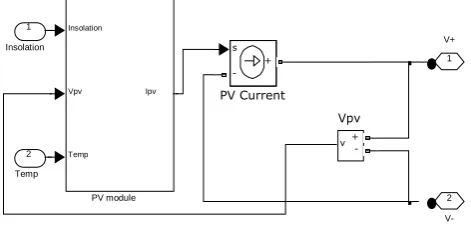
Mathematical modeling for PV module is done by using above four equations which takes solar insolation, temperature and PV output voltage VPV (varies from 0 to
VOC) as inputs and calculates IPV. To interface the
mathematical PV model with the power system toolbox, PV model output current has been fed to a DC controlled current source and the output voltage has been measured then fed back into the voltage input of the PV panel as shown in Fig. 3.
Fig. 3 Interfacing mathematical PV module model to
physical ports
Fig. 4 shows simulation of 2×1 PV array consists of four groups G1A, G1B, G2A, and G2B connected in series. Each one of the groups is connected across one bypass diode in anti-parallel. To study the effect of partial shading, G1A is partially illuminated with 500W/m2 and
other three groups are fully illuminated (receiving 1000 W/m2). When the PV modules are connected in series,
they will conduct the same current but the voltage across them will be different. Fig. 5 and Fig. 6 shows resulting P-V and I-V characteristic curves having multiple peaks and stairs in curves respectively.
III
.PROPOSED MPPT METHOD
To track the maximum power from the output P-V characteristics of the PV array , Particle swarm optimization algorithm is used and further output voltage from PV array used as DC controlled voltage for the DC/DC boost converter.
Fig. 5 P-V characteristic curve for 2×1 PV array
Fig. 6 I-V characteristic curve for 2×1 PV array
A. Particle Swarm Optimization
PSO was originally developed by James Kennedy and Russell C. Eberhart in 1995 [15], it is a population-based evolutionary search algorithm. The principle of PSO is inspired by choreography of fish schooling and bird flocking. Natural creatures sometimes behave as a swarm. The PSO maintains a swarm of particles and each particle represents a potential solution in the swarm. PSO determines the required parameters that maximizes or minimizes the objective function in a given search space. Each individual particle has a current position, a current velocity, and a personal best position in search space. The personal best position 𝑝𝑏𝑒𝑠𝑡𝑖 corresponds to the position
in search space where particle had the largest value as determined by the objective function F, considering a maximization problem. In addition, the position yielding the highest value amongst all the personal best is called the global best position which is denoted by gbest [16]. The following equations (5) and (7) define how the personal and global best values are updated, respectively.
0 5 10 15 20 25 30 35 40 45
0 10 20 30 40 50 60 70
P-V characteristic under partially shaded condition
M
o
d
u
le
P
o
w
e
r
P
p
v
(
W
)
Module Voltage Vpv (V) Peak 1
Peak 2
0 5 10 15 20 25 30 35 40 45
0 0.5 1 1.5 2 2.5 3
I-V characteristic under partially shaded condition
M
o
d
u
le
C
u
rr
e
n
t
Ip
v
(
A
)
Module Voltage Vpv (V)
Rated power 37.08Wp
Voltage at maximum power (Vm) 16.56V
Current at maximum power (Im) 2.25A
Open circuit voltage (VOC) 21.24V
Short circuit current (ISC) 2.55A
Temperature coefficient for ISC (𝜇) 0.0017(A/K)
Number of cells in series (NS) 36
Number of cells in parallel (NP) 1
2
V-1 V+
v+ -Vpv
Insolation
Vpv
Temp
Ipv
PV module
s
-+
PV Current
2
Temp 1
[image:3.595.313.554.296.466.2] [image:3.595.45.281.381.494.2]© 2017, IRJET | Impact Factor value: 5.181 | ISO 9001:2008 Certified Journal | Page 434 After that a loop starts to find the optimal solution. 𝑝𝑏𝑒𝑠𝑡𝑖
is updated as (5) if the condition (6) is fulfilled
𝑝𝑏𝑒𝑠𝑡𝑖=𝑆k𝑖 (5)
𝐹(𝑆k𝑖)>𝐹(𝑝𝑏𝑒𝑠𝑡𝑖) (6)
Where, F is the objective function that should be maximized. On the other hand, the global best position is the best position discovered by any of the particles in the entire swarm.
Gbest = max (𝑝𝑏𝑒𝑠𝑡𝑖) (7)
All particles fly through a multidimensional search space where is adjusting its position according to its own experience and that of neighbors. However, each particle constantly updating a velocity vector based on best solutions found so far by that particle as well as others in the swarm. The velocity and position of the particles will be updated according to equations as follows:
Vki +1=𝜔 Vki +𝑐1𝑟1 (Pki − Vki)+𝑐2𝑟2 (Pkg − Xki) (8)
Xki +1= Vki +1+ Xki (9)
Where,
i= 1, 2, 3…….N, N: no. of particles,
k=1, 2, 3……….𝐼𝑡𝑒𝑟𝑚𝑎𝑥,
𝐼𝑡𝑒𝑟𝑚𝑎𝑥: no. of iterations,
Xki or Ski: current position of particle,
Xki +1 or Ski +1: modified position of particle,
Xki or 𝑝𝑏𝑒𝑠𝑡𝑖: local best position found by particle i, Pkg Or gbest: global best position found by particle group,
Vki: current velocity of particle,
Vki +1: modified velocity of particle, r1, r2: random number between 0 & 1,
c1: cognitive coefficient,
c2: social coefficient, 𝜔: inertia weight.
Inertia weight 𝜔 is set according to the following equation
𝜔=𝜔𝑚𝑎𝑥−(𝜔𝑚𝑎𝑥−𝜔min)/𝐼𝑡𝑒𝑟𝑚𝑎𝑥×𝐼𝑡𝑒𝑟 (10)
Where, 𝜔𝑚𝑎𝑥, 𝜔min are initial, final weights.
B. PSO applied to MPPT
The PSO algorithm explained in the earlier section is now applied to realize the MPPT control of the PV system, wherein the P-V characteristic exhibits multiple local MPP. In order to operate a solar array within its MPP, a MPPT method is needed to track and maintain the peak power,
t
t
Continuous
powergui
Vpv
Workspace Vpv Ppv
Workspace Ppv
Ipv
Workspace Ipv
v +
-Vpv
Vin
s -+
V1
25
Temp
Product
PV Char
i +
-Ipv
0.5
Inso2 1
Inso1
IV char
Insolation
Temp
V3+
V3-G2B 18 cells
Insolation
Temp
V1+
V1-G2A18 cells
Insolation
Temp
V2+
V2-G1B 18 cells
Insolation
Temp
V+
V-G1A 18 cells
D4 D3
D2 D1
Clock
© 2017, IRJET | Impact Factor value: 5.181 | ISO 9001:2008 Certified Journal | Page 435 find the voltage or current on which the solar array
provides the maximum output power. To start the optimization, a solution vector of module voltages (V1, V2
…VD) must be controlled, where, D being the number of
modules. Now, non-linear optimization problem can be stated as
X = (V1, V2, V3…VD); F(X) = Array power PPV
Here, PSO is used to find the optimal voltage VD for which
the objective function F(X) that is array power has a maximum value, each one of the system modules must be controlled in such a way that their terminal voltages are equal to the corresponding MPPT voltages and their magnitude vary between 0 to VOC. The PV array voltage VPV
is constrained to (0.05 VOC<Vi<0.85VOC). Where, VOC is the
[image:5.595.305.567.92.563.2]open circuit voltage of each module and i=1,2,3….D. The code for PSO has been written in MATLAB, the parameters used for PSO program is presented in table II.
Table II: Parameters used for PSO algorithm
PARAMETERS VALUES
No. of particles (N) 10
No. of dimensions (D) 1 or 2
Maximum velocity (Vmax) 2.70
No. of iterations (Itermax) 80
∆P 0.15
c1 1.6
c2 1.2
𝜔 0.9
𝜔 0.4
r1, r2 0<r1,r2<1
The objective function F changes due to varying environmental conditions. Hence, for that condition agents must be reinitialized to search for the new MPP again whenever the following condition is fulfilled.
( )
𝑃 (11)
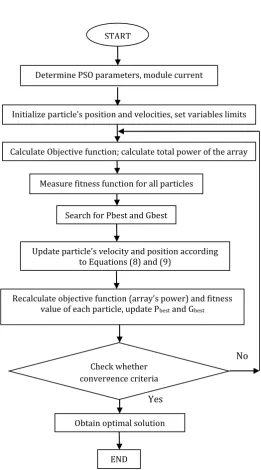
Where, Δ𝑃 denotes the change in power whose value is determined by hit and trial. The flow chart for the proposed PSO algorithm is shown in Fig 7.
IV. SIMULATION
Modeling and simulation of the system has been done in MATLAB/Simulink. It consists of 2×1 PV array, a DC/DC boost converter for which duty cycle is controlled by PSO MPPT technique via PI controller, and a resistive load. Two PV modules are divided into four groups each consists of 18 cells is connected in series. Each group is connected across a bypass diode. Out of the four groups, three are fully illuminated (1 kW/m2) and one group is partially
shaded receiving solar irradiation of 0.5kW/m2. Inputs to
the PV array are solar insolation, temperature and PV
NO No
YES
Yes
Fig. 7 Flow chart for proposed PSO algorithm
voltage. PV array generates PV voltage VPV which acts as a
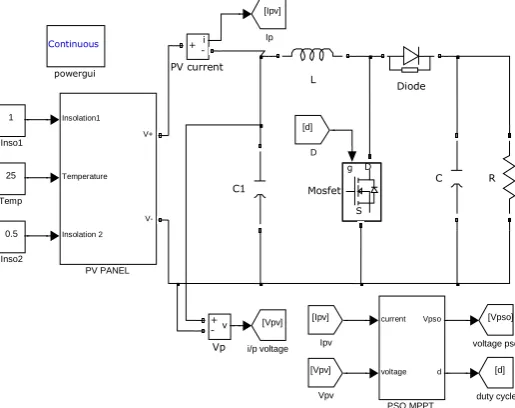
controlled voltage source for boost converter. The DC/DC boost converter consists of MOSFET switch, an inductor L of 120mH, capacitor C2 of 750μF and a load resistance R of
250Ω. Another input filter capacitor C1 of 15μF is
connected across PV array to reduce fluctuations in generated PV voltage. The switch was controlled by a Pulse width modulation (PWM) technique with switching frequency of 20kHz. Inputs to the MPPT block are PV current and voltage. Actual output voltage VPV obtained
from PV panel is compared with the optimal voltage Voptimal
obtained from the PSO based MPPT technique so that solar PV panel works with optimal voltage and maximum power. This error signal from the comparator is then inserted to a PI (Proportional integral) controller. The
Determine PSO parameters, module current
Initialize particle’s position and velocities, set variables limits
Calculate Objective function; calculate total power of the array
Measure fitness function for all particles
Search for Pbest and Gbest
Update particle’s velocity and position according to Equations (8) and (9)
Recalculate objective function (array’s power) and fitness value of each particle, update Pbest and Gbest
Check whether convergence criteria
Obtain optimal solution
[image:5.595.39.279.330.492.2]© 2017, IRJET | Impact Factor value: 5.181 | ISO 9001:2008 Certified Journal | Page 436 output from controller which is the control signal is then
compared with the high frequency signal of 20kHz to generate the PWM signal which is fed as gate signal to the MOSFET switch S. Fig. 8 shows the proposed model. Meanwhile, the values of KP and Ki are determined by hit
and trial method.
Fig. 8 MATLAB/Simulink model for proposed solar PV
energy conversion system
V. RESULTS AND DISCUSSION
Fig. 9 shows the characteristics curve of PSO power obtained with the iterations from the proposed MPPT. The curve is drawn between the FGbest value that is maximum power and the iterations carried out. It is observed from figure that in spite of having multiple peaks in PV output power curve, PSO MPPT easily tracks the maximum power of 58.07W after certain number of iterations.
Fig. 9 Power tracking curve from PSO controller
Fig. 10 (a) shows the output waveforms for PV current, PV voltage and power from the PV array. The output voltage obtained is 25.74V, output current is 2.34A, and output power is 58.05W. Figure 10 (b) shows the output waveforms for output voltage, current and power obtained from boost converter. It is shown from figure that increased output voltage obtained is approximate constant DC voltage of 115.7V which accordingly increase the duty ratio of the converter.
Fig. 10(a) Output waveforms from PV array using PSO
algorithm
Fig. 10(b) Output waveforms from Boost converter
VI. CONCLUSION
Proposed work provides an efficient solar photovoltaic energy conversion system under partial shading
0 10 20 30 40 50 60 70 80 0
10 20 30 40 50 60
No. of Iterations
F
G
b
e
s
t
(P
V
P
o
w
e
r)
(W
)
PSO Power versus Iterations
0 0.5 1 1.5 2 2.5 3
PV ARRAY OUTPUT CURRENT
Ip
v
0 10 20 30 40
PV ARRAY OUTPUT VOLTAGE
V
p
v
0 0.2 0.4 0.6 0.8 1 1.2 1.4 1.6 1.8 2
0 20 40 60 80
PV ARRAY OUTPUT POWER
P
p
v
Time
0 0.2 0.4 0.6 0.8 1
Io
BOOST CONVERTER OUTPUT CURRENT
0 30 60 90 120 150
Vo
BOOST CONVERTER OUTPUT VOLTAGE
0 0.2 0.4 0.6 0.8 1 1.2 1.4 1.6 1.8 2
0 20 40 60 80
Po
Time BOOST CONVERTER OUTPUT POWER
[Vpso]
voltage pso
Continuous
powergui
[Vpv]
i/p voltage
[d]
duty cycle [Vpv]
Vpv
v +
-Vp
25
Temp
R
i +
-PV current
Insolation1
Temperature
Insolation 2 V+
V-PV PANEL
current
voltage Vpso
d
PSO MPPT
g D
S
Mosfet L
[Ipv]
Ipv [Ipv]
Ip
0.5
Inso2 1
Inso1
Diode
[d]
D
[image:6.595.35.293.179.383.2] [image:6.595.313.565.213.683.2] [image:6.595.314.561.216.428.2] [image:6.595.314.561.463.682.2] [image:6.595.40.291.546.732.2]© 2017, IRJET | Impact Factor value: 5.181 | ISO 9001:2008 Certified Journal | Page 437 conditions. Mathematical modeling of solar PV module
using MATLAB/Simulink software package has successfully done. Particle swarm optimization based MPPT is used to track global maximum power from SPVA under partial shading condition. It is concluded that PSO technique is simple, fast and easily adoptable. Outputs obtained concluded that it works efficiently and is able to track correct peak of the power with reliability. Finally, a DC/DC boost converter is interfaced with developed SPVA model, where duty cycle is controlled by PSO MPPT and PI controller. It is observed from output waveforms that PV power remain almost constant and output boost voltage increases. Developed scheme provides an efficient and accurate way to implement high power solar PV array configuration for various loading conditions.
REFERENCES
[1] H.L. Tsai, C.S. Tu, and Y.I. Su, “Development of generalized photovoltaic model using MATLAB/SIMULINK,” Proceedings of the World Congress on Engineering and Computer Science, October 22 - 24, 2008.
[2] S. Said, A. Massoud, M. Benammar and S. Ahmed, “A Matlab/Simulink-based photovoltaic array model employing SimPowerSystems toolbox,” Journal of Energy and Power Engineering, 6, 1965-1975, 2012. [3] H. Patel and V. Agarwal, “MATLAB-based modeling to
study the effects of partial shading on PV array characteristics,” IEEE Transactions on Energy Conversion, 23, 302-310, 2008.
[4] R. Ramaprabha and B. L. Mathur, “A comprehensive review and analysis of solar photovoltaic array configurations under partial shaded conditions,” Hindawi Publishing Corporation International Journal of Photoenergy, vol. 2012, pp. 1-16, February 2012. [5] H. Patel and V. Agarwal, “Maximum power point
tracking scheme for PV systems operating under partially shaded conditions,” IEEE Transactions on Industrial Electronics, vol. 55, no. 4, pp. 1689–1698, 2008.
[6] T.Esram, P. L. Chapman, “Comparison of photovoltaic array maximum power point tracking techniques,”
IEEE Transaction on Energy Conversion, vol. 22, no. 2, pp. 439-449, 2007.
[7] N. A. Ahmed and M. Miyatake, “A novel maximum power point tracking for photovoltaic applications under partially shaded insolation conditions,” Electric Power System Research, vol. 78, no. 5, pp. 777- 784, 2008.
[8] K. Ishaque, Z. Salam, M. Amjad, and S. Mekhilef, “An improved particle swarm optimization (PSO)–based MPPT for PV with reduced steady-state oscillation,”
IEEE Transactions on Power Electronics, vol. 27, no. 8, August 2012.
[9] M. Miyatake, M. Veerachary, F. Toriumi, N. Fujii, H. Ko, “Maximum power point tracking of multiple
photovoltaic arrays: A PSO Approach,” IEEE Transactions on Aerospace and Electronic Systems, vol. 47, no. 1, 2011.
[10] M. Shan Ngan, Chee Wei Tan, “Multiple peaks tracking algorithm using particle swarm optimization incorporated with artificial neural network,” World Academy of Science, Engineering and Technology, vol. 58, October 2011.
[11] Raal Mandour, I. Elamvazuthi, “ Optimization of maximum power point tracking (MPPT) of photovoltaic system using artificial intelligence (AI) algorithms,” Journal of Emerging Trends in Computing and Information Sciences, vol. 4, no. 8, August 2013.
[12] R. Ramaprabha, “Selection of an Optimum Configuration of Solar PV array under partial shaded condition using particle swarm optimization,” World Academy of Science, Engineering and Technology International Journal of Electrical, Electronic Science and Engineering, vol. 8, no. 1, 2014.
[13] Basim A. Alsayid, Samer Y. Alsadi, Ja’far S. Jallad, Muhammad H. Dradi, “Partial shading of PV system simulation with experimental results,” Smart Grid and Renewable Energy, 4, 429-435, September 2013. [14] N. Pandiarajan, R. Ramaprabha, and R. Muthu, “Application of circuit model for photovoltaic energy conversion system,” Hindawi Publishing Corporation International Journal of Photoenergy, vol. 2012, pp. 1-14, November 2011.
[15] J. Kennedy and R. Eberhart, “Particle swarm optimization,” Proceedings of IEEE International Conference on Neural Networks (ICNN’95), vol. 4, pp. 1942–1948, 1995.
[16] X. Li and K. Deb, “Comparing lbest PSO Niching algorithms using different position update rules,” in Proceedings of the IEEE World Congress on Computational Intelligence, Spain, pp. 1564-1571, 2010.