© 2016, IRJET | Impact Factor value: 4.45 | ISO 9001:2008 Certified Journal
| Page 1490
AN IMPROVEMENT IN OUTLIER DETECTION USING SPECTRAL CLUSTERING ALGORITHM FOR
DATA MINING
Upasana Upadhyay
1, Shweta
2,Prateek Saxena
31
M.Tech student at CSE Department, faculty of engineering and technology agra college agra India.
2
M.Tech student at CSE Department, faculty of engineering and technology agra college agra India.
3
Assistant Professor at CSE faculty of engineering and technology agra college agra India
ABSTRACT :Data mining is the extraction of hidden predictive information from large databases and also a powerful new technology with great potential to analyze important information in the data warehouses. Data objects which do not comply with the general behavior or model of the data are called Outliers. Outlier Detection in databases has numerous applications such as fraud detection, customized marketing, and the search for terrorism. However, the use of Outlier Detection for various purposes is not an easy task. In this paper, we propose a technique for detecting outliers in an easier manner using Spectral Hierarchical (Agglomerative) clustering. We analyze our technique to clearly distinguish the numerical data from outliers.
Keywords: Data mining, outlier detection, clustering, Hierarchical clustering, numerical data etc.
I. INTRODUCTION
Outlier is defined as an observation that is inconsistent with the remainder of the set of data. Observations having integrated squared error greater than a threshold are also termed as outliers. Outlier detection has been used in variety of applications in real life ranging from identifying crime detections, fraudulent transactions, network intrusion, stock market, medical data analysis, etc. Outlier detection is also termed as anomaly detection, event detection, novelty detection, deviant discovery, change point detection, intrusion detection, fault detection or misuse detection. The types of outliers can be classified into 3 various classes namely: x Point outliers which deals with multidimensional data types x Contextual outliers based on the dependency-oriented data types such as discrete sequences, time-series, data and graphs. Every instance to a context is defined using the attributes such as Contextual attributes and Behavioral attributes. x Collective outliers states that the individual data instance is not an outlier whereas a collection of related data may
form an outlier A vast number of unsupervised, semi supervised and supervised algorithms are found in the literature for outlier detection.
These algorithms further can be classified to classification-based, clustering-based, nearest neighbor based, density based, information theory based, spectral decomposition based, visualization based, depth based and signal processing based techniques. Outlier detection can be done using uni variety as well as multivariate data in terms of categorical as well as continuous attributes. By univariate data, description such as shape, center, spread and relative position can be found. Using bivariate data, correlation and regression using prediction can be carried out, whereas using multivariate data, multiple regressions can be done. Simple statistical estimates like mean and standard deviation can be affected by spread of the data that are lies away from the middle of the distribution. Previous studies have shown that statistical methods like gaussion and poisson distributions are time consuming in detecting outliers in large dataset.
1. Clustering Approach
The process of grouping physical or abstract objects into classes of similar objects
© 2016, IRJET | Impact Factor value: 4.45 | ISO 9001:2008 Certified Journal
| Page 1491
in the cluster is less than the distance between any objectin the cluster and any object not located inside it.A connected region of a multidimensional space containing a relatively high density of objects. Clustering is a process of partitioning a set of data (or objects) into a set of meaningful sub-classes, called clusters.
II. SYSTEM ARCHITECTURE
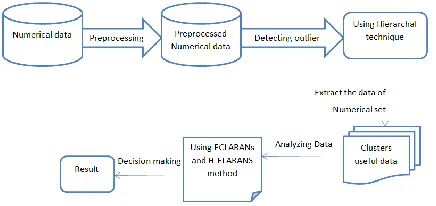
[image:2.612.37.255.440.543.2]As presented in Figure 2., the system architecture which is used for pre-processing the data in the dataset. After cleaning the data, the Hierarchical with statistic equation (which is described in following section) were utilized to detect outliers, remove detected data and extract the desired data to get data of high quality. In the next step, ECLARANS and H-ECLARANS algorithm) were used to make a decision on such data, after analyzing the data to decide on the parameters to be used. The important part of this technique is that the gradient ECLARANS and H-ECLARANS was used to tune the membership function parameters. The proposed system architecture method can be seen in Figure 2.1. The details of the proposed method are described in following sections.
Figure 2 System architecture of the work
DESCRIPTION OF MODULE
No of data points -> The no of data sets is used for process the whole work.
No of clustering -> After performing the data points then get the no. of clustering in result that means how much clustering are created.
Processing with different Threshold -> In this part we have used the Threshold value to check the different no of outlier detection performance.
Dynamic numerical dataset -> Dataset which have been used in this research work is dynamic Numerical data set; it contains 440 data points and 2 attributes. Data stream is an abundant flawless sequence of data and it is not possible to store the complete data stream, due to this reason we divide the data into chunks of same size in different result.
III. PROPOSED DESIGN
In difference to earlier work, an important contribution of
Spectral-Hierarchical clustering (Agglomerative) is the formulation of the clustering problem in a way that is appropriate for very large datasets by making the time and memory constraints explicit. Another contribution is that Hierarchical clustering (Agglomerative) exploits the observation that the data space is usually not uniformly occupied, and hence not every data point is equally important for clustering purposes. So Hierarchical clustering (Agglomerative) treats a dense region of points (or a sub clusters) collectively by storing a compact summarization. Spectral-Hierarchical clustering
(Agglomerative) thereby reduces the problem of
clustering the original data points into one of clustering the set of summaries, which is much smaller than the original dataset. Compared with prior distance-based algorithms, Spectral-Hierarchical clustering
(Agglomerative) is incremental in the sense that
© 2016, IRJET | Impact Factor value: 4.45 | ISO 9001:2008 Certified Journal
| Page 1492
Agglomerative ApproachThis approach is also known as the bottom-up approach. In this, we start with each object forming a separate group. It keeps on merging the objects or groups that are close to one another. It keeps on doing so until all of the groups are merged into one or until the termination condition holds.
Procedure to Improve Quality of Hierarchical Clustering Here are the two approaches that are used to improve the quality of hierarchical clustering –
SPECTRAL CLUSTERING
From our arguments in the preceding section, we consider here a spectral clustering. Suppose that we use the leading
k eigenvectors. Multiple outlier will be clustered together only if their corresponding components in these k
eigenvectors have matching signs. (Note that k
eigenvectors can specify no more than 2k−1 clusters, given that the principal eigenvector always contains non-negative components.) It is expected that the clustering generally gives coarse clustering, since only signs of component values rather than their actual values are used. In practice, clustering is robust against those outlier measurements which may have significant variation. In this case, component values of eigenvectors will have enough variance so their precise values cannot be used. Clustering is a method to address this uncertainty in outlier measurements.
Steps of Agglomerative-spectral clustering procedure
Step 1: Input parameters which are numerical data.
Step 2: Initialize i to 1, and mincost to a large number.
Step 3: Calculating distance between each data points
Step 4: Choose n maximum distance data points
Step 5: Set current to an arbitrary node in n: k
Step 6: Consider a random neighbor S of current, and based on 6, calculate the cost differential of the two nodes.
Step 7: If S has a lower cost, set current to S, and go to Step 4.
Step 8: Otherwise, increment j by 1. If j maxneighbour, go to Step 6.
Step 9: Otherwise, when j > maxneighbour, compare the cost of current with mincost. If the former is less than mincost, set mincost to the cost of current and set best node to current.
Step 10: Increment i by 1. If i > numlocal, output best node and halt. Otherwise, go to Step 4.
Step 11: Perform careful analysis of object linkages at each hierarchical partitioning.
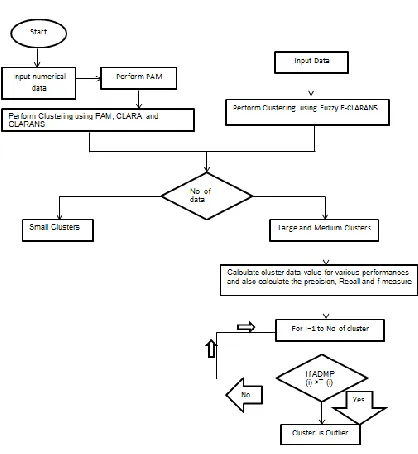
[image:3.612.328.537.408.635.2]Step 12: Integrate hierarchical agglomeration by first using a hierarchical agglomerative algorithm to group objects into micro-clusters, and then performing macro-clustering on the micro-clusters.
© 2016, IRJET | Impact Factor value: 4.45 | ISO 9001:2008 Certified Journal
| Page 1493
STAGE 1. Start the process of proposed Hierarchicalclustering (Agglomerative) –spectral using Numerical
data.
STAGE 2. Pre-processed Numerical data
STAGE 3. Then enter the value of attribute for cluster.
STAGE 4. Detecting outlier Using Hierarchical clustering (Agglomerative) technique
STAGE 5. Extract the Numerical dataset Clusters to make useful data
STAGE 6. Analyzing Data
STAGE 7. Using ECLARANs and Hierarchical clustering
(Agglomerative) –spectral method
STAGE 8. Calculate cluster data value for various performances and also calculate the precision, Recall and f-measure accuracy through its formula
STAGE 9. Cluster is Outliered
STAGE 10. END
The Data mining is the abstraction of hidden analytical information from large databases and also a dominant new technology with great potential to analyse important information in the data warehouses. Data objects which do not comply with the general behaviour or model of the data are called Outliers. Outlier Detection in databases has numerous applications such as fraud detection, customized marketing, and the search for terrorism. However, the use of Outlier Detection for various purposes is not an easy task. In this Thesis, we proposed a technique for detecting outlier clusters in an easier manner using
Hierarchical clustering (Agglomerative) –spectral
clustering as compare with existing PAM, CLARA, ECLARNS technique. We analyse our technique to clearly distinguish the numerical data from outliers that minimize data redundancy with respect to same positioning of data and overlapping terms from existing numerical value
DATASET
Dataset which have been used in this research work is Numerical data set; it contains 500 instances and 2
attributes. Data stream is an abundant flawless sequence of data and it is not possible to store the complete data stream, due to this reason we divide the data into chunks of same size in different result.
Dataset No of Point set
No of sample Dataset Type
Case-1 280 30, 30, 180,40 Randomized data(Dynamic)
Case-2 500 - Static data
Case-3 440 30, 150,30,200,30 Binary data(Static) Case-4 340 40,40,40,40,160 Binary
data(Dynamic) Case-5 350 100,100,150 Randomized
data(Dynamic) Case-6 320 160,40,30,30,30,30 Randomized
data(Static)
Table 1: 6 type of different dataset have own no of sample as with randomized and binary dataset
IV. RSULT ANALYSIS
Above table 1, there have 6 type of different dataset as with different number of point set, each points set assemble with number of samples, that specify the data type such as randomized and binary type data points position for clustering technique i.e. PAM, CLARA, ECLARNS, Agglomerative-spectral refine from the number of sample value to filter the outlier cluster from specific position of dataset by using radius value.
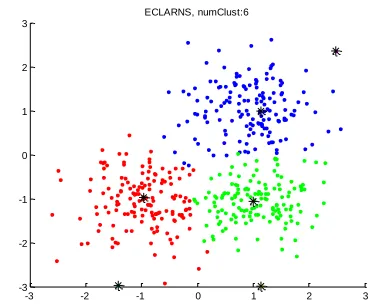
Figure 4.1: Data with number of cluster for 6
-3 -2 -1 0 1 2 3
-3 -2 -1 0 1 2 3
[image:4.612.337.522.535.689.2]© 2016, IRJET | Impact Factor value: 4.45 | ISO 9001:2008 Certified Journal
| Page 1494
We can see in above figure, the no of cluster generated 6using ECLARANS that is creating a big problem for redundancy.
Figure 4.2: Data with number of cluster for 3 using Agglo-ECLARANS
Now in figure 5.2 the no of cluster is 3 that is more sufficient to remove the redundancy.
Thus we can say that our method is more accurate as compare to ECLARANS or other existing technique.
Result of initial phase Outlier detection
Initiate the data # (1-6): 3 Point set #3: 440 points loaded... Number of clusters k: 4
--- iteration # 1 Point set #3: 440 points loaded...
PAM done... 0.888571 seconds Error Rate Value:0.529
CLARA done... 12.420020 seconds Error Rate Value:0.926
PAM: 735 order done - the number of clusters 4 CLARANS done... 0.451579 seconds
Error Rate Value:0.961
ECLARNS done... 0.147774 seconds Error Rate Value:0.208
Agglo_Enhanced_Spectral(pro) done... 0.058794 seconds Error Rate Value:0.501
Elapsed time is 0.086118 seconds. Elapsed time is 0.022895 seconds.
V. CONCLUSION
The goal of the algorithms presented in the paper is to improve the quality of data processing and capture the underlying patterns in the data by reducing the effect of outliers at the preprocessing stage. This outlier may be due to the unavailability or distortions in the data collection stage that consists of irrelevant or weakly relevant data objects. From the algorithms, it is shown that by choosing a valid outlier score, the overall performance of the algorithm can be improved. From the algorithms, it is shown that by choosing a valid outlier score, the overall performance of the algorithm can be improved. The above analysis conducted using the Hierarchical clustering (Agglomerative) shows the cluster-based outlier detection algorithm producing better accuracy than distance based outlier detection method. As we have seen, H-ECLARANS is the best technique amongst them. It takes lesser amount of time to detect the outlier.
FUTURE WORK
As future lies, further advancement is going on in outlier detection methods. More work is being done on the basis of fuzzy approach in clustering techniques. It helps in detection of outlier for imprecise and incomplete data set.
[1] S.Vijayarani , S.Nithya “An Efficient Clustering Algorithm for Outlier Detection” International Journal of Computer Applications (0975 – 8887) Volume 32– No.7, October 2011.
[2] Al-Zoubi, M. (2009) An Effective Clustering-Based Approach for Outlier Detection, European Journal of Scientific Research.
[3] Fujimaki, R., Yairi, T., and Machida, K. 2005. An approach to spacecraft outlier detection problem using kernel feature space. In Proceeding of the eleventh ACM SIGKDD international conference on Knowledge discovery in data mining. ACM Press, New York, NY,
USA, 401-410.
© 2016, IRJET | Impact Factor value: 4.45 | ISO 9001:2008 Certified Journal
| Page 1495
[5] Mendel, J.M., Uncertain rule-based fuzzy logic systems:introduction and new directions. 2000: Prentice Hall.
[6] John Peter.S., Department of computer science and research center St.Xavier‟s College, Palayamkottai, An Efficient Algorithm for Local Outlier Detection Using Minimum Spanning Tree, International Journal of Research and Reviews in Computer Science (IJRRCS), March 2011.
[7] C. Aggarwal, J. Han, J. Wang, P.S. Yu, “A framework for projected clustering of high dimensional data streams”, in Proceedings of the 30th VLDB Conference, Toronto, Canada, pp. 852-863, 2004.
[8] Bakar. Z, A. Mohemad, R .Ahmad, A. & Deris, M. M, “A comparative study for outlier detection techniques in data mining”, IEEE Conf.
Cybernetics and Intelligent Systems, Bangkok, Thailand, pp. 1–6,2006.
[9] D.Barbara, “Requirements for clustering data streams”, ACM SIGKDD, Volume3 Issue 2, Pages 23 27 , January 2002.
[10] D. Hawkins, “Identification of outliers-Monographs on statistics and applied probability”, First edition, pages-188, Springer published in 1980.
[11]Irad Ben-Gal, “Outlier Detection”, Data Mining and Knowledge Discovery Handbook: A Complete Guide for Practitioners and Researchers, Kluwer , Academic Publishers, 2005.
[12] L. O’ Callaghan , “ Clustering data streams theory and practice”, IEEE transactions on knowledge and data engineering, Vol. 15, NO. 3,2003.