www.hydrol-earth-syst-sci.net/20/1561/2016/ doi:10.5194/hess-20-1561-2016
© Author(s) 2016. CC Attribution 3.0 License.
Impacts of land use change and climate variations on
annual inflow into the Miyun Reservoir, Beijing, China
Jiangkun Zheng1,3, Ge Sun2, Wenhong Li3, Xinxiao Yu4, Chi Zhang3, Yuanbo Gong1, and Lihua Tu1
1College of Forestry, Sichuan Agricultural University, Chengdu, Sichuan, 611130, China
2Eastern Forest Environmental Threat Assessment Center, USDA Forest Service, 920 Main Campus, Venture II, Suite 300,
Raleigh, NC 27606, USA
3Earth and Ocean Sciences, Nicholas School of the Environment, Duke University, Durham, NC 27708, USA 4School of Soil and Water Conservation, Beijing Forestry University, Beijing, 100083, China
Correspondence to: Jiangkun Zheng (jiangkunzheng@126.com)
Received: 27 June 2015 – Published in Hydrol. Earth Syst. Sci. Discuss.: 11 August 2015 Revised: 31 January 2016 – Accepted: 4 April 2016 – Published: 22 April 2016
Abstract. The Miyun Reservoir, the only surface water source for Beijing city, has experienced water supply de-cline in recent decades. Previous studies suggest that both land use change and climate contribute to the changes of wa-ter supply in this critical wawa-tershed. However, the specific causes of the decline in the Miyun Reservoir are debatable under a non-stationary climate in the past 4 decades. The central objective of this study was to quantify the separate and collective contributions of land use change and climate variability to the decreasing inflow into the Miyun Reservoir during 1961–2008. Different from previous studies on this watershed, we used a comprehensive approach to quantify the timing of changes in hydrology and associated environ-mental variables using the long-term historical hydromete-orology and remote-sensing-based land use records. To ef-fectively quantify the different impacts of the climate varia-tion and land use change on streamflow during different sub-periods, an annual water balance model (AWB), the climate elasticity model (CEM), and a rainfall–runoff model (RRM) were employed to conduct attribution analysis synthetically. We found a significant (p <0.01) decrease in annual stream-flow, a significant positive trend in annual potential evapo-transpiration (p <0.01), and an insignificant (p >0.1) neg-ative trend in annual precipitation during 1961–2008. We identified two streamflow breakpoints, 1983 and 1999, by the sequential Mann–Kendall test and double-mass curve. Cli-mate variability alone did not explain the decrease in inflow to the Miyun Reservoir. Reduction of water yield was closely related to increase in actual evapotranspiration due to the
ex-pansion of forestland and reduction in cropland and grass-land, and was likely exacerbated by increased water con-sumption for domestic and industrial uses in the basin. The contribution to the observed streamflow decline from land use change fell from 64–92 % during 1984–1999 to 36–58 % during 2000–2008, whereas the contribution from climate variation climbed from 8–36 % during the 1984–1999 to 42– 64 % during 2000–2008. Model uncertainty analysis further demonstrated that climate warming played a dominant role in streamflow reduction in the most recent decade (i.e., 2000s). We conclude that future climate change and variability will further challenge the water supply capacity of the Miyun Reservoir to meet water demand. A comprehensive water-shed management strategy needs to consider the climate vari-ations besides vegetation management in the study basin.
1 Introduction
water yield is of great importance for land use planning and water resource management (Zheng et al., 2013). To opti-mize watershed management, it is important to assess hy-drological impacts of climate variations and land use change separately and collectively (Mango et al., 2011). Artificial neural networks and the Soil Conservation Service curve number were employed to evaluate the effect of land use change on daily streamflows in western Georgia, USA (Isik et al., 2013). The Soil and Water Assessment Tool (SWAT) was also applied to assess impacts of land use and climate change on hydrologic processes in a coastal Alabama water-shed in USA (Wang et al., 2014) and the Hoeya River basin, South Korea (Kim et al., 2013). A clear understanding of the driving factors benefits both hydrological model devel-opment and hydrologic assessment of global change (Wang et al., 2013). Due to the nonlinearity of streamflow response in the synchronous evolution of driving forces, it is challeng-ing to disentangle the integrative effects of climate forcchalleng-ing and basin characteristics (Risbey and Entekhabi, 1996; Be-guería et al., 2003; Arabi et al., 2007; Morán-Tejeda et al., 2010). Many methods have been developed for isolating the effect of land use change from climate variations on regional hydrology. These methods include the paired catchment ap-proach (Brown et al., 2005; Zégre et al., 2010), statistical methods (Costa et al., 2003; Sun et al., 2006; Petchprayoon et al., 2010), and a hydrological model (Haverkamp et al., 2005; Mao and Cherkauer, 2009; Baker and Miller, 2013). Raymond et al. (2008) suggested that land use change and management have been more important than climate varia-tion to increase riverine water export from the Mississippi River over the past 50 years. However, other studies con-sidered climate change as a dominant cause of annual water yield change (Aguado et al., 1992; Christensen et al., 2004; Barnett et al., 2005; Sun et al., 2013). Thus, both land use change and climatic variation should be considered to detect causes of hydrologic change at the same time.
The Miyun Reservoir provides 70 % of the total water sup-ply for Beijing and is the only source of surface water supsup-ply for the severely water-stressed megacity with a population of 20 million (Tang et al., 2011). Over the past half-century, streamflow into the Miyun Reservoir has shrunk drastically. Mean annual inflow into the Miyun Reservoir declined from 88.2 m3s−1in the 1950s to 15.8 m3s−1in the 1980s (Gao et al., 2002). Meanwhile, population in Beijing increased from 2.8 million in 1953 to 20 million in the 2000s (Liu et al., 2003). The local water consumption in the catchment is be-lieved to be the main driving factor in addition to climate (Ma et al., 2010). Now, 18 reservoirs have been built in the catchment with a total storing capacity of 0.214 billion m3 (Li and Li, 2008). The contradiction between increasing wa-ter demand and wawa-ter shortage constrains economic and so-cial development of the region. Therefore, water resource as-sessment is extremely important to develop effective man-agement strategies.
A few studies have tried to isolate hydrological impacts of land use change from climate change on streamflow in the Miyun Reservoir catchment (MYRC) (Wang et al., 2009, 2013; Xu et al., 2009; Ma et al., 2010; Zhan et al., 2011; Bao et al., 2012a). However, conclusions varied significantly. For example, Wang et al. (2009) and Ma et al. (2010) suggested that climate impact separately accounted for about 33 and 55 % of the decrease in reservoir inflow using the distributed time-variant gain model and geomorphology-based hydro-logical model, respectively. The discrepancies are mainly caused by assessment methodology due to parameter uncer-tainty (Shen et al., 2012), diversities of structural complexity (Velázquez et al., 2013), and inconsistencies of the evaluation period (López-Moreno et al., 2011). It remains a grand chal-lenge in watershed hydrology (especially for large basins) to seperate the hydrological effect of land use and from climate change and variability. Hence, Wei et al. (2013) indicate that a combination of two or three methods would be a robust re-search strategy to assess hydrological effect within a certain range.
This study attempts to (1) detect the trend and break points of streamflow series for the period from 1961 to 2008, (2) ex-plore an integrated approach to evaluate phased effects of cli-mate and land use change on the inflow into the Miyun Reser-voir, and (3) provide suggestions to watershed management for the studied watershed.
In this research, the relative contributions of land use change and climate variability to changes of the annual streamflow into the Miyun Reservoir were quantified using an annual water balance model based on Zhang et al. (2001), the climate elasticity model (CEM; Sankarasubramanian et al., 2001), and rainfall–runoff models (RRMs; Jones et al., 2006) for understanding water cycles and balance in the study area. Unlike previous studies that use one evaluation period, this study uses two evaluation periods to assess hy-drological impact of land use change and climate variation over time. Meanwhile, three different hydrological models were combined to assess hydrological effect in each evalua-tion period.
2 Materials and methods 2.1 Catchment characteristic
Figure 1. Information of the Miyun Reservoir catchment and sub-catchments including YZSK (Yunzhoushuiku, 1193 km2), XB (Xiabao, 3960 km2), SDY (Sandaoying, 1536 km2), ZJF (Zhangjiafen, 8762 km2), DG (Dage, 1660 km2), DY (Daiying, 4634 km2), XH (Xiahui, 5891 km2), HH (Huaihe, 486 km2), HMC (Hongmenchuan, 111 km2), BCZ (Banchengzi, 65 km2), and TM (Tumen, 3 km2).
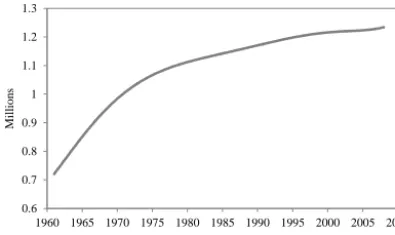
of Hebei Province and three counties of Beijing city. The to-tal landmass of Chicheng, Guyuan, Luanping, and Fengning counties in Hebei Province accounts for 77 % of the whole catchment area (Wang, 2010). The population of the four counties increased from 0.95 million during 1961–1983 to 1.18 million during 1984–1999, and further to 1.23 million during 2000–2008 (Fig. 2). Land use maps were converted from the 1 : 100 000 land use map of China, which was ob-tained from the Resources and Environment Data Center of CAS (http://www.resdc.cn/dataResource/dataResource. asp). Based on data availability and model building, land use maps of sub-catchments were used including Yuz-houshuiku (YZSK), Xiabao (XB), Sandaoying (SDY), Zhangjiafen (ZJF), Dage (DG), Daiying (DY), and Xi-ahui (XH) in 1978, 1988, 1998, and 2008; Huaih (HH), Hongmenchuan (HMC), and Banchengzi (BCZ) in 1990, 1995, 2000, and 2005; and Tumen (TM) in 2000 and 2005 (Fig. 1). The land use was regrouped into six categories: wa-ter, bare land, forestland, cropland, grassland, and residential area.
2.2 Hydrometeorological data
Daily precipitation data recorded at 37 rainfall gauges and daily discharge data of 11 hydrological stations were ob-tained from “Hydrological Year Book” by the China Hy-drological Bureau. Daily meteorological data for the period of 1961–2008 including precipitation, air temperature (max-imum, min(max-imum, and mean), wind speed, relative humidity, and sunshine hours of seven meteorological stations
(Zhang-bei, Fengning, Weichang, Zhangjiakou, Huailai, Chengde, and Beijing) were obtained from the China Administration of Meteorology. DailyEp was calculated using the Hamon
method (Hamon, 1963; Lu et al., 2005) as described in Sect. 2.4.1. All the hydrometeorological data were processed in accordance with international standards. Abnormal data were replaced by the values obtained from kriging interpola-tion using nearby weather stainterpola-tions. Mean hydrometeorolog-ical data for the entire catchment were all obtained by the kriging interpolation method in ArcGIS 9.3.
Average monthly temperatures from November to Febru-ary were below 0◦C. Minimum monthly temperature in Jan-uary was lowest at−15◦, and maximum monthly tempera-ture in July was highest at 29◦. Precipitation (P) in summer (June, July, and August) accounted for 68 % of annual total precipitation. In comparison, summer potential evapotranspi-ration (Ep) accounted for 48 % of annual totals (Fig. 3).
1
0.6 0.7 0.8 0.9 1 1.1 1.2 1.3
1960 1965 1970 1975 1980 1985 1990 1995 2000 2005 2010
Millio
n
s
[image:4.612.310.547.65.235.2]Year
Figure 2. Change in the population of four main counties located in
Hebei Province from 1961 to 2007.
Sk= k
X
i=1
ri(k=2,3, . . ., n), (1)
whereriis as follows:
ri =
+1 xi> xj
(j=1,2, . . ., i) 0 xi ≤xj
. (2)
For each comparison, the number of casesxi> xjis counted and denoted by ri. It is assumed that the statistic sequen-tial values are random and independent. Then statistic vari-ance (UFk) is defined as follows:
UFk=
[sk−E (sk)]
√
Var(sk) (k
=1,2, . . ., n) , (3)
E (sk)=
n(n+1)
4 , (4)
Var(sk)=n(n+1)(2n+5)
72 , (5)
whereE(sk)and Var(sk) are mean and variance ofsk, respec-tively. Statistic variance UFkis calculated as the forward data series (UF1=0). The backward sequence UBk is calculated
using the same equation but in the reverse data series. A null hypothesis is accepted if the critical value (u0.05) lies within
±1.96 at a significance level (α=0.05). The positive UFk denotes an upward trend, while the reverse series denotes a downward trend. When the value of UFk exceeds the critical value (u0.05), it demonstrates an upward or downward trend
significantly. If there are intersections of UFk and UBk lines in the range of critical value (u0.05), the first cross point is the
break point.
2.4 Hydrological models for attribution analysis In this study, climate variations primarily refer to the changes of P andEp. Due to difficulty in quantitatively describing
anthropogenic effects including water withdrawal and water consumption, land use change is used as the residuals af-fecting streamflow (Q) in addition to climate variations fol-lowing Stohlgren et al. (1998) and Ma et al. (2010). Three
1
0 20 40 60 80 100 120 140 160 180
-20 -15 -10 -5 0 5 10 15 20 25 30
Jan. Feb. Mar. Apr. May. Jun. Jul. Aug. Sep. Oct. Nov. Dec.
Air
tem
p
er
atu
re
(
℃
)
Month
P
rec
ip
itatio
n
an
d
p
o
ten
tial
ev
ap
o
tran
sip
iratio
n
(
m
m
m
o
n
th
-1)
Precipitation Potential evapotranspiration
[image:4.612.68.266.67.185.2]Average air temperature Maximum air temperature Minimum air temperature
Figure 3. Monthly average precipitation, potential
evapotranspira-tion, and air temperature during 1961–2008 in the Miyun Reservoir catchment.
models were built to provide a comprehensive evaluation on streamflow decreases in the MYRC.
2.4.1 Annual water balance model (AWB)
To detect the influence of land use change on Q, a model was developed based on the sensitivity of land use change to actual evapotranspiration (Ea) (Zhang et al., 2001). Formulas
were described as follows:
Q=P−AET±1δ, (6)
Ea=
1+ωEPp 1+ωEp
P + P Ep
×P , (7)
Ea(tot)= n
X
i=1
Ea(i)×fi, (8)
Ep=0.1651DVdK Ep=0 whenT <0
, (9)
Vd=216.7Vs/(T+273.3), (10)
Vs=6.108×exp(17.26939T /(T +273.3)), (11)
whereδ(mm yr−1) is the water storage change of the water-shed which can be neglected on long time averages (Dono-hue et al., 2010). On a meso-scale, the watershed annualQ (mm yr−1)can be estimated as the difference between the P (mm yr−1) input and theEa(mm yr−1) output (Sun et al.,
2005).ωis the plant-available water coefficient that varies in soil water use for transpiration. For the MYRC,ω val-ues of different land use, as a key indicator, were estimated by a trial-and-error approach with increments of 0.1 using a computer program.fi is the percentage of land use area, in whichirepresents diverse landscapes: forestland, grassland, cropland, water area, residential area, and bare area.Ea(tot)is the sum ofEa(i).Dis the day length (h).Vdis saturated
the correction factor.T is the daily average temperature (◦).
Vsis the saturated vapor under a certain temperature (mbar).
2.4.2 The climate elasticity model
To quantitatively evaluate the influence of climate variation on streamflow, CEM was built. The CEM defines the pro-portional change of streamflow divided by the propro-portional change in a climate variable such as precipitation (Ma et al., 2010). The model was first developed by Schaake and Wag-goner (1990) to evaluate the sensitivity of streamflow to cli-mate changes and then employed widely to assess the clicli-mate variability impact (Sankarasubramanian et al., 2001; Jones et al., 2006; Fu et al., 2007; Bao et al., 2012b):
Qi
Q0
=ε1
Pi
P
+ε2
PETi PET
1Qi
Q0
=ε1
1Pi
P
+ε2
1Ep(i)
Ep
, (12)
dQclim=QeQ0, (13)
dQland=OeQe, (14)
dQtot=dQclim+dQland, (15)
whereε1andε2are elasticity coefficients forP (mm yr−1)
and Eo (mm yr−1), respectively, which are estimated by
least-square estimation with Matlab7.0. Q0 (mm yr−1), P
(mm yr−1), andEp(mm yr−1) refer to the mean annualQ,P,
andEpin the reference period, respectively.1Piand1Ep(i) are the change of annual P andEpcompared toP andEp,
respectively. Annual Q(mm yr−1) for the period of 1984– 1999 and 2000–2008 can be derived from Eq. (12) and cal-culated into mean value (Qe).dQclimis the average change
inQcaused by climate impact.dQlandis the average change
in Qcaused by land use change, anddQtot is the average
change inQbetween the reference period and evaluation pe-riod.OeandQeare the average annualQobserved and
sim-ulated during the evaluation periods, respectively. 2.4.3 Rainfall–runoff model
In addition to the CEM method discussed in SEct. 2.4.2, the impact of climate variability on streamflow was also esti-mated using the following empirical rainfall–runoff models (Jones et al., 2006; Li et al., 2007).
Qi=a+bPi
σi2c (16)
dQclim=QeQr (17)
Here, Qi (mm yr−1)andPi (mm yr−1) are the annual ob-served streamflow and precipitation, respectively. σi2is the variance of the monthly precipitation; a,b, andc are con-stants determined by hydrometeorological data in the refer-ence period. Qe (mm yr−1) andQr(mm yr−1) are the
sim-ulated mean annual streamflow during the evaluation period and reference period, respectively.
1 Q = -0.96 Year + 1954
R² = 0.22 p < 0.01 P = -0.45 Year + 1328.2
R² = 0.01 p > 0.1 Ep = 1.25 Year - 1622.2
R² = 0.40 p < 0.01
0 100 200 300 400 500 600 700 800 900 1000
1960 1965 1970 1975 1980 1985 1990 1995 2000 2005 2010
An
n
u
al
str
ea
m
flo
w
,
p
rec
ip
itatio
n
an
d
p
o
ten
tial
ev
ap
o
tr
an
sp
ir
atio
n
(
m
m
y
r
-1)
Year
[image:5.612.311.544.69.295.2]Streamflow Precipitation Potential evapotranspiration
Figure 4. Evolution of streamflow (Q), precipitation (P), and po-tential evapotranspiration (Ep) of the Miyun Reservoir catchment
over 1961–2008. The dashed lines are the fitted linear trend for vari-ables.
3 Results
3.1 Evolution and break points of annual streamflow series
As described in Fig. 4, a significant decreasing trend at the rate of 0.96 mm yr−1 was observed for annual streamflow during 1961–2008 (p <0.01). Simultaneously,Epincreased
Further-1
-5 -4 -3 -2 -1 0 1 2 3 4
1960 1965 1970 1975 1980 1985 1990 1995 2000 2005 2010
UF
k
-UB
k
[image:6.612.324.525.66.222.2]Years
Figure 5. The sequential Mann–Kendall test for annual streamflow
in the Miyun Reservoir catchment with forward-trend UFk (solid
line) and backward-trend UBk(dotted line). Dashed bold horizontal lines represent critical values at the 95 % confidence level.
more, the double-mass curve was also used to divide annual streamflow series into three phases (Fig. 6). Combining se-quential Mann–Kendall test analysis with the double-mass curve test, we determined the reference period (1961–1983), the evaluation period I (1984–1999), and the evaluation pe-riod II (2000–2008) in the MYRC.
3.2 AWB model
A total of 41 sub-catchments with different land use com-position were used to build the model. According to plant-available water coefficient w of different land use in the AWB model, the catchments were composed of forestland, grassland/cropland, water area, and residential/bare area. Forestland accounts for more than 50 % of the whole area in the DG, DY, XH, YZSK, SDY, XB, and ZJF catchments; more than 80 % of the total landmass in the BCZ, HMC, and HH watersheds; and 100 % of total area in the TM catch-ment (Fig. 7). The model was calibrated with the data prior to 2001 and was validated with the data after 2001 (Fig. 8). The range ofwvalues was determined to be [0, 3] for forest-land, [0, 2] for grassland/cropforest-land, and [0, 1] for residen-tial area/bare area. TheEaof water area was assumed to be
smaller betweenP andEp. Based on the method of trial and
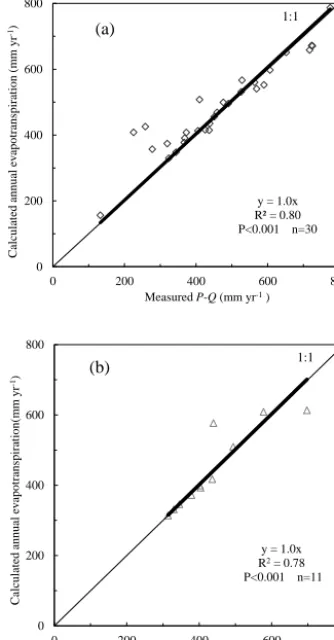
error, w values of grassland/farmland, forestland, and resi-dential area/bare area were identified as 1.5, 2.8, and 0 dur-ing the calibrated period, respectively. When the average an-nual water balance residualEa=P−Qwas compared with
that estimated using Eqs. (7) and (8), the determination coef-ficients were 0.803 and 0.783 during calibration period and validation period, respectively (Fig. 8).
Compared to the reference period (1961–1983), annual observed streamflow for 1984–1999 and 2000–2008 reduced by 18.1 and 39.7 mm, respectively. Using the land use data in 1988, the model was applied to evaluation periods. The difference of observed value and simulated value represented the impacts of land use change on inflow declines. As shown in Table 1, dQland was−11.5 and −19.6 mm, which con-tributed 64 and 49 % ofdQtotfor evaluation period I and II, respectively.
1
◇ 1961-1983 y = 0.14 x - 24.679
× 1984-1999 y = 0.10 x + 377.68 Δ 2000-2008
y = 0.05 x + 1179.7
0 500 1000 1500 2000 2500
0 5000 10000 15000 20000 25000
C
u
m
u
lativ
e
str
ea
m
flo
w
(
m
m
)
Cumulative precipitation (mm)
Figure 6. The double-mass curve showing the relations between
cumulative streamflow and cumulative precipitation for the Miyun Reservoir catchment (1961–2008).
1
0 10 20 30 40 50 60 70 80 90 100
DG1978 DG1988 DG1998 DG2008DY1978 DY1988 DY1998 DY2008 XH1978 XH1988 XH1998 XH2008XB1978 XB1988 XB1998 XB2008 SDY1978 SDY1988 SDY2008 YZSK1978 YZSK1988 YZSK1998 YZSK2008ZJF1978 ZJF1988 ZJF1998 ZJF2008 BCZ1990 BCZ1995 BCZ2000 BCZ2005 HMC1990 HMC1995 HMC2000 HMC2005HH1990 HH1995 HH2000 HH2005 TM2000 TM2005
Persentage of land use area (%)
W
ater
sh
ed
s
in
d
if
fer
en
t
y
ea
rs
[image:6.612.50.286.67.167.2]Grassland/cropland Water area Forestland Residential/bare area
Figure 7. Land use composition of watersheds in different year
used for annual water balance model building. For example, DG1978 refers to the Dage watershed in 1978. Data prior to 2001 were used for the model calibration. Data after 2001 were used for the model validation.
3.3 CEM model
Based on Eq. (12) and data in the period of 1961–1983,ε1
andε2 were separately set as 2.12 and−2.25 by the
[image:6.612.309.545.281.513.2]y = 1.0x R² = 0.80 P<0.001 n=30
0 200 400 600 800
0 200 400 600 800
C al cul at ed annua l ev apot rans pi ra ti on (m m y r -1)
Measured P-Q (mm yr-1 )
(a) 1:1
y = 1.0x R2 = 0.78 P<0.001 n=11
0 200 400 600 800
0 200 400 600 800
C al cul at ed annua l ev apot rans pi ra ti on( m m y r -1)
Measured P-Q (mm yr-1 )
[image:7.612.82.249.71.391.2](b) 1:1
Figure 8. Scatterplots of calculated evapotranspiration using
Eqs. (7) and (8) againstEa=P−Qduring the calibration phase (a)
and validation period (b). The thin line is the 1 : 1 line, and the bold line is the line of best fit provided by the equation.
2000–2008, respectively. The contribution of climate vari-ation to the decrease of inflow during these two periods is about 1.5 mm (8 %) and 16.5 mm (42 %), respectively. Cor-respondingly, land use change contributed 16.6 mm (92 %) and 23.2 mm (58 %) to the decrease of inflow (Table 1). 3.4 RRM model
Using annualP and the variance of the monthlyP from 1961 to 1983, the values of a, b, and c were obtained as 0.85, 0.0004, and 0.74 from Eq. (16), respectively. Then annual inflow into the reservoir was simulated as 56.4 and 33.8 mm for evaluation period I and II, respectively. Derived from Eq. (17), climate variation constituted 2.7 mm (15 %) and 25.3 mm (64 %) of total Q decrease for these two periods (Table 1). Compared to estimations from the CEM model, the contribution of climate variations to the decrease of in-flow was about 7 % higher during the period of 1984–1999, but 22 % lower during the period of 2000–2008.
4 Discussion
4.1 Data limitation and likely impact of other human factors on streamflow
This study spans multiple years and uses multiple data sources for land use, meteorology, and hydrology. Data bias often exists in field measurements, inventory, aggrega-tion, and spatial analysis of long-series spatiotemporal data (Kavetski et al., 2006; Verburg et al., 2011). In the process of building the annual water balance model, 30 land use sce-narios were utilized to calibrate the model and 11 land use scenarios were employed to verify it. To some extent, land use images were not comparable because the data were inter-preted from different days of a year. Meanwhile, interpreta-tion of remote-sensing imagery also increases the possibility of the errors. Only 37 rainfall gauges and 7 meteorological stations were available to clarify spatial change of precipita-tion and air temperature for a mountainous catchment with a drainage area of 15 380 km2; thus interpolation errors may exist
Since the 1980s, water uses in the MYRC have been in-tensified due to the increased water demand by people (Bao et al., 2012a). On one hand, due to the growth of population (Fig. 2) and development of industry and agriculture, the an-nual direct water withdrawal from the MYRC increased from 2.2 mm yr−1 in 1956–1983 to 13.4 mm yr−1 in 1984–2005 (Ma et al., 2010). At the same time, daily water consump-tion per capita accrued from 0.03 m3 in 1959 to more than 0.20 m3in 2000 (Gao et al., 2002). Population growth aggra-vates water scarcity because it reduces per capita availability even with unchanged water resources (Schewe et al., 2014). Meanwhile, soil and water conservation projects have been implemented considerably with slopes transformed into ter-races, and the construction of silt retention dams and reser-voirs in the 1970s and 1980s (Chaobai River Management Bureau of Beijing, 2004; Chang et al., 2015). For exam-ple, the Yunzhou Reservoir (113.7 million m3) and Baihebao Reservoir (90.6 million m3) were built in 1970 and 1983, re-spectively (Hydrological yearbook of the people’s Republic of China, 1991). In addition to water consumption, these wa-ter control projects enhanced evaporation and leakage losses from the catchment (Gao et al., 2013). Consequently, total water loss from the catchment had increased since the 1980s. In recent years, the Paddy to Dry Land Project and programs of closing water-based industries have been carried out to re-duce water consumption that might have compensated the streamflow decline trend and have improved water quality (Wang, 2010).
4.2 Model uncertainties
Three different approaches were used to isolate hydrologi-cal impacts of land use change from those of climate change. The AWB offered a direct approach to evaluate
hydrolog-ical impacts of land use change (Zhang and Wang, 2007). Ea, as the predominant part of the water cycle, is the key
to build this model. It is attributed primarily to land use and also affected by several other factors such as soil types and topographic slope (Moiwo et al., 2010). The daily Ea
(mm day−1) might be improved by the Surface Energy Bal-ance Algorithm for Land (SEBAL), remote-sensing-based models validated by the Penman–Monteith approach, and the SWAT model (Gao and Long, 2008; Gao et al., 2008). The Penman–Monteith method is commonly considered as the best way to estimate the value ofEp. However, the
ap-plication was difficult due to insufficient climate data, espe-cially variables about solar radiation. Therefore, the Hamon method (Hamon, 1963) recommended by the Food and Agri-culture Organization of the United Nations (FAO) was used to calculateEp. The model parameter (ω) had been derived
from numerous catchments (Zhang et al., 2001). Then a sim-ple two-parameter model based on these coefficients was ap-plied to many other catchments (Sun et al., 2005; Ma et al., 2008; Zhang et al., 2008). Our research specified an analyti-cal expression to determine the value of 2.8 and 1.5, respec-tively, for forestland and grassland/cropland with a correla-tion coefficient of 0.78 and 0.80 during calibracorrela-tion and val-idation phases, respectively. The data errors combined with uncertainty of model structure increased uncertainty to attri-bution of land use change. Meanwhile, to detect the potential streamflow response of land use change in the MYRC, the model adopted the land use data in 1988 to estimate stream-flow since 1984, which may cause errors due to variation of land use from 1984 to 1988. Besides, spatial and tem-poral variations of land use also affected streamflow change (Donohue et al., 2011; Roderick and Farquhar, 2011). In the model, recharge to groundwater and change of soil water storage might be ignored for water balance in a meso-scale catchment (Sun et al., 2005). Moreover, uncertainty of the model would be exaggerated when applied to small catch-ments, such as the BCZ catchment (65.2 km2) and the TM catchment (3.4 km2).
In the CEM,P andEp were employed to assess
hydro-logical impacts of climate variation. AnnualP in the evalu-ation period I was 9 mm yr−1more than that in the reference period. Simultaneously, Ep in the evaluation period I was
25 mm yr−1 more than that in the reference period.dQclim
was only−1.5 mm yr−1, which indicated that theQ incre-ment as the result of theP increment was slightly less than Qreduction as the result of theEpincrement.
a 10 % precipitation alteration in moutains in China (Yang et al., 2014b).
The RRM accounts for rainfall as the only climatic in-dicator to estimate the impact of climate change. This sim-plification might be the main reason resulting in the dif-ferences from other two approaches. P for 1984–1999 was 9 mm yr−1 greater than that for 1961–1983, while dQclim was 2.7 mm yr−1 smaller correspondingly (Table 1), which illustrated that the variance of the monthly precipitation played an important role in modeling streamflow besides an-nualP. Moreover, the watershed in the Miyun Reservior was characterized by thin soils (<30 cm) in a rocky mountain environment (He et al., 2010). Therefore, the watershed is rather responsive to rainfall events.
4.3 Implications to water resources management In the Miyun Reservoir catchment, forestlands accounted for more than half of the total area. Compared to 1978, forest-land area increased by 5.0 % in 1988, 16.3 % in 1998, and 18.2 % in 2008, whereas cropland decreased by 6.6, 8.7, and 10.8 %, respectively. Meanwhile, grassland area increased from 16.5 % in 1978 to 18.5 % in 1988, and then reduced to 10.4 % in 1998, and 9.8 % in 2008 (Fig. 9). Compared to the reference period, land use change resulted in streamflow de-cline for the 1984–1999 and 2000–2008 periods. It appears that the land use change effect was most pronounced dur-ing 1984–1999. Since January 1982, implementation of the household contract responsibility system has brought a huge impact on cropland and forestland. Reforestation has been widely implemented to develop forest industry and tourism especially along with implementation of Grain for Green and the Beijing–Tianjin Sandstorm Cource Control Project since the later 1990s (Zheng et al., 2010).
This study shows that the study region has experienced global warming, and climate change may increase the uncer-tainty of the estimated land use impact (Lauri et al., 2012). Climate change should be considered as a critical factor to optimize future water management (Gosling et al., 2011). Furthermore, anthropogenic effects, including water with-drawal and water restriction policy, could have both negative and positive effects on water supply to the Miyun Reservoir. Monitoring and objectively evaluating spatial and temporal variation of water resources are the prerequisites for water resource planning. Land use could also offset the negative effects of climate variation. For example, paddy-to-dry-land conversion in the study basin is considered as an effective means to increase inflow into the Miyun Reservoir. More-over, artificial forest plantations widely implemented during the last 30 years are considered to aggravate water stress in this semi-arid region (Wang et al., 2012). More local vegeta-tion rather than man-made forests with exotic tree species should be established to achieve the desired hydrological functioning of the MYRC. At the same time, proper alloca-tion of water resources, such as water demand mangement,
1
0 10 20 30 40 50 60 70 80
Grassland Cropland Forestland Others
%
Land use types
[image:9.612.328.526.68.183.2]1978 1988 1998 2008
Figure 9. Land use composition of the Miyun Reservoir catchment
(14 653 km2) in 1978, 1988, 1998, and 2008.
can play an important role in solving water crises. In sum-mary, comprehensive measures including vegetation restora-tion and water allocarestora-tion are necessary to deal with water shortages facing the MYRC.
5 Conclusions
The comprehensive modeling approach developed by this study offers insights into the hydrological changes in the Miyun Reserior, which has experienced a significant decreas-ing trend of streamflow in the past 3 decades due to a com-bination of changes in land use and climate. The dramatic change of land use in the 1980s and 1990s due to expan-sion of forestland and reduction of cropland has exacerbated streamflow decline by boosting catchment evapotransiration. Climate change during the 1990s–2000s has resulted in an increase in air temperature and thus poential evapotransira-tion, resulting in an increase in total water loss from the study basin. Land use change dominated the streamflow decline in the 1980s–1990s, but climate change contributed most to the water supply decline in the 2000s.
We conclude that future climate change must be consid-ered in designing watershed management strategies includ-ing reforesation efforts to protect water quality and to reduce soil erosion in the Miyun Reservoir to meet the increasing water supply demand of the megacity of Beijing. Active land use management such as converting marginal croplands to natural grasslands, planting local species rather than exotic species, and water resources management such as irrigation or industry water uses should be optimized to adapt to future climate changes to sustain the water supply functions of the Miyun Reservior. Future studies should focus on sceanario analysis to examine the trade-offs of water management op-tions in terms of hydrologic impacts under future climate change conditions.
Acknowledgements. This work was financially supported by the
Duke University. We thank Cunyong Ju for his assistance in data analysis.
Edited by: S. Uhlenbrook
References
Aguado, E., Cayan, D., Riddle, L., and Roos, M.: Climatic fluctu-ations and the timing of West Coast streamflow, J. Climate, 5, 1468–1483, 1992.
Arabi, M., Govindaraju, R. S., and Hantush, M. M.: A probabilistic approach for analysis of uncertainty in the evaluation of water-shed management practices, J. Hydrol., 333, 459–471, 2007. Baker, T. J. and Miller, S. N.: Using the Soil and Water Assessment
Tool (SWAT) to assess land use impact on water resources in an East African watershed, J. Hydrol., 486, 100–111, 2013. Bao, Z., Fu, G., Wang, G., Jin, J., He, R., Yan, X., and Liu, C.:
Hydrological projection for the Miyun Reservoir basin with the impact of climate change and human activity, Quatern. Int., 282, 96–103, doi:10.1016/j.quaint.2012.07.012, 2012a.
Bao, Z., Zhang, J., Wang, G., Fu, G., He, R., Yan, X., Jin, J., Liu, Y., and Zhang, A.: Attribution for decreasing stream-flow of the Haihe River basin, northern China: Climate vari-ability or human activities?, J. Hydrol., 460–461, 117–129, doi:10.1016/j.jhydrol.2012.06.054, 2012b.
Barnett, T. P., Adam, J. C., and Lettenmaier, D. P.: Potential impacts of a warming climate on water availability in snow-dominated regions, Nature, 438, 303–309, 2005.
Beguería, S., López-Moreno, J. I., Lorente, A., Seeger, M., and García-Ruiz, J. M.: Assessing the effect of climate oscillations and land-use changes on streamflow in the Central Spanish Pyre-nees, Ambio, 32, 283–286, 2003.
Brown, A. E., Zhang, L., McMahon, T. A., Western, A. W., and Vertessy, R. A.: A review of paired catch-ment studies for determining changes in water yield result-ing from alterations in vegetation, J. Hydrol., 310, 28–61, doi:10.1016/j.jhydrol.2004.12.010, 2005.
Chang, J., Zhang, H., Wang, Y., and Zhu, Y.: Assessing the im-pact of climate variability and human activity to streamflow variation, Hydrol. Earth Syst. Sci. Discuss., 12, 5251–5291, doi:10.5194/hessd-12-5251-2015, 2015.
Chaobai River Management Bureau of Beijing: Flood and Drought Hazards in the Chaobai River, China Water Resour. and Hy-dropow. Press, Beijing, 1–209, 2004.
Christensen, N. S., Wood, A. W., Voisin, N., Lettenmaier, D. P., and Palmer, R. N.: The effects of climate change on the hydrol-ogy and water resources of the Colorado River basin, Climatic Change, 62, 337–363, 2004.
Costa, M. H., Botta, A., and Cardille, J. A.: Effects of large-scale changes in land cover on the discharge of the To-cantins River, Southeastern Amazonia, J. Hydrol., 283, 206–217, doi:10.1016/s0022-1694(03)00267-1, 2003.
Dong, W. and Li, X.: Analysis of water resource of Miyun reservoir in Chaobai river basin, Environ. Sci. Technol., 29, 58–60, 2006. Donohue, R. J., Roderick, M. L., and McVicar, T. R.: Can dynamic
vegetation information improve the accuracy of Budyko’s hydro-logical model?, J. Hydrol., 390, 23–34, 2010.
Donohue, R. J., Roderick, M. L., and McVicar, T. R.: Assess-ing the differences in sensitivities of runoff to changes in cli-matic conditions across a large basin, J. Hydrol., 406, 234–244, doi:10.1016/j.jhydrol.2011.07.003, 2011.
Fu, G., Charles, S. P., and Chiew, F. H. S.: A two-parameter cli-mate elasticity of streamflow index to assess clicli-mate change ef-fects on annual streamflow, Water Resour. Res., 43, W11419, doi:10.1029/2007WR005890, 2007.
Gao, P., Geissen, V., Ritsema, C. J., Mu, X. M., and Wang, F.: Im-pact of climate change and anthropogenic activities on stream flow and sediment discharge in the Wei River basin, China, Hy-drol. Earth Syst. Sci., 17, 961–972, doi:10.5194/hess-17-961-2013, 2013.
Gao, Y. and Long, D.: Intercomparison of remote sensing-based models for estimation of evapotranspiration and accuracy as-sessment based on SWAT, Hydrol. Process., 22, 4850–4869, doi:10.1002/hyp.7104, 2008.
Gao, Y., Yao, Z., Liu, B., and Lv, A.: Evolution trend of Miyun Reservoir inflow and its motivation factors analysis, Prog. Ge-ogr., 21, 546–553, 2002.
Gao, Y., Long, D., and Li, Z. L.: Estimation of daily actual evap-otranspiration from remotely sensed data under complex terrain over the upper Chao river basin in North China, Int. J. Remote Sens., 29, 3295–3315, doi:10.1080/01431160701469073, 2008. Gosling, S. N., Taylor, R. G., Arnell, N. W., and Todd, M. C.: A
comparative analysis of projected impacts of climate change on river runoff from global and catchment-scale hydrological mod-els, Hydrol. Earth Syst. Sci., 15, 279–294, doi:10.5194/hess-15-279-2011, 2011.
Hamon, W. R.: Computation of direct runoff amounts from storm rainfall, Int. Assoc. Scient. Hydrol. Publ., 63, 52–62, 1963. Haverkamp, S., Fohrer, N., and Frede, H. G.: Assessment of the
ef-fect of land use patterns on hydrologic landscape functions: a comprehensive GIS-based tool to minimize model uncertainty resulting from spatial aggregation, Hydrol. Process., 19, 715– 727, doi:10.1002/hyp.5626, 2005.
He, J., Cai, Q., Li, G., and Wang, Z.: Integrated erosion con-trol measures and environmental effects in rocky mountainous areas in northern China, Int. J. Sediment Res., 25, 294–303, doi:10.1016/s1001-6279(10)60046-7, 2010.
Hydrological yearbook of the people’s Republic of China: the Haihe River Basin, Hebei Province Hydrologic Station Press, Shiji-azhuang, 3, 144–150, 1991.
Isik, S., Kalin, L., Schoonover, J. E., Srivastava, P., and Lockaby, B. G.: Modeling effects of changing land use/cover on daily stream-flow: An Artificial Neural Network and curve number based hy-brid approach, J. Hydrol., 485, 103–112, 2013.
Jones, R. N., Chiew, F. H. S., Boughton, W. C., and Zhang, L.: Esti-mating the sensitivity of mean annual runoff to climate change using selected hydrological models, Adv. Water Resour., 29, 1419–1429, doi:10.1016/j.advwatres.2005.11.001, 2006. Kavetski, D., Kuczera, G., and Franks, S. W.: Bayesian analysis
of input uncertainty in hydrological modeling: 2. Application, Water Resour. Res., 42, W03408, doi:10.1029/2005WR004376, 2006.
Lauri, H., deMoel, H., Ward, P. J., Räsänen, T. A., Keskinen, M., and Kummu, M.: Future changes in Mekong River hydrology: impact of climate change and reservoir operation on discharge, Hydrol. Earth Syst. Sci., 16, 4603–4619, doi:10.5194/hess-16-4603-2012, 2012.
Li, L., Zhang, L., Wang, H., Wang, J., Yang, J., Jiang, D., Li, J., and Qin, D.: Assessing the impact of climate variability and human activities on streamflow from the Wuding River basin in China, Hydrol. Process., 21, 3485–3491, doi:10.1002/hyp.6485, 2007. Li, Z. and Li, X.: Trend and causation analysis of runoff variation
in the upper reach of Chaobaihe River Basin in northern China during 1961–2005, J. Beijing Forest. Univ., 30, 82–87, 2008. Liu, B., Yao, Z., and Gao, Y.: Trend and driving forces of water
consumed structure changes in Beijing, Resource Science, 25, 38–43, 2003.
López-Moreno, J. I., Vicente-Serrano, S. M., Moran-Tejeda, E., Za-balza, J., Lorenzo-Lacruz, J., and García-Ruiz, J. M.: Impact of climate evolution and land use changes on water yield in the ebro basin, Hydrol. Earth Syst. Sci., 15, 311–322, doi:10.5194/hess-15-311-2011, 2011.
Lu, J., Sun, G., McNulty, S., and Amatya, D. M.: A Comparison of Six Potential Evapotranspiration Methods for Regional Use in the Southeastern United States, J. Am. Water Resour. Assoc., 41, 621–633, 2005.
Ma, H., Yang, D., Tan, S. K., Gao, B., and Hu, Q.: Impact of climate variability and human activity on streamflow decrease in the Miyun Reservoir catchment, J. Hydrol., 389, 317–324, doi:10.1016/j.jhydrol.2010.06.010, 2010.
Ma, Z., Kang, S., Zhang, L., Tong, L., and Su, X.: Analysis of im-pacts of climate variability and human activity on streamflow for a river basin in arid region of northwest China, J. Hydrol., 352, 239–249, doi:10.1016/j.jhydrol.2007.12.022, 2008.
Mango, L. M., Melesse, A. M., McClain, M. E., Gann, D., and Setegn, S. G.: Land use and climate change impacts on the hydrology of the upper Mara River Basin, Kenya: results of a modeling study to support better resource management, Hy-drol. Earth Syst. Sci., 15, 2245–2258, doi:10.5194/hess-15-2245-2011, 2011.
Mann, H. B.: Nonparametric tests against trend, Econometrica, 13, 245–259, doi:10.2307/1907187, 1945.
Mao, D. and Cherkauer, K. A.: Impacts of land-use change on hy-drologic responses in the Great Lakes region, J. Hydrol., 374, 71–82, doi:10.1016/j.jhydrol.2009.06.016, 2009.
Moiwo, J. P., Lu, W., Zhao, Y., Yang, Y., and Yang, Y.: Impact of land use on distributed hydrological processes in the semi-arid wetland ecosystem of Western Jilin, Hydrol. Process., 24, 492– 503, 2010.
Morán-Tejeda, E., Ceballos-Barbancho, A., and Llorente-Pinto, J. M.: Hydrological response of Mediterranean headwaters to cli-mate oscillations and land-cover changes: The mountains of Duero River basin (Central Spain), Global Planet. Change, 72, 39–49, 2010.
Petchprayoon, P., Blanken, P. D., Ekkawatpanit, C., and Hussein, K.: Hydrological impacts of land use/land cover change in a large river basin in central–northern Thailand, Int. J. Climatol., 30, 1917–1930, 2010.
Raymond, P. A., Oh, N.-H., Turner, R. E., and Broussard, W.: An-thropogenically enhanced fluxes of water and carbon from the Mississippi River, Nature, 451, 449–452, 2008.
Risbey, J. S. and Entekhabi, D.: Observed Sacramento Basin streamflow response to precipitation and temperature changes and its relevance to climate impact studies, J. Hydrol., 184, 209– 223, 1996.
Roderick, M. L. and Farquhar, G. D.: A simple framework for re-lating variations in runoff to variations in climatic conditions and catchment properties, Water Resour. Res., 47, W00G07, doi:10.1029/2010WR009826, 2011.
Sankarasubramanian, A., Vogel, R. M., and Limbrunner, J. F.: Cli-mate elasticity of streamflow in the United States, Water Resour. Res., 37, 1771–1781, doi:10.1029/2000wr900330, 2001. Schaake, J. C. and Waggoner, P.: From climate to flow, Climate
change and US water resources, John Wiley and Sons Inc., New York, 177–206, 1990.
Schewe, J., Heinke, J., Gerten, D., Haddeland, I., Arnell, N. W., Clark, D. B., Dankers, R., Eisner, S., Fekete, B. M., Colon-Gonzalez, F. J., Gosling, S. N., Kim, H., Liu, X., Masaki, Y., Portmann, F. T., Satoh, Y., Stacke, T., Tang, Q., Wada, Y., Wisser, D., Albrecht, T., Frieler, K., Piontek, F., Warszawski, L., and Kabat, P.: Multimodel assessment of water scarcity un-der climate change, P. Natl. Acad. Sci. USA, 111, 3245–3250, doi:10.1073/pnas.1222460110, 2014.
Searcy, J. K. and Hardison, C. H.: Double-mass curves Manual of Hydrology: Part 1. General surface-water Techniques, Geolog-ical survey water-supply paper 1541-B, United States Govern-ment Printing Office, Washington, D.C., 31–64, 1960.
Shen, Z. Y., Chen, L., and Chen, T.: Analysis of parameter un-certainty in hydrological and sediment modeling using GLUE method: a case study of SWAT model applied to Three Gorges Reservoir Region, China, Hydrol. Earth Syst. Sci., 16, 121–132, doi:10.5194/hess-16-121-2012, 2012.
Sneyers, R.: Sur l’analyse statistique des séries d’observations, Se-crétariat de l’Organisation Météorologique Mondiale, Geneva, 1–192, 1975.
Stohlgren, T. J., Chase, T. N., Pielke, R. A., Kittel, T. G., and Baron, J.: Evidence that local land use practices influence regional cli-mate, vegetation, and stream flow patterns in adjacent natural ar-eas, Global Change Biol., 4, 495–504, 1998.
Sun, G., McNulty, S. G., Lu, J., Amatya, D. M., Liang, Y., and Kolka, R. K.: Regional annual water yield from for-est lands and its response to potential deforfor-estation across the southeastern United States, J. Hydrol., 308, 258–268, doi:10.1016/j.jhydrol.2004.11.021, 2005.
Sun, G., Zhou, G., Zhang, Z., Wei, X., McNulty, S. G., and Vose, J. M.: Potential water yield reduction due to forestation across China, J. Hydrol., 328, 548–558, doi:10.1016/j.jhydrol.2005.12.013, 2006.
Sun, S., Chen, H., Ju, W., Song, J., Zhang, H., Sun, J., and Fang, Y.: Effects of climate change on annual streamflow using climate elasticity in Poyang Lake Basin, China, Theor. Appl. Climatol., 112, 169–183, 2013.
Tang, L., Yang, D., Hu, H., and Gao, B.: Detecting the effect of land-use change on streamflow, sediment and nutrient losses by distributed hydrological simulation, J. Hydrol., 409, 172–182, doi:10.1016/j.jhydrol.2011.08.015, 2011.
change impact on water resources, Hydrol. Earth Syst. Sci., 17, 565–578, doi:10.5194/hess-17-565-2013, 2013.
Verburg, P. H., Kathleen, N., and Linda, N.: Challenges in us-ing land use and land cover data for global change stud-ies, Global Change Biol., 17, 974–989, doi:10.1111/j.1365-2486.2010.02307.x, 2011.
Wang, G., Xia, J., and Chen, J.: Quantification of effects of cli-mate variations and human activities on runoff by a monthly water balance model: A case study of the Chaobai River basin in northern China, Water Resour. Res., 45, W00A11, doi:10.1029/2007wr006768, 2009.
Wang, R., Kalin, L., Kuang, W., and Tian, H.: Individual and com-bined effects of land use/cover and climate change on Wolf Bay watershed streamflow in southern Alabama, Hydrol. Process., 28, 5530–5546, doi:10.1002/hyp.10057, 2014.
Wang, S., Zhang, Z., McVicar, T. R., Zhang, J., Zhu, J., and Guo, J.: An event-based approach to understanding the hydrological im-pacts of different land uses in semi-arid catchments, J. Hydrol., 416–417, 50–59, doi:10.1016/j.jhydrol.2011.11.035, 2012. Wang, S., Zhang, Z., McVicar, R. T., Guo, J., Tang, Y.,
and Yao, A.: Isolating the impacts of climate change and land use change on decadal streamflow variation: Assess-ing three complementary approaches, J. Hydrol., 507, 63–74, doi:10.1016/j.jhydrol.2013.10.018, 2013.
Wang, Y.: A spatiotemporal analysis of land use change and zon-ing of landscape restoration and protection in Miyun Reservoir watershed, PhD thesis of Chinese Academy of Forestry, Beijing, 38–39, 2010.
Wei, X., Liu, W., and Zhou, P.: Quantifying the relative contribu-tions of forest change and climatic variability to hydrology in large watersheds: a critical review of research methods, Water, 5, 728–746, doi:10.3390/w5020728, 2013.
Wigbout, M.: Limitation in the use of double-mass curves, J. Hy-drol., 12, 132–138, 1973.
Xie, P., Chen, G., Li, D., and Zhu, Y.: Comprehensive diagnosis method of hydrologic time series change-point analysis, Water Resour. Pow., 23, 11–14, 2005.
Xu, Z. X., Pang, J. P., Liu, C. M., and Li, J. Y.: Assessment of runoff and sediment yield in the Miyun Reservoir catch-ment by using SWAT model, Hydrol. Process., 23, 3619–3630, doi:10.1002/hyp.7475, 2009.
Yang, H., Yang, D., and Hu, Q.: An error analysis of the Budyko hypothesis for assessing the contribution of cli-mate change to runoff, Water Resour. Res., 50, 9620–9629, doi:10.1002/2014wr015451, 2014a.
Yang, H., Qi, J., Xu, X., Yang, D., and Lv, H.: The re-gional variation in climate elasticity and climate contri-bution to runoff across China, J. Hydrol., 517, 607–616, doi:10.1016/j.jhydrol.2014.05.062, 2014b.
Yang, Y. and Tian, F.: Abrupt change of runoff and its major driving factors in Haihe River Catchment, China, J. Hydrol., 374, 373– 383, doi:10.1016/j.jhydrol.2009.06.040, 2009.
Zégre, N., Skaugset, A. E., Som, N. A., McDonnell, J. J., and Ganio, L. M.: In lieu of the paired catchment approach: Hydrologic model change detection at the catchment scale, Water Resour. Res., 46, W11544, doi:10.1029/2009wr008601, 2010.
Zhan, C., Xu, Z., Ye, A., and Su, H.: LUCC and its impact on run-off yield in the Bai River catchment–upstream of the Miyun Reser-voir basin, J. Plant Ecol., 4, 61–66, doi:10.1093/jpe/rtr003, 2011. Zhang, J. and Wang, G.: Impacts of climate changes on hydrology
and water resources, Science Press, Beijing, 188–189, 2007. Zhang, L., Dawes, W. R., and Walker, G. R.: Response of mean
an-nual evapotranspiration to vegetation changes at catchment scale, Water Resour. Res., 37, 701–708, doi:10.1029/2000wr900325, 2001.
Zhang, X., Zhang, L., Zhao, J., Rustomji, P., and Hairsine, P.: Re-sponses of streamflow to changes in climate and land use/cover in the Loess Plateau, China, Water Resour. Res., 44, W00A07, doi:10.1029/2007wr006711, 2008.
Zheng, J., Yu, X., Jia, G., and Xia, B.: Dynamic evolution of eco-logical service value based on LUCC in Miyun Reservoir Catch-ment, T. CSAE, 26, 315–320, 2010.