• No results found

The effect of assimilating satellite derived soil moisture data in SiBCASA on simulated carbon fluxes in Boreal Eurasia

N/A
N/A
Protected

Academic year: 2020

Share "The effect of assimilating satellite derived soil moisture data in SiBCASA on simulated carbon fluxes in Boreal Eurasia"

Copied!
20
0
0

Loading.... (view fulltext now)

Full text

(1)

www.hydrol-earth-syst-sci.net/20/605/2016/ doi:10.5194/hess-20-605-2016

© Author(s) 2016. CC Attribution 3.0 License.

The effect of assimilating satellite-derived soil moisture data in

SiBCASA on simulated carbon fluxes in Boreal Eurasia

M. K. van der Molen1, R. A. M. de Jeu2,3, W. Wagner4, I. R. van der Velde1, P. Kolari5, J. Kurbatova6, A. Varlagin6, T. C. Maximov7, A. V. Kononov7, T. Ohta8, A. Kotani8, M. C. Krol1, and W. Peters1,9

1Meteorology and Air Quality group, Wageningen University, P.O. Box 47, 6700 AA Wageningen, the Netherlands 2VU University Amsterdam, Department of Earth Sciences, De Boelelaan 1085, 1081 HV Amsterdam, the Netherlands 3Transmissivity B. V., Space Technology Centre, Huygensstraat 34, Noordwijk, the Netherlands

4Vienna University of Technology, Department of Geodesy and Geoinformation, Gusshausstrasse 27–29, 1040 Vienna, Austria

5Department of Physics, University of Helsinki, P.O. Box 48, Erik Palménin aukio 1, 00014 Helsinke, Finland 6A. N. Severtsov Institute of Ecology and Evolution of the Russian Academy of Sciences, Leninsky Prospekt 33, 119071 Moscow, Russia

7Institute for Biological Problems of the Cryolithozone, 677980, 41 Lenin Ave., Yakutsk, Republic of Sakha (Yakutia), Russia 8Graduate School of Bioagricultural Sciences, Nagoya University, Furo-cho, Chikusa-ku, Nagoya, 464-8601, Japan

9Centre for Isotope Research, Energy and Sustainability Research Institute Groningen, Groningen University, Groningen, the Netherlands

Correspondence to: M. K. van der Molen ([email protected])

Received: 30 June 2015 – Published in Hydrol. Earth Syst. Sci. Discuss.: 4 September 2015 Revised: 21 December 2015 – Accepted: 23 January 2016 – Published: 3 February 2016

Abstract. Boreal Eurasia is a region where the interaction between droughts and the carbon cycle may have significant impacts on the global carbon cycle. Yet the region is ex-tremely data sparse with respect to meteorology, soil mois-ture, and carbon fluxes as compared to e.g. Europe. To bet-ter constrain our vegetation model SiBCASA, we increase data usage by assimilating two streams of satellite-derived soil moisture. We study whether the assimilation improved SiBCASA’s soil moisture and its effect on the simulated car-bon fluxes. By comparing to unique in situ soil moisture ob-servations, we show that the passive microwave soil moisture product did not improve the soil moisture simulated by SiB-CASA, but the active data seem promising in some aspects. The match between SiBCASA and ASCAT soil moisture is best in the summer months over low vegetation. Neverthe-less, ASCAT failed to detect the major droughts occurring between 2007 and 2013. The performance of ASCAT soil moisture seems to be particularly sensitive to ponding, rather than to biomass. The effect on the simulated carbon fluxes is large, 5–10 % on annual GPP and TER, tens of percent on local NEE, and 2 % on area-integrated NEE, which is

the same order of magnitude as the inter-annual variations. Consequently, this study shows that assimilation of satellite-derived soil moisture has potentially large impacts, while at the same time further research is needed to understand under which conditions the satellite-derived soil moisture improves the simulated soil moisture.

1 Introduction

(2)

flat terrain. This causes a bi-modal spatial distribution in soil moisture, with dry hills and wet plains. This process is prably hard to catch by land surface models and satellite ob-servations alike. Satellite-derived soil moisture is observed to have large variability in the northern regions, both within and between different approaches (Mladenova et al., 2014). The derivation of satellite soil moisture is difficult in snow-, ice-snow-, and surface-water-rich areas (Högström et al.snow-, 2014; Naeimi et al., 2012a). These aspects make a working soil moisture data assimilation system very relevant for vegeta-tion modelling in the region, and challenging. The few tower sites running in the region now have fairly long measurement records, so that they can be used for validation of inter-annual variation (e.g. the 2010 drought). An effort specifically tar-geted at Boreal Eurasia and carbon fluxes has not been tried before.

Earlier efforts to assimilate satellite-derived soil moisture in vegetation models were often focused on the improvement of soil moisture itself and/or validated with in situ observa-tions over short vegetation in temperate and Mediterranean climate zones (Reichle and Koster, 2005; Reichle et al., 2007; Draper et al., 2009a, b; Miralles et al., 2011b). Other studies focus on the effect on crop yield and carbon fluxes in Eu-rope (Verstraeten et al., 2010; de Wit and van Diepen, 2007; Han et al., 2014). The Global Land Data Assimilation Sys-tems (GLDAS, http://ldas.gsfc.nasa.gov/GLDAS/, see Chen et al., 2013) is worth mentioning here too. Our study is thus the first to assimilate satellite soil moisture in Boreal Eura-sia and to evaluate the impact on simulated soil moisture and carbon fluxes with in situ data.

Soil moisture affects vegetation carbon fluxes through photosynthesis and respiration rates. Photosynthesis rates de-pend on the stomatal conductance, which the plants regulate according to the water potential in the leaf and the atmo-spheric vapour pressure deficit. The water potential in the leaf is a function of water supply by the roots and the water use by transpiration (Katul et al., 2010). Heterotrophic res-piration depends on the soil moisture content, which is the substrate in which microbes and bacteria consume organic matter and release CO2. The dependence of photosynthesis, transpiration, and respiration fluxes on soil moisture is imple-mented in virtually all contemporary vegetation models via similar types of drought sensitivity functions (Verhoef and Egea, 2014; Sellers et al., 1996; Vetter et al., 2008).

Based on simulations with global climate models, it is expected that global warming is associated with more ex-treme precipitation regimes, resulting in more frequent and more intense flooding and drought events (Dai, 2011). It is

These extremes may have a large effect on the carbon balance of the affected regions, sometimes undoing 10 years of “nor-mal” carbon uptake by natural vegetation and causing crop yield reduction or crop failure (van der Molen et al., 2011; Peters et al., 2010; Reichstein et al., 2007; Ciais et al., 2005). Soil moisture in land surface models is the balance of pre-cipitation and evaporation, transpiration, runoff, and lateral outflow. Land surface models are often primarily calibrated to simulate water, heat, and carbon exchange with the atmo-sphere correctly (Williams et al., 2009; Morales et al., 2005), and the water stress function is often one of the functions that is used for calibration. As a result, the absolute value of soil moisture in land surface models, and its variation, has often been subsidiary to simulating exchange fluxes correctly. In the perspective of the expected increasing occurrence of ex-tremes in soil moisture, it is questionable whether this proce-dure results in satisfactory representation of droughts in land surface models, and their effects on the carbon balances and the disturbance of pools.

Two independent databases of remotely sensed soil mois-ture have been published recently: the passive microwave soil moisture data set, based on the land parameter retrieval model (LPRM) (Owe et al., 2008), and the active microwave data set, METOP ASCAT 25 (Wagner et al., 1999; Naeimi et al., 2009, 2012b). See Sect. 2.2 for details.

(3)

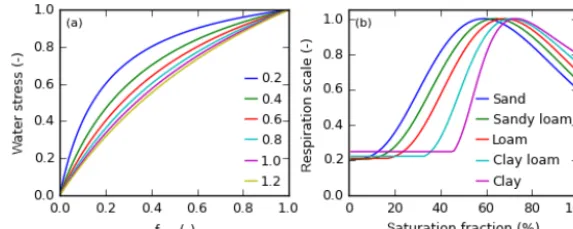
Figure 1. (a) The water stress function in SiBCASA as a function of plant available water fraction. The scaling function is shown for various

shape parameters (see legend). The default value for the shape parameter is 0.2 for all biome types. (b) The heterotrophic respiration scaling function in SiBCASA as a function of soil moisture saturation fraction and soil type.

The objective of this paper is therefore to evaluate the use of satellite observed soil moisture for data assimilation in vegetation models in a data-poor region like Boreal Eurasia and to evaluate the impact on the simulated carbon fluxes.

The increasing availability of remote sensing products, e.g. the Soil Moisture and Ocean Salinity mission (SMOS) (Kerr et al., 2001), the Global Change Observation Mission – Water (GCOM-W) (Imaoka et al., 2010; Oki et al., 2010), the Global Land Evaporation: the Amsterdam Methodol-ogy (GLEAM) (Miralles, 2011; Miralles et al., 2011b), and the Soil Moisture Active Passive mission (SMAP) (En-tekhabi et al., 2010), make this evaluation timely and rele-vant. If the assimilation of soil moisture proves worthwhile, it may also be applied in other land surface models, e.g. in mesoscale atmosphere models or in agro-meteorological models.

2 Methods

2.1 SiBCASA vegetation model

SiBCASA is an interactive vegetation–atmosphere model simulating how the growth of vegetation depends on the ex-change of water, energy, and carbon between vegetation, at-mosphere, and soil (Schaefer et al., 2008). SiBCASA con-sists of two coupled components, the SiB component simu-lates the exchange of heat and water and the uptake of car-bon dioxide as a function of temperature, radiation density, humidity, and wind speed, as well as root-zone soil moisture conditions with several time steps per hour (Sellers et al., 1996; Jafarov and Schaefer, 2015). It uses the Farquhar pho-tosynthesis parametrization (Farquhar et al., 1980) in combi-nation with a Ball–Berry type stomatal conductance formu-lation (Collatz et al., 1991).

The CASA component simulates how the carbon taken up by photosynthesis is allocated to different parts of the veg-etation, with specified residence times (Potter et al., 1993). The seasonal development of leaf area index is a function of the amount of carbon allocated to leaves, but the amount of

absorbed photosynthetically active radiation (fPAR) is con-strained by remote sensing. A more detailed summary of the general features of SiBCASA can be found in van der Velde et al. (2014).

SiBCASA is intended for use as a lower boundary con-dition for large-scale atmospheric transport models, such as general circulation models and data assimilation systems such as CarbonTracker (Peters et al., 2007). Therefore, it is specifically required to correctly simulate the regional effects of climate variations. In this paper we focus on the role of soil moisture in SiBCASA, with the aim to better describe the effects of climate extremes on the terrestrial carbon diox-ide balance. Therefore, we will briefly describe SiBCASA’s method of simulating soil water uptake and the relation with stomatal conductance.

SiBCASA is configured with 25 soil layers with a depth up to 15 m and thicknesses ranging from 2 cm near the surface to 3 m at depth. Roots extract water from the part of the soil they penetrate. The plant-available water fraction (fpaw) is com-puted as a function of root depth, porosity, wilting point, field capacity, and soil moisture content and varies between wilt-ing point (fpaw=0) and field capacity (fpaw=1). The plant-available water fraction directly influences the photosynthe-sis capacity by means of the water stress function (Fig. 1), which equals one at field capacity and zero at wilting point. The shape parameter of the soil moisture is 0.2 by default (Fig. 1), implying an aggressive water use strategy, i.e. lim-ited water stress in wet to medium dry soils and accelerating water stress with further drying. At low plant-available wa-ter fractions, the photosynthesis capacity is thus reduced by multiplication with the water stress function. This in turn re-duces the stomatal conductance.

[image:3.612.156.443.68.183.2]
(4)

The satellite-observed soil moisture data used in this study come from two independent sources (Liu et al., 2011, 2012): the first is from passive microwave observations, the sec-ond from active radar observations. Passive microwave ra-diation sensors have been on board of various satellite plat-forms, e.g. Scanning Multichannel Microwave Radiometer (SMMR, 1978–1987), Special Sensor Microwave Imager (SSM/I, 1987–present), Tropical Rainfall Measuring Mission Microwave Imager (TMI, 1997–2015) and the Advanced Mi-crowave Scanning Radiometer – Earth Observing System (AMSR-E, 2002–2011). The retrieval algorithm, the Land Parameter Retrieval Method (LPRM) (De Jeu et al., 2009; De Jeu and Owe, 2003; Owe et al., 2008), is based on a simple radiative transfer equation and used dual-polarized brightness temperature observations in an optimization rou-tine to solve for soil moisture. The retrieved soil moisture is representative for the top few centimetres of the soil. LPRM accounts for the vegetation opacity in the microwave domain. Dense canopies attenuate the microwave signal from the un-derlying soil surface which results in a lower soil moisture retrieval accuracy. Therefore, the soil moisture retrieval is most reliable for bare and sparsely vegetated areas (de Jeu et al., 2008). As this study is focused on the period 2007– 2013, we use only the AMSR-E data with version v05 of the LPRM with a 50 km spatial resolution, and a 2–3 day revisit time (Owe et al., 2008).

Complementarily, active radar soil moisture retrievals from the Advanced Scatterometer (ASCAT, 2006–present) in combination with the change detection algorithm is rep-resentative for the soil moisture in the top few centime-tres (Bartalis et al., 2007; Wagner et al., 1999; Naeimi et al., 2009, 2012b). ASCAT soil moisture retrievals are reli-able for sparse and moderately vegetated areas, and less for bare soils (Liu et al., 2012). We use METOP ASCAT25, version WARP5.5, release 2.1, with a 0.25◦ spatial resolu-tion, and a 1-day temporal resolution) (Wagner et al., 1999; Naeimi et al., 2009, 2012b). The period of record of the AS-CAT data constrains the study period to 2007–2013. 2.3 Assimilation method

The objective of this paper is to attempt an improvement of soil moisture dynamics in SiBCASA by assimilating the passive microwave and/or ASCAT satellite-derived data de-scribed above. We use the same assimilation method as used in GLEAM (Miralles et al., 2011a; Miralles, 2011):

and depends on the error in the model soil moistureσsimand the error in the satellite observed soil moistureσobs:

Kt =

σtsim

σtsim+σtobs. (2)

The error in model soil moisture depends ond σmod, the un-certainty associated with model integration over a time step of one day:

σtmod=σtmod1,++dσmod. (3) We use a constantdσmod=0.01 m3m−3day−1. The model soil moisture is updated according to

w=w+dw. (4)

When observations were available, the model errorσtmod is reduced toσt+after the assimilation step:

σtmod,+=σtmod(1−Kt) . (5)

The error or noise in the satellite-observed soil moisture,

σobs, depends on the vegetation optical depth, land surface heterogeneity of the pixel, and snow or ice in or on top of the soil, and is output by the retrieval algorithm. The noise is typically of the order of 0.1 m3m−3(standard deviationσ, e.g. Figs. 5–8).

Since the satellite-observed soil moisture data essentially carry information only about the temporal variations in soil moisture, and not about the absolute value of mean and the amplitude of the variations, we normalize the satellite data (see below) before assimilating the satellite data in SiB-CASA. The entire assimilation procedure consists of the fol-lowing steps:

– Step 1: run SiBCASA without data assimilation to equi-librium in 2007 and then run until 2013, storing daily model results.

(5)
[image:5.612.110.486.84.423.2]

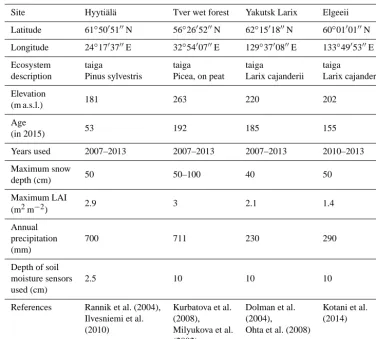
Table 1. Characteristics of the flux tower sites used in this study.

Site Hyytiälä Tver wet forest Yakutsk Larix Elgeeii

Latitude 61◦5005100N 56◦2605200N 62◦1501800N 60◦0100100N

Longitude 24◦1703700E 32◦5400700E 129◦3700800E 133◦4905300E

Ecosystem taiga taiga taiga taiga

description Pinus sylvestris Picea, on peat Larix cajanderii Larix cajanderii

Elevation

181 263 220 202

(m a.s.l.)

Age

53 192 185 155

(in 2015)

Years used 2007–2013 2007–2013 2007–2013 2010–2013

Maximum snow

50 50–100 40 50

depth (cm)

Maximum LAI

2.9 3 2.1 1.4

(m2m−2)

Annual

700 711 230 290

precipitation (mm)

Depth of soil

2.5 10 10 10

moisture sensors used (cm)

References Rannik et al. (2004), Kurbatova et al. Dolman et al. Kotani et al.

Ilvesniemi et al. (2008), (2004), (2014)

(2010) Milyukova et al. Ohta et al. (2008) (2002)

– Step 3: run SiBCASA from equilibrium in 2007 until 2013 with assimilation of the satellite-derived soil mois-ture.

– Step 4: evaluate the simulated soil moisture, water, and carbon fluxes with in situ flux tower data as described in Sect. 2.4.

2.4 In situ flux tower data

For evaluation of the model results, particularly the carbon fluxes, we use 25 site-years of data from four flux tower sites in Boreal Eurasia available in the period 2007–2013 (Ta-ble 1). The sites vary in vegetation type, continentality, and permafrost. Flux data were taken in Siberia at more locations, although predominantly in the period 1997–2005, when the ASCAT satellite was not yet launched (Dolman et al., 2012). The sites are in Hyytiälä, Finland (Ilvesniemi et al., 2010; Kolari et al., 2009; Mammarella et al., 2009; Rannik et al., 2004), Tver, European Russia (Kurbatova et al., 2008; Mi-lyukova et al., 2002), Yakutsk, East Siberia (Dolman et al., 2004; Ohta et al., 2008), and Elgeeii, East Siberia (Kotani et al., 2014). The eddy covariance data have been processed

according to the harmonized LaThuille FLUXNET database (Baldocchi et al., 2001; Reichstein et al., 2005; Papale et al., 2006; Moffat et al., 2007). All sites are covered with nee-dle leaf forests, evergreen in the western sites, and deciduous in the eastern sites. The stations Yakutsk and Elgeeii are on permafrost and have maximum snow depths of the order of 40 and 50 cm, respectively.

3 Results

We will first evaluate the spatial coherence between the sim-ulated and satellite-observed soil moisture, then the temporal coherence. All satellite and in situ data are CDF-matched to the SiBCASA soil moisture. Next, we will compare model and satellite soil moisture data with in situ observations. Fi-nally, we will evaluate the impact of satellite soil moisture assimilation on the simulated carbon fluxes.

3.1 Reliability of passive microwave and ASCAT soil moisture in Boreal Eurasia

(6)
[image:6.612.130.466.72.402.2]

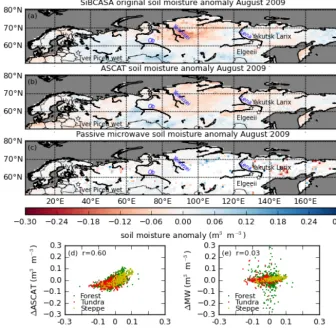
Figure 2. Soil moisture anomalies in August 2009 with respect to the average soil moisture in the months August 2007–2011. (a)–(c) The

anomaly in SiBCASA, ASCAT and passive microwave soil moisture. (d) The spatial correlation between the anomalies in ASCAT and SiBCASA soil moisture; each point represents one grid point in the maps (a) and (b). (e) The spatial correlation between passive microwave and SiBCASA soil moisture. The location of the four field sites is shown with open asterisks.

monthly soil moisture anomalies and by quantifying the spatial correlation between the anomalies. We compute the anomalies for each month with respect to the average soil moisture in that month in the years 2007 to 2011. We use the reference period until 2011 (and not 2013), because the AMSR-E satellite became dysfunctional in November 2011, and we have no passive microwave soil moisture after that date. Figure 2 shows an example of the spatial coherence in August 2009. This is the month with the largest spatial correlation between SiBCASA and ASCAT soil moisture in the period that AMSR-E data are available (r=0.60). A dry anomaly in North-central Siberia is apparent in both SiB-CASA and ASCAT and a wet anomaly in South and West Siberia, showing that there is coherence in the spatial struc-ture of both data sources. But there are also striking dif-ferences. The drought is more intensive and confined to a smaller area in SiBCASA as compared to ASCAT. In addi-tion, east from the Lena River, SiBCASA tends to have a wet anomaly, where ASCAT has a light dry anomaly. Neverthe-less, the spatial correlation coefficient is good withr=0.60

(second panel in Fig. 2). The correlation appears to be better for wet anomalies than for dry ones. If we compare the soil moisture from the passive microwave data to SiBCASA and ASCAT, no coherent pattern emerges, neither in August 2009 nor in other months. This is reflected in the low spatial cor-relation coefficient (r=0.03).

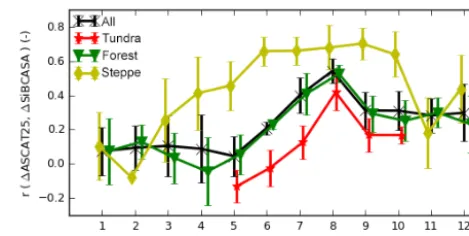
(7)

largest part of the study region (66 %), versus 24 % for tun-dra and 9 % for steppe. In the discussion we will provide po-tential explanations for the variation of the correlation coef-ficients over the seasons and over land cover types.

Considering the seasonal evolution of the correlation coef-ficients between SiBCASA and passive microwave soil mois-ture, there is no coherence between the two, except perhaps for the steppe regions, for which the correlation coefficients reach to 0.50 in Septembers. However, the slope of the re-gression curve is only about 1 : 3 (third panel of Fig. 2), whereas it is near 1 : 1 for ASCAT soil moisture (second panel of Fig. 2). Because the prior agreement between SiB-CASA and passive microwave soil moisture is too low for Boreal Eurasia, we do not consider it meaningful to proceed with assimilation in SiBCASA. We will focus on the ASCAT soil moisture alone in the remainder of this paper. This deci-sion will be further addressed in the discusdeci-sion section.

The spatial correlation is a measure of how well satellite and SiBCASA agree on the location of drought and wet re-gions. For assimilation purposes it is also interesting to in-vestigate the temporal correlation at each location. The tem-poral correlation coefficient is a measure of how well satel-lite and SiBCASA agree on the timing of dry and wet peri-ods. Figure 4 shows the temporal correlation coefficient be-tween SiBCASA and ASCAT daily soil moisture for all Au-gust months between 2007 and 2013 (31 days×7 days). We discarded all grid points where the associated observational error exceeds 0.25 m3m−3and all locations where time se-ries had less than 50 % coverage. The correlation coefficients are quite large, up to 0.80 in the West Siberian Plains south-west of the Ob River, with a transition zone via the Yenissei River to the West Siberian tundra region. The Yenissei River marks the western border of the Central Siberian Plateau, where the correlations are much smaller (0< r <0.2). In eastern Siberia, east of the Lena River, the correlations are variable, but generally small and sometimes even negative (−0.3< r <0.3). This pattern is somewhat representative for July, August, and September (see Figs. S1 and S2 in the Supplement, except that in September the area northeast of 60◦N, 90◦E is masked out for the lack of good-quality satel-lite data. Since we do not calculate correlations when SiB-CASA simulates frozen soil or when good-quality data are lacking, an apparent “winter mask” advances from the north-east in September to cover all of the region by December. In April this winter mask regresses into Siberia and disappears in June. As expected, at the front of the winter mask, which is generally 5◦wide, the correlations are low and patchy. We will consider potential underlying reasons for these patterns in the discussion.

[image:7.612.310.545.66.184.2]

The temporal correlations shown in Fig. 4 were computed with soil moisture on a daily basis. When computed on a monthly average basis, the correlation coefficients generally improve considerably, but the variability in soil moisture is smaller accordingly. This shows that day-to-day noise, par-ticularly in the satellite soil moisture data, is responsible for

Figure 3. The seasonal variation of the spatial correlation

coef-ficient of SiBCASA and ASCAT soil moisture for all grid cells (black x), tundra cells (red *), forest (green triangles), and steppe (brown diamonds). The errorbars indicate the variation between the years 2007–2013.

the low correlation coefficients, and that the remaining corre-lation is dominated by inter-annual variations. This suggests that it may be worthwhile to investigate assimilation of low-pass filtered satellite soil moisture instead of instantaneous measurements.

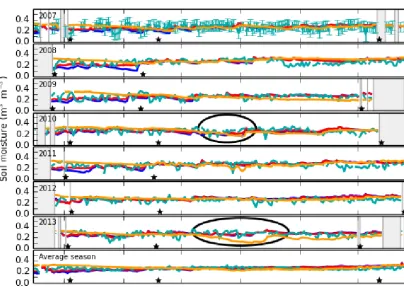
To better understand what these large-scale spatial and temporal correlation coefficients imply for the use of satellite soil moisture for assimilation in SiBCASA, time series of soil moisture were compared for four stations across Eurasia. In these time series we show the original SiBCASA soil mois-ture, the ASCAT soil moisture (CDF-matched), and in situ soil moisture. In addition, we show the SiBCASA soil mois-ture after assimilation of ASCAT soil moismois-ture according to Sect. 2.3. The first station is Hyytiälä in Finland. The time series are shown in Fig. 5. Simulated and in situ observed soil moisture generally change slowly in time, because of the soil moisture retention in the soil. Since satellite obser-vations lack this memory effect, the satellite obserobser-vations are noisier. Over the years ASCAT and in situ soil moisture are larger than SiBCASA soil moisture in the spring period (May to early June). This causes the assimilation procedure to in-crease soil moisture in SiBCASA (red line is higher than the blue line). This increase of soil moisture in the spring period improves the match with in situ observed soil moisture to the degree specified by the uncertainties (Eq. 2).

We loosely define a drought as a period when in situ ob-served soil moisture is more below the average soil moisture in that period (see bottom panels of Figs. 5–8) than the day-to-day variation during three or more weeks. Subsequently, two distinct drought periods in the time series occurred in July/August 2010 and in July/August 2013. In 2010 the origi-nal SiBCASA simulation also “saw” the drought, but ASCAT did not. The assimilation therefore decreased the match with in situ soil moisture. In 2013 the in situ observed drought in Hyytiälä was picked up by neither SiBCASA nor ASCAT.

(8)
[image:8.612.156.440.69.148.2]

Figure 4. The temporal correlation coefficient of SiBCASA and ASCAT soil moisture for all August months in the period 2007–2013

(7 years×31 days).

Figure 5. Time series of soil moisture in SiBCASA original (without assimilation) (blue), and with assimilation (red), in situ soil moisture

(orange), and ASCAT soil moisture (marine) in Hyytiälä, Finland. Each panel shows 1 year of soil moisture. Grey shades indicate periods when the top soil is frozen. The three asterisks indicate the date when the top soil is last frozen in the spring, 46 days after that, and the date when the top soil is first frozen again in the fall. Error bars in the top panel indicate the uncertainty in ASCAT soil moisture, which is for clarity only shown for 1 year. The bottom panel shows the average seasonal cycle of the each soil moisture type. In situ and ASCAT soil moisture are CDF-matched to SiBCASA soil moisture, which explains why they have the same mean and standard deviation.

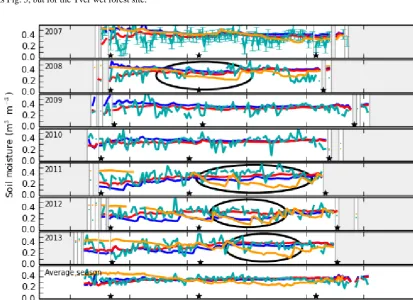
similar springtime behaviour emerges. ASCAT is generally larger than SiBCASA soil moisture in April to early May, and the assimilation improves the match with in situ ob-served soil moisture. Field workers confirm that the water table is generally high or even above the soil surface after snowmelt (April) and decreases quickly in May. In the sum-mers, soil moisture is generally quite constant, except during the 2010 drought, which caused extensive fires in European Russia. The drought was picked up by in situ observations and SiBCASA, but not by ASCAT. As a consequence, the

assimilation decreased the match of SiBCASA with in situ soil moisture.

[image:8.612.98.502.197.484.2]
(9)
[image:9.612.90.503.69.377.2]

Figure 6. As Fig. 5, but for the Tver wet forest site.

[image:9.612.91.505.376.676.2]
(10)
[image:10.612.94.505.68.352.2]

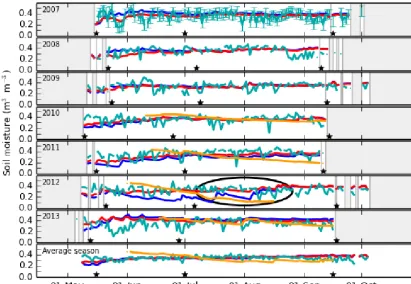
Figure 8. As Fig. 5, but for the Elgeeii site.

al. (2014) show that drought conditions at the site occurred between 2001 and 2004, and that the site was actually wa-ter logged from 2005 to 2009, returning to normal condi-tions afterwards. The water logging had severe impact on the ecosystem, with reduced photosynthesis rates and tree browning and mortality. This water logging may be a larger-scale process in eastern Siberia (Muskett and Romanovsky, 2009; Vey et al., 2013). Therefore the term “drought” is rel-ative to the studied period. SiBCASA sees the in situ ob-served droughts in 2008 and 2012 to some extent, but not the 2011 and 2013 ones. This inter-annual variation in soil moisture data is reflected in the minimum summertime in situ observed soil moisture in Fig. 7, which is much lower in 2011–2013 than in 2007–2008. ASCAT does not detect this inter-annual variation. ASCAT also does not observe the droughts, whereas the ASCAT soil moisture is generally even larger than in SiBCASA, causing the assimilation to decrease the match with in situ soil moisture.

The fourth site is Elgeeii, for which the time series are shown in Fig. 8. SiBCASA soil moisture is again low in the springtime (May), and ASCAT soil moisture is larger. The assimilation increases the soil moisture in SiBCASA, and this seems to improve the match with in situ observed soil moisture, although the early springtime in situ observations were unreliable. In 2012 a drought occurred in July and Au-gust. SiBCASA sees the drought too, although with a much earlier development. ASCAT does not see the drought, and

as a consequence, the assimilation moves the soil moisture in SiBCASA away from the in situ observations. It is interesting to see that on 5 August 2012 the soil moisture in SiBCASA increases due to a precipitation event, but this is not seen in the in situ observations. However, an increase is seen at that time in the in situ observations in Yakutsk, some 340 km to the northeast, possibly suggesting a displacement of the pre-cipitation event in the SiBCASA driver data from ECMWF ERA-interim.

Of the 11 droughts observed in the in situ time series at the four sites, SiBCASA reproduces four, and ASCAT none (Ta-ble 2). The poor skills of ASCAT to reproduce local drought conditions are an apparent contradiction given the good skills in positioning the major drought regions shown in Figs. 2 and 3. Particularly at the locations of our in situ observation sites ASCAT does not perform well in reproducing the tem-poral variability (see Fig. 4), which is confirmed at the site level in Figs. 5–8. To explain this better, we look at monthly mean soil moisture maps for the five drought occurrences which SiBCASA observes, but ASCAT does not.

(11)

Scandi-Figure 9. Monthly mean soil moisture in (a) SiBCASA and (b) ASCAT in August 2010. The ellipse shows the extent of the 2010 drought

[image:11.612.159.437.67.213.2]

according to SiBCASA.

Table 2. Detection of in situ observed drought occurrences by

SiB-CASA and ASCAT.

Drought seen by

Year Month Site In situ SiBCASA ASCAT

2008 July Yakutsk yes – no

2010 July/August Hyytiälä yes yes no

2010 August Tver yes yes no

2011 July/August Yakutsk yes no no

2012 July/August Yakutsk yes yes no

2012 July/August Elgeeii yes yes no

2013 July/August Hyytiälä yes no no

2013 July/August Yakutsk yes no no

navia to Novosibirsk (55◦N, 80E), with the Hyytiälä and Tver sites on the western rim of the drought region. ASCAT locates a drought in roughly the same region, although less intense and with a smaller geographical extent. The ASCAT wet anomaly over Europe expands further into Russia and Scandinavia. As a result, the sites Hyytiälä and Tver are just outside of the drought region as observed by ASCAT and this is most likely attributable to the ASCAT soil moisture retrieval skills. Figure 4 shows that the ASCAT performance is low around those sites. In Sect. 5 (and Fig. 12) we will discuss the performance at the sites in more detail.

In July 2012 SiBCASA simulates an intense drought that was located around the city Yakutsk, extending eastward to the region between the Lena and Aldan rivers (Fig. S3). The Elgeeii site was located just on the eastern border of the sim-ulated drought region. ASCAT does not observe this drought region, not in July, nor in earlier or later months. Where El-geeii was on the perimeter of the 2012 drought region, as were Hyytiälä and Tver in 2010, Yakutsk was in the cen-tre of the drought region, which ASCAT does not observe at all. Therefore a site’s location on the rim of a drought does not explain why ASCAT does not observe the drought. Rather it appears that ASCAT has limited capability to

ob-serve droughts in the forested zone where the in situ obser-vations were made.

3.2 Impact of assimilation of ASCAT soil moisture in SiBCASA on carbon fluxes

The changes in soil moisture in springtime and during drought, induced by the assimilation of ASCAT observed soil moisture in SiBCASA (Sect. 3.1, Figs. 5–8), may have substantial effects on the representation of the carbon fluxes, which we will look at next. We will show separately how GPP, TER, and NEE depend on the change in soil moisture and the season.

[image:11.612.48.285.297.418.2]
(12)
[image:12.612.132.468.69.307.2]

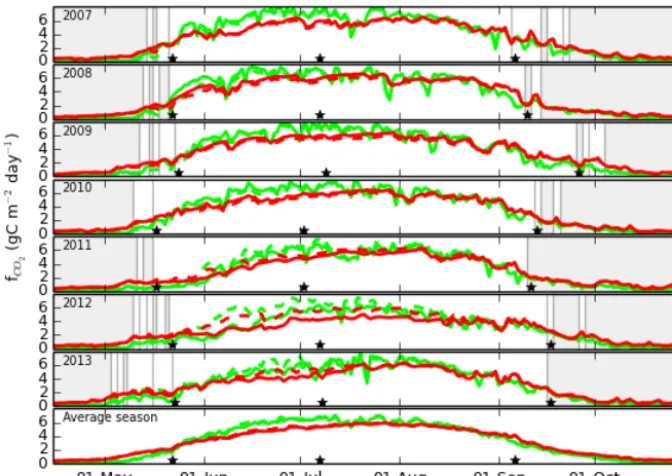
Figure 10. GPP (green) and TER (red) simulated with SiBCASA without (solid lines) and with assimilation (dashed lines) of ASCAT soil

moisture for Yakutsk Larix.

layer thaws deeper, resulting in a larger plant-available wa-ter fraction, reducing the drought sensitivity. This explains the smaller change in GPP in the summer. In the fall, GPP is limited more by the lack of available sunlight than by water stress, explaining the absence of change in GPP with assimi-lation of satellite soil moisture data.

In a similar way, the change in TER (Fig. 10) does not only depend on the change in soil moisture with satellite soil moisture assimilation, but also in the absolute value of soil moisture (Fig. 1b) and temperature limitation on TER. In June, when the soil is still cold, the changes in TER are small. In July and August the changes in TER are larger than in GPP, because the soil is warm and TER is a function of ab-solute soil moisture change. In this example, the changes in GPP and TER have the same direction. Figure 1 shows that this is always the case when the soil moisture saturation frac-tion is below its minimum value of ∼60 %. Consequently, the changes in GPP and TER compensate each other partly in the NEE.

Accumulated over a year (Table 3), the changes in GPP, TER, and NEE are of the order of tens of gC m−2yr−1, amounting to a few percent of GPP and TER. For NEE how-ever, the changes can amount to tens of percent and a 7-year mean of−34 %. We note that the changes in GPP and TER are larger in Yakutsk than in Hyytiälä, Tver, and Elgeeii. This is because the plant-available water fraction is smaller in Yakutsk than for the other sites, creating a strong drought sensitivity, and because the change in soil moisture is larger. While the relative changes in GPP and TER for these sites is generally small, and they partly compensate, the 7-year mean

changes in NEE are+52 % at Hyytiälä,−105 % at Tver, and −38 % at Elgeeii.

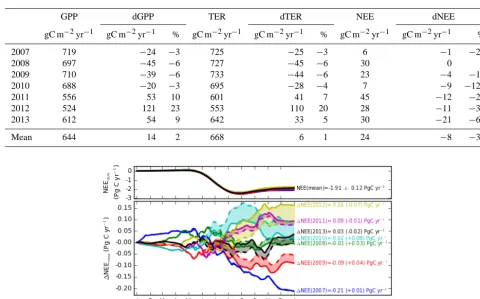
The effects of ASCAT soil moisture assimilation in SiB-CASA are also significant when integrated over the en-tire study domain (27.8×10⁶km2) and the year (Fig. 11). The mean simulated NEE is−1.91 PgC yr−1with an inter-annual variation of 0.12 PgC yr−1 (RMSD). Assimilation of ASCAT soil moisture in SiBCASA causes a change of 0.045 PgC yr−1 (RMSD). This is 41 % of the normal inter-annual variation of 0.11 PgC yr−1(RMSD), and 2.4 % of the mean NEE. The effect of satellite soil moisture assimilation is negligible until May; it then grows in the months June and July. After August, the net effect does not change much. This is in line with the observation that the effect of assimilation on soil moisture and carbon fluxes is largest in springtime (Sects. 3.1 and 3.2, Figs. 5–8 and 10). The effect of assimi-lation was largest in 2010 with an extra anomaly in NEE of +0.08 PgC yr−1(less uptake). This anomaly grew between May and September. In this year, a widespread drought oc-curred in European Russia and West Siberia, which ASCAT captures quite well. The assimilation effect could have been even larger if ASCAT had not wrongfully detected a wet anomaly over far eastern Siberia, where SiBCASA simulates a second drought region (Fig. 9).

(13)
[image:13.612.58.538.89.388.2]

Table 3. GPP, TER, and NEE in SiBCASA without ASCAT soil moisture assimilation, and the changes dGPP, dTER, dNEE with assimilation

for the site Yakutsk Larix.

GPP dGPP TER dTER NEE dNEE

gC m−2yr−1 gC m−2yr−1 % gC m−2yr−1 gC m−2yr−1 % gC m−2yr−1 gC m−2yr−1 %

2007 719 −24 −3 725 −25 −3 6 −1 −22

2008 697 −45 −6 727 −45 −6 30 0 0

2009 710 −39 −6 733 −44 −6 23 −4 −19

2010 688 −20 −3 695 −28 −4 7 −9 −123

2011 556 53 10 601 41 7 45 −12 −27

2012 524 121 23 553 110 20 28 −11 −38

2013 612 54 9 642 33 5 30 −21 −68

Mean 644 14 2 668 6 1 24 −8 −34

Figure 11. Top panel: cumulative NEE in Boreal Eurasia for the years 2007 to 2013 according to SiBCASA without assimilation of

satellite-observed soil moisture. The text describes the 7-year mean NEE and the inter-annual variation (as standard deviation). Bottom panel: cumu-lative NEE anomaly recumu-lative to the 7-year mean. Solid lines represent the SiBCASA NEE anomaly (1NEE) without assimilation of ASCAT soil moisture, dashed lines represent the NEE anomaly with assimilation of ASCAT soil moisture. The text behind the lines describes the NEE anomaly relative to the inter-annual mean NEE and in parentheses the change caused by assimilation of ASCAT soil moisture.

4 Discussion 4.1 Soil moisture

The spatial and temporal correlation coefficients between SiBCASA and satellite-observed soil moisture shown in Sect. 3 suggest that ASCAT and passive microwave satel-lite signals have a certain skill in observing land surface soil moisture. The absence of perfect correlations implies that as-similating the satellite-observed soil moisture in SiBCASA will have an effect. The question is whether that effect is an improvement.

The performance of passive microwave data was low over the entire study region and in all months (Fig. 2, Sect. 3.1). Only in steppe regions were the temporal correlations large (r=0.8). The spatial correlation is smaller than that (r∼0.5) and with a smaller sensitivity (a slope of∼1 : 3, Fig. 2), prob-ably because of the absence of significant spatial patterns in the small extent of the steppe zone. The poor performance of the microwave soil moisture in Boreal Eurasia is not entirely surprising: the passive microwave radiation emitted by the

soil moisture is known to be disturbed by vegetation, surface water, snow, and ice (de Jeu et al., 2008; Mladenova et al., 2014; Champagne et al., 2010), which are abundant in Bo-real Eurasia. The microwave soil moisture product has been validated extensively (Miralles, 2011; Miralles et al., 2011b; de Jeu et al., 2008; Liu et al., 2011, 2012; Owe et al., 2008; Griesfeller et al., 2016; Champagne et al., 2010). However, the vast majority of the validation sites were located on grass-lands and cropgrass-lands, and in temperate and (semi)arid climate zones. Therefore, the poor performance of microwave soil moisture in Boreal Eurasia, except perhaps the steppe zone, is probably related to the canopy, which is too dense, as well as to the presence of snow, ice, and surface water. Our results are therefore specific to our region, and cannot be simply ex-trapolated to other climate zones and land covers.

(14)

differ-models. However, even in the northern tundra regions most snow and ice have disappeared by June. Considering that the grid cells with frozen top soil in SiBCASA and snow/ice de-tection in ASCAT have been excluded from the statistical analysis, the lower correlations in June, July, and Septem-ber (Fig. 3) are probably not only caused by the presence of snow and ice on the land surface.

Other important changes from May to July are the expan-sion of leafs, the drying out of the topsoil after snowmelt on frozen ground, and the deeper thawing of the permafrost active layer. The increase of the leaf area index (LAI) does not seem beneficial for better satellite soil moisture retrievals, as is also suggest by the smaller correlation coefficients for forests than for steppe zone (Fig. 3). The decrease in the ponded area fraction after snowmelt on frozen ground is a po-tential explanation for the improving correlation coefficients (Högström et al., 2014), since they occur particularly in the forest and the tundra zones, which contain the wettest parts of the region, and not for the steppe zone, which is drier and outside the permafrost zone.

With the same arguments the increasing depth of the per-mafrost ice front may also be a potential explanation of the improving spatial correlation coefficients towards August. Indeed, ice and frozen soil at some depth may disturb the satellite signal (Way et al., 1997; Wegmüller, 1990). Max-imum active layer thicknesses of a mere 10–20 cm are not uncommon in the northern tundra, although the penetration depth of microwave radiation in the soil is of the order of one to a few centimetres.

It is interesting that the spatial correlation coefficients for steppe zones are larger and for tundra zones smaller than av-erage. Both steppe and tundra vegetation are characterized by short vegetation, but tundra regions are generally much wet-ter than steppe regions and with continuous permafrost. This implies that the presence of short vegetation alone is not the only prerequisite to obtain a good match between SiBCASA and ASCAT soil moisture.

On the site level, Figs. 5–8 show that ASCAT soil mois-ture has much more day-to-day variability than SiBCASA soil moisture. While SiBCASA soil moisture has a signifi-cant, physically meaningful auto-correlation with lag times up to 10–17 days (r >0.3), ASCAT observations and associ-ated errors are independent in time, which indicates that the signal is compromised by measurement noise. On top of this, ASCAT was not able to detect the eight large drought occur-rences observed in situ soil moisture time series, nor the pro-nounced inter-annual variation associated with recovery after water logging in Yakutsk. This is reflected in small site-level

Seneviratne (2012). This suggests that SiBCASA soil mois-ture is more reliable than ASCAT soil moismois-ture at these sites. This is not entirely surprising, because Fig. 4 shows that the in situ observations were made at locations outside the area of high temporal correlations between SiBCASA and AS-CAT. However, it suggests that the low correlations outside the steppe zone are more likely to be due to poor performance of ASCAT soil moisture than to SiBCASA soil moisture. It is unfortunate that there were no in situ observations during the ASCAT period of operation to evaluate ASCAT observations in the core drought regions. Now the added-value of ASCAT observations remains limited, because of the remaining ques-tions about their accuracy.

On the positive side, in Figs. 5–8 we found a quite con-sistent pattern in springtime, which indicates that ASCAT soil moisture was larger than SiBCASA soil moisture, and assimilation seemed to improve the match with in situ ob-served soil moisture. Is this a realistic pattern? Experimental-ists confirm that ponding after snowmelt occurs on the sites. However, it is known that ASCAT soil moisture is unreliable when the footprint of the observation is (partially) covered with snow, ice, or surface water, which is likely to happen in springtime. At the same time, SiBCASA soil moisture in spring depends on the amount of snow accumulated in the winter, the time of snowmelt, the fate of the meltwater on frozen ground (runoff or ponding). Since it is hard to sim-ulate these processes correctly, also considering the coarse resolution of SiBCASA relative to dependency of these pro-cesses on topography, springtime soil moisture in SiBCASA may also be questioned. Nevertheless, this springtime under-estimation pattern is also observed at other steppe and for-est grid cells where the temporal correlations are large. Thus there are indications that the spring wetting with assimila-tion of ASCAT data in SiBCASA improves the soil moisture. Field workers (see author contributions) confirm the spring-time water logging and ponding at the four sites. High wa-ter tables during springtime are followed by drying out of the soil, depending on the weather conditions. The low soil moisture in SiBCASA could be caused by overestimation of the evapo-transpiration rates in the spring.

(15)
[image:15.612.100.495.68.257.2]

Figure 12. Variables possibly explaining the temporal correlation coefficient of SiBCASA and ASCAT soil moisture: (a) leaf area index; (b) aboveground carbon; (c) soil temperature; (d) top soil moisture in SiBCASA; (e) the uncertainty in ASCAT soil moisture; (f) the first soil

layer with frozen fraction larger than 5 %. Red colours represent tundra pixels, green ones forest pixels, and yellow dots steppe pixels. Ther represents the correlation coefficient between SiBCASA and ASCAT in all August days in the period of record (31 days×7 years). The four black marks indicate the characteristics of the four sites Hyytiälä (H), Tver (T), Yakutsk (Y) and Elgeeii (E).

in biomass has a negative relationship withrfor steppe, but not for forests and tundra zones. For forests, the relation-ship is, counterintuitively, positive. This may be explained by a cross-correlation between carbon in biomass and tem-perature: the forest biomass decreases towards the northern treeline, where temperatures are lower. Apparently, above-ground biomass itself does not necessarily disturb the satel-lite signal. Soil temperature has a positive relation with r, and there is no indication that the relationship saturates at higher temperatures. This is a somewhat puzzling observa-tion. We would have expected low correlation coefficients at low temperatures, due to the presence of snow and ice, but at temperatures higher than 10◦C the ice would have dis-appeared, and we would not have expected an increase in

rwith temperature. Possibly, higher temperatures are indica-tive of a longer period into the local growing season, when soil ponding has diminished after snowmelt and the perfor-mance of SiBCASA is consequently better. This is confirmed by the negative relation between top soil moisture in SiB-CASA withr. At large soil moisture contents, the chance of (partial) ponding is larger, with subsequent disturbances of the satellite signal (see Naeimi et al., 2012b; Högström et al., 2014; but also Griesfeller et al., 2016). The correlation coefficients between SiBCASA and ASCAT are best when the error estimate of the retrieved ASCAT soil moisture is smaller than 10−1m3m−3. Finally, the top most soil layer which contains ice is a poor predictor of r. Where the first layer is frozen, the r are indeed near 0, but all other grid points have ice only much deeper than the eighth soil layer, and there is no relation with r. This essentially means that permafrost does not disturb the satellite signal in August in

Siberia. The characteristics of the four field sites are indi-cated by black marks in Fig. 12. This shows that the perfor-mance at the Yakutsk and Elgeeii sites may be expected to be low, because of the large LAI, low temperatures, and rela-tively large soil moisture. At the Tver and Hyytiälä sites, the expected performance is better, although the Tver site per-forms below average. We can only guess what might explain this difference. The region around the Tver site is quite het-erogeneous, with a mixture of Spruce and deciduous forests and peat bogs, rivers and Lake Seliger. Perhaps the LAI is in reality larger than SiBCASA predicts, and the satellite re-trieval is hampered by surface water.

In conclusion, (partial) ponding of the soil appears to be a good potential explanation of why the poor performance of ASCAT soil moisture improves into the summer months in Boreal Eurasia. The presence of dense leafs rather than aboveground biomass disturbs the satellite signal.

4.2 Carbon effects

(16)

in the Supplement (Fig. S4).

The effect of changing soil moisture on GPP is largest in SiBCASA when the plant-available water fraction is smaller than 0.3. The area where this occurs is confined to the steppe zone in Southwest Siberia in South European Russia, where it is dry and in the northeast Siberian forest zone, where wa-ter availability is limited by permafrost. If the drought stress function in Fig. 1a were to be defined more linearly, the ef-fects of soil moisture would be spread more evenly over the study domain. Note that it may not be realistic to prescribe identical water stress formulations for all biome types, as SiBCASA does. Furthermore, Fig. 10 shows that the drought sensitivity in Fig. 1 only represents the potential drought sen-sitivity. The actual sensitivity of GPP to change in soil mois-ture also depends on the temperamois-ture, radiation, and vapour pressure deficit (Fig. 10). This applies to TER in a similar way too. As a result, changes in NEE are not linearly depen-dent on the change in soil moisture due to assimilation of satellite observed soil moisture. Consequently, local effects may be much larger than 2 % of the mean annual NEE. Fur-thermore, Ohta et al. (2014) show that, in reality, water log-ging at high plant-available water fractions may also reduce photosynthesis rates and affect the water use efficiency.

5 Conclusions

The spatial and temporal correlation between SiBCASA and ASCAT soil moisture are considerable in the summer period and the steppe zone. However, ASCAT-derived soil moisture fails to detect the eight major droughts observed in situ at four sites during 7 years, while SiBCASA reproduces half of those droughts. At site level, temporal correlations between SiBCASA and in situ observed soil moisture are larger than between SiBCASA and ASCAT soil moisture. These facts suggest that SiBCASA soil moisture is more reliable than ASCAT soil moisture at those four locations and that assim-ilation of ASCAT soil moisture does not improve SiBCASA soil moisture.

The temporal correlation between SiBCASA and ASCAT soil moisture is best in the steppe zone, and in a selection of forest locations where LAI is low, soil temperature is high, and soil moisture is low (Fig. 12). Unfortunately, we do not have ground observations to prove whether assimilation in such conditions would lead to improved soil moisture in SiB-CASA.

There is evidence that assimilation of ASCAT soil mois-ture improves the match of SiBCASA soil moismois-ture with in

of percent of annual NEE, and integrated over the entire re-gion, the changes cause changes of the order of half the inter-annual variability in NEE or 2 % of inter-annual NEE.

Ultimately, this study shows that assimilation of satellite-observed soil moisture in vegetation models potentially has large impacts on the simulated carbon fluxes, but that further research is needed to clarify when, where, and in which con-ditions assimilation leads to more reliable soil moisture sim-ulations. In the near future, important improvements in the quality and spatial resolution of soil moisture are expected to be realized with the SMAP L-band instrument and Sentinel-1. Additionally, the benefit of more advanced assimilation techniques, e.g. by assimilating low-pass filtered satellite sig-nals, may be investigated.

The Supplement related to this article is available online at doi:10.5194/hess-20-605-2016-supplement.

Author contributions. M. K. van der Molen implemented the as-similation scheme and performed the model runs and analysis to-gether with I. R. van der Velde. R. A. M. de Jeu and W. Wagner contributed by discussing the reliability of the satellite-observed soil moisture data. W. Peters and M. C. Krol contributed by discussing the research plan and results. The in situ soil moisture observa-tions were collected and provided by P. Kolari (Hyytiälä), J. Kur-batova, A. Varlagin (Tver), T. C. Maximov, A. V. Kononov, T. Ohta, A. Kotani (Yakutsk and Elgeeii), who also contributed by discussing the reliability of the in situ observations.

Acknowledgements. The research on which this publication is based has been partly funded by the Dutch Organization for Scientific Research (NWO) under grant number 864.08.012 (VIDI WP “A multiple constraint data assimilation system for the carbon cycle”). J. Kurbatova and A. Varlagin, and the in situ observations in Tver were funded by the Russian Science Foundation, Grant 14-27-00065.

(17)

References

Baldocchi, D., Falge, E., Gu, L. H., Olson, R., Hollinger, D., Running, S., Anthoni, P., Bernhofer, C., Davis, K., Evans, R., Fuentes, J., Goldstein, A., Katul, G., Law, B., Lee, X. H., Malhi, Y., Meyers, T., Munger, W., Oechel, W., U, K. T. P., Pilegaard, K., Schmid, H. P., Valentini, R., Verma, S., Vesala, T., Wilson, K., and Wofsy, S.: FLUXNET: A new tool to study the tempo-ral and spatial variability of ecosystem-scale carbon dioxide, wa-ter vapor, and energy flux densities, B. Am. Meteorol. Soc., 82, 2415–2434, 2001.

Bartalis, Z., Wagner, W., Naeimi, V., Hasenauer, S., Sci-pal, K., Bonekamp, H., Figa, J., and Anderson, C.: Ini-tial soil moisture retrievals from the METOP-A Advanced Scatterometer (ASCAT), Geophys. Res. Lett., 34, L20401, doi:10.1029/2007gl031088, 2007.

Champagne, C., Berg, A., Belanger, J., McNairn, H., and De Jeu, R.: Evaluation of soil moisture derived from passive microwave remote sensing over agricultural sites in Canada using ground-based soil moisture monitoring networks, Int. J. Remote Sens., 31, 3669–3690, doi:10.1080/01431161.2010.483485, 2010. Chen, Y., Yang, K., Qin, J., Zhao, L., Tang, W., and Han,

M.: Evaluation of AMSR-E retrievals and GLDAS simulations against observations of a soil moisture network on the cen-tral Tibetan Plateau, J. Geophys. Res.-Atmos., 118, 4466–4475, doi:10.1002/jgrd.50301, 2013.

Ciais, P., Reichstein, M., Viovy, N., Granier, A., Ogee, J., Al-lard, V., Aubinet, M., Buchmann, N., Bernhofer, C., Carrara, A., Chevallier, F., De Noblet, N., Friend, A. D., Friedlingstein, P., Grunwald, T., Heinesch, B., Keronen, P., Knohl, A., Krin-ner, G., Loustau, D., Manca, G., Matteucci, G., Miglietta, F., Ourcival, J. M., Papale, D., Pilegaard, K., Rambal, S., Seufert, G., Soussana, J. F., Sanz, M. J., Schulze, E. D., Vesala, T., and Valentini, R.: Europe-wide reduction in primary productivity caused by the heat and drought in 2003, Nature, 437, 529–533, doi:10.1038/nature03972, 2005.

Collatz, G. J., Ball, J. T., Grivet, C., and Berry, J. A.: Physiologi-cal and environmental regulation of stomatal conductance, pho-tosynthesis and transpiration: a model that includes a laminar boundary layer, Agr. Forest Meteorol., 54, 107–136, 1991. Dai, A.: Drought under global warming: A review,

Wi-ley Interdisciplinary Reviews: Climate Change, 2, 45–65, doi:10.1002/wcc.81, 2011.

De Jeu, R. A. M. and Owe, M.: Further validation of a new methodology for surface moisture and vegetation op-tical depth retrieval, Int. J. Remote Sens., 24, 4559–4578, doi:10.1080/0143116031000095934, 2003.

de Jeu, R. A. M., Wagner, W., Holmes, T., Dolman, A., van de Giesen, N., and Friesen, J.: Global Soil Moisture Patterns Ob-served by Space Borne Microwave Radiometers and Scatterom-eters, Surv. Geophys., 29, 399–420, doi:10.1007/s10712-008-9044-0, 2008.

De Jeu, R. A. M., Holmes, T. R. H., Panciera, R., and Walker, J. P.: Parameterization of the land parameter retrieval model for L-band observations using the NAFE’05 data set, IEEE Geosci. Remote Sens. Lett., 6, 630–634, doi:10.1109/lgrs.2009.2019607, 2009.

de Wit, A. J. W. and van Diepen, C. A.: Crop model data as-similation with the Ensemble Kalman filter for improving

re-gional crop yield forecasts, Agr. Forest Meteorol., 146, 38–56, doi:10.1016/j.agrformet.2007.05.004, 2007.

Dolman, A. J., Maximov, T. C., Moors, E. J., Maximov, A. P., El-bers, J. A., Kononov, A. V., Waterloo, M. J., and van der Molen, M. K.: Net ecosystem exchange of carbon dioxide and water of far eastern Siberian Larch (Larix cajanderii) on permafrost, Bio-geosciences, 1, 133–146, doi:10.5194/bg-1-133-2004, 2004. Dolman, A. J., Shvidenko, A., Schepaschenko, D., Ciais, P.,

Tchebakova, N., Chen, T., van der Molen, M. K., Belelli March-esini, L., Maximov, T. C., Maksyutov, S., and Schulze, E.-D.: An estimate of the terrestrial carbon budget of Russia using inventory-based, eddy covariance and inversion methods, Bio-geosciences, 9, 5323–5340, doi:10.5194/bg-9-5323-2012, 2012. Draper, C. S., Mahfouf, J. F., and Walker, J. P.: An EKF assimilation of AMSR-E soil moisture into the ISBA land surface scheme, J. Geophys. Res.-Atmos., 114, D20104, doi:10.1029/2008jd011650, 2009a.

Draper, C. S., Walker, J. P., Steinle, P. J., de Jeu, R. A. M., and Holmes, T. R. H.: An evaluation of AMSR-E derived soil moisture over Australia, Remote Sens. Environ., 113, 703–710, doi:10.1016/j.rse.2008.11.011, 2009b.

Entekhabi, D., Njoku, E. G., O’Neill, P. E., Kellogg, K. H., Crow, W. T., Edelstein, W. N., Entin, J. K., Goodman, S. D., Jackson, T. J., Johnson, J., Kimball, J., Piepmeier, J. R., Koster, R. D., Martin, N., McDonald, K. C., Moghaddam, M., Moran, S., Re-ichle, R., Shi, J. C., Spencer, M. W., Thurman, S. W., Tsang, L., and Van Zyl, J.: The soil moisture active passive (SMAP) mis-sion, Proc. IEEE, 98, 704–716, doi:10.1109/jproc.2010.2043918, 2010.

Farquhar, G. D. von Caemmerer, S., and Berry, J. A.: A bio-chemical model of photosynthetic CO2assimilation in leaves of C3 species, Planta, 149, 78–90, doi:10.1007/bf00386231, 1980. Goetz, S. J., MacK, M. C., Gurney, K. R., Randerson, J. T.,

and Houghton, R. A.: Ecosystem responses to recent climate change and fire disturbance at northern high latitudes: Observa-tions and model results contrasting northern Eurasia and North America, Environ. Res. Lett., 2, 045031, doi:10.1088/1748-9326/2/4/045031, 2007.

Griesfeller, A., Lahoz, W. A., d. Jeu, R. A. M., Dorigo, W., Hau-gen, L. E., Svendby, T. M., and Wagner, W.: Evaluation of satellite soil moisture products over Norway using ground-based observations, Int. J. Appl. Earth Obs. Geoinf., 45, 155–164, doi:10.1016/j.jag.2015.04.016, 2016.

Han, E., Crow, W. T., Holmes, T., and Bolten, J.: Bench-marking a soil moisture data assimilation system for agricul-tural drought monitoring, J. Hydrometeorol., 15, 1117–1134, doi:10.1175/jhm-d-13-0125.1, 2014.

Högström, E., Trofaier, A., Gouttevin, I., and Bartsch, A.: Assess-ing Seasonal Backscatter Variations with Respect to Uncertain-ties in Soil Moisture Retrieval in Siberian Tundra Regions, Re-mote Sensing, 6, 8718–8738, 2014.

Ilvesniemi, H., Pumpanen, J., Duursma, R., Hari, P., Keronen, P., Kolari, P., Kulmala, M., Mammarella, I., Nikinmaa, E., Rannik, Ü., Pohja, T., Siivola, E., and Vesala, T.: Water balance of a bo-real scots pine forest, Bobo-real Environ. Res., 15, 375–396, 2010. Imaoka, K., Kachi, M., Fujii, H., Murakami, H., Hori, M., Ono,

(18)

2 leaf photosynthesis and transpiration, Ann. Bot., 105, 431–442, doi:10.1093/aob/mcp292, 2010.

Kerr, Y. H., Waldteufel, P., Wigneron, J. P., Martinuzzi, J. M., Font, J., and Berger, M.: Soil moisture retrieval from space: The Soil Moisture and Ocean Salinity (SMOS) mission, IEEE T. Geosci. Remote Sens., 39, 1729–1735, doi:10.1109/36.942551, 2001. Kolari, P., Kulmala, L., Pumpanen, J., Launiainen, S., Llvesniemi,

H., Hari, P., and Nikinmaa, E.: CO2exchange and component CO2fluxes of a boreal Scots pine forest, Boreal Environ. Res., 14, 761–783, 2009.

Kotani, A., Kononov, A. V., Ohta, T., and Maximov, T. C.: Temporal variations in the linkage between the net ecosystem exchange of water vapour and CO2over boreal forests in eastern Siberia, Ecohydrology, 7, 209–225, 2014.

Krol, M. C., Peters, W., Hooghiemstra, P., George, M., Clerbaux, C., Hurtmans, D., McInerney, D., Sedano, F., Bergamaschi, P., El Hajj, M., Kaiser, J. W., Fisher, D., Yershov, V., and Muller, J. P.: How much CO was emitted by the 2010 fires around Moscow?, Atmos. Chem. Phys., 13, 4737–4747, doi:10.5194/acp-13-4737-2013, 2013.

Kurbatova, J., Li, C., Varlagin, A., Xiao, X., and Vygodskaya, N.: Modeling carbon dynamics in two adjacent spruce forests with different soil conditions in Russia, Biogeosciences, 5, 969–980, doi:10.5194/bg-5-969-2008, 2008.

Liu, Y. Y., van Dijk, A., de Jeu, R. A. M., and Holmes, T. R. H.: An analysis of spatiotemporal variations of soil and vegetation moisture from a 29-year satellite-derived data set over mainland Australia, Water Resour. Res., 45, W07405, doi:10.1029/2008wr007187, 2009.

Liu, Y. Y., Parinussa, R. M., Dorigo, W. A., De Jeu, R. A. M., Wagner, W., M. Van Dijk, A. I. J., McCabe, M. F., and Evans, J. P.: Developing an improved soil moisture dataset by blending passive and active microwave satellite-based retrievals, Hydrol. Earth Syst. Sci., 15, 425–436, doi:10.5194/hess-15-425-2011, 2011.

Liu, Y. Y., Dorigo, W. A., Parinussa, R. M., De Jeu, R. A. M., Wagner, W., McCabe, M. F., Evans, J. P., and Van Dijk, A. I. J. M.: Trend-preserving blending of passive and active microwave soil moisture retrievals, Remote Sens. Environ., 123, 280–297, doi:10.1016/j.rse.2012.03.014, 2012.

Mammarella, I., Launiainen, S., Gronholm, T., Keronen, P., Pumpa-nen, J., Rannik, Ü., and Vesala, T.: Relative humidity effect on the high-frequency attenuation of water vapor flux measured by a closed-path eddy covariance system, J. Atmos. Ocean. Tech., 26, 1856–1866, doi:10.1175/2009jtecha1179.1, 2009.

McGuire, A. D., Anderson, L. G., Christensen, T. R., Scott, D., Laodong, G., Hayes, D. J., Martin, H., Lorenson, T. D., Mac-donald, R. W., and Nigel, R.: Sensitivity of the carbon cycle in the Arctic to climate change, Ecol. Monogr., 79, 523–555, doi:10.1890/08-2025.1, 2009.

Miralles, D. G., De Jeu, R. A. M., Gash, J. H., Holmes, T. R. H., and Dolman, A. J.: Magnitude and variability of land evaporation and its components at the global scale, Hydrol. Earth Syst. Sci., 15, 967–981, doi:10.5194/hess-15-967-2011, 2011a.

Miralles, D. G., Holmes, T. R. H., De Jeu, R. A. M., Gash, J. H., Meesters, A. G. C. A., and Dolman, A. J.: Global land-surface evaporation estimated from satellite-based observations, Hydrol. Earth Syst. Sci., 15, 453–469, doi:10.5194/hess-15-453-2011, 2011b.

Miralles, D. G., Teuling, A. J., Van Heerwaarden, C. C., and De Arellano, J. V. G.: Mega-heatwave temperatures due to com-bined soil desiccation and atmospheric heat accumulation, Nat. Geosci., 7, 345–349, doi:10.1038/ngeo2141, 2014.

Mittelbach, H. and Seneviratne, S. I.: A new perspective on the spatio-temporal variability of soil moisture: temporal dynamics versus time-invariant contributions, Hydrol. Earth Syst. Sci., 16, 2169–2179, doi:10.5194/hess-16-2169-2012, 2012.

Mladenova, I. E., Jackson, T. J., Njoku, E., Bindlish, R., Chan, S., Cosh, M. H., Holmes, T. R. H., de Jeu, R. A. M., Jones, L., Kimball, J., Paloscia, S., and Santi, E.: Remote moni-toring of soil moisture using passive microwave-based tech-niques – Theoretical basis and overview of selected algo-rithms for AMSR-E, Remote Sens. Environ., 144, 197–213, doi:10.1016/j.rse.2014.01.013, 2014.

Moffat, A. M., Papale, D., Reichstein, M., Hollinger, D. Y., Richard-son, A. D., Barr, A. G., Beckstein, C., Braswell, B. H., Churkina, G., Desai, A. R., Falge, E., Gove, J. H., Heimann, M., Hui, D., Jarvis, A. J., Kattge, J., Noormets, A., and Stauch, V. J.: Com-prehensive comparison of gap-filling techniques for eddy covari-ance net carbon fluxes, Agr. Forest Meteorol., 147, 209–232, doi:10.1016/j.agrformet.2007.08.011, 2007.

Morales, P., Sykes, M. T., Prentice, I. C., Smith, P., Smith, B., Bugmann, H., Zierl, B., Friedlingstein, P., Viovy, N., Sabaté, S., Sánchez, A., Pla, E., Gracia, C. A., Sitch, S., Arneth, A., and Ogee, J.: Comparing and evaluating process-based ecosys-tem model predictions of carbon and water fluxes in major European forest biomes, Global Change Biol., 11, 2211–2233, doi:10.1111/j.1365-2486.2005.01036.x, 2005.

Muskett, R. R. and Romanovsky, V. E.: Groundwater stor-age changes in arctic permafrost watersheds from GRACE and insitu measurements, Environ. Res. Lett., 4, 045009, doi:10.1088/1748-9326/4/4/045009, 2009.

Naeimi, V., Scipal, K., Bartalis, Z., Hasenauer, S., and Wagner, W.: An Improved Soil Moisture Retrieval Algorithm for ERS and METOP Scatterometer Observations, IEEE T. Geosci. Remote, 47, 1999–2013, doi:10.1109/tgrs.2008.2011617, 2009.

(19)

threshold-analysis algorithm, IEEE T. Geosci. Remote, 50, 2566–2582, doi:10.1109/tgrs.2011.2177667, 2012a.

Naeimi, V., Paulik, C., Bartsch, A., Wagner, W., Kidd, R., Sang-Eun, P., Elger, K., and Boike, J.: ASCAT Surface State Flag (SSF): Extracting Information on Surface Freeze/Thaw Conditions From Backscatter Data Using an Empirical Threshold-Analysis Algorithm, IEEE T. Geosci. Remote, 50, 2566–2582, doi:10.1109/tgrs.2011.2177667, 2012b.

Ohta, T., Maximov, T. C., Dolman, A. J., Nakai, T., Molen, M. K. v. d., Kononov, A. V., Maximov, T., Hiyama, T., Iijima, Y., Moors, E. J., and Tanaka, H.: Interannual variation of water bal-ance and summer evapotranspiration in an eastern Siberian larch forest over a 7-year period (1998–2006), Agr. Forest Meteorol., 148, 1941–1953, 2008.

Ohta, T., Kotani, A., Iijima, Y., Maximov, T. C., Ito, S., Hanamura, M., Kononov, A. V., and Maximov, A. P.: Effects of waterlogging on water and carbon dioxide fluxes and environmental variables in a Siberian larch forest, 1998–2011, Agr. Forest Meteorol., 188, 64–75, doi:10.1016/j.agrformet.2013.12.012, 2014.

Oki, T., Imaoka, K., and Kachi, M.: AMSR instruments on GCOM-W1/2: Concepts and applications, International Geoscience and Remote Sensing Symposium (IGARSS), Honolulu, Hawaii, USA, 1363–1366, 2010.

Owe, M., de Jeu, R., and Holmes, T.: Multisensor historical cli-matology of satellite-derived global land surface moisture, J. Geophys. Res.-Earth, 113, F01002, doi:10.1029/2007JF000769, 2008.

Papale, D., Reichstein, M., Aubinet, M., Canfora, E., Bernhofer, C., Kutsch, W., Longdoz, B., Rambal, S., Valentini, R., Vesala, T., and Yakir, D.: Towards a standardized processing of Net Ecosys-tem Exchange measured with eddy covariance technique: algo-rithms and uncertainty estimation, Biogeosciences, 3, 571–583, doi:10.5194/bg-3-571-2006, 2006.

Peters, W., Jacobson, A. R., Sweeney, C., Andrews, A. E., Con-way, T. J., Masarie, K., Miller, J. B., Bruhwiler, L. M. P., Petron, G., Hirsch, A. I., Worthy, D. E. J., van der Werf, G. R., Ran-derson, J. T., Wennberg, P. O., Krol, M. C., and Tans, P. P.: An atmospheric perspective on North American carbon dioxide ex-change: CarbonTracker, P. Natl. Acad. Sci. USA, 104, 18925– 18930, doi:10.1073/pnas.0708986104, 2007.

Peters, W., Krol, M. C., van der Werf, G. R., Houweling, S., Jones, C. D., Hughes, J., Schaefer, K., Masarie, K. A., Jacobson, A. R., Miller, J. B., Cho, C. H., Ramonet, M., Schmidt, M., Ciattaglia, L., Apadula, F., Helta, D., Meinhardt, F., di Sarra, A. G., Pi-acentino, S., Sferlazzo, D., Aalto, T., Hatakka, J., Strom, J., Haszpra, L., Meijer, H. A. J., van de Laan, S., Neubert, R. E. M., Jordan, A., Rodo, X., Morgui, J. A., Vermeulen, A. T., Popa, E., Rozanski, K., Zimnoch, M., Manning, A. C., Leuen-berger, M., Uglietti, C., Dolman, A. J., Ciais, P., Heimann, M., and Tans, P. P.: Seven years of recent European net terrestrial carbon dioxide exchange constrained by atmospheric observa-tions, Global Change Biol., 16, 1317–1337, doi:10.1111/j.1365-2486.2009.02078.x, 2010.

Potter, C. S., Randerson, J. T., Field, C. B., Matson, P. A., Vi-tousek, P. M., Mooney, H. A., and Klooster, S. A.: Terrestrial ecosystem production: A process model based on global satel-lite and surface data, Global Biogeochem. Cy., 7, 811–841, doi:10.1029/93gb02725, 1993.

Raich, J. W., Rastetter, E. B., Melillo, J. M., Kicklighter, D. W., Steudler, P. A., Peterson, B. J., Grace, A. L., Iii, B. M., and Vörösmarty, C. J.: Potential Net Primary Productivity in South America: Application of a Global Model, Ecol. Appl., 1, 399– 429, doi:10.2307/1941899, 1991.

Rannik, U., Keronen, P., Hari, P., and Vesala, T.: Estima-tion of forest-atmosphere CO2 exchange by eddy covariance and profile techniques, Agr. Forest Meteorol., 126, 141–155, doi:10.1016/j.agrformet.2004.06.010, 2004.

Reichle, R. H. and Koster, R. D.: Bias reduction in short records of satellite soil moisture, Geophys. Res. Lett., 31, L19501, doi:10.1029/2004gl020938, 2004.

Reichle, R. H., and Koster, R. D.: Global assimilation of satel-lite surface soil moisture retrievals into the NASA catch-ment land surface model, Geophys. Res. Lett., 32, 1–4, doi:10.1029/2004gl021700, 2005.

Reichle, R. H., Koster, R. D., Liu, P., Mahanama, S. P. P., Njoku, E. G., and Owe, M.: Comparison and assimilation of global soil moisture retrievals from the Advanced Mi-crowave Scanning Radiometer for the Earth Observing Sys-tem (AMSR-E) and the Scanning Multichannel Microwave Ra-diometer (SMMR), J. Geophys. Res.-Atmos., 112, D09108, doi:10.1029/2006jd008033, 2007.

Reichstein, M., Falge, E., Baldocchi, D., Papale, D., Aubinet, M., Berbigier, P., Bernhofer, C., Buchmann, N., Gilmanov, T., Granier, A., Grünwald, T., Havránková, K., Ilvesniemi, H., Janous, D., Knohl, A., Laurila, T., Lohila, A., Loustau, D., Mat-teucci, G., Meyers, T., Miglietta, F., Ourcival, J. M., Pumpanen, J., Rambal, S., Rotenberg, E., Sanz, M., Tenhunen, J., Seufert, G., Vaccari, F., Vesala, T., Yakir, D., and Valentini, R.: On the sep-aration of net ecosystem exchange into assimilation and ecosys-tem respiration: Review and improved algorithm, Global Change Biol., 11, 1424–1439, doi:10.1111/j.1365-2486.2005.001002.x, 2005.

Reichstein, M., Ciais, P., Papale, D., Valentini, R., Running, S., Viovy, N., Cramer, W., Granier, A., Ogee, J., Allard, V., Aubi-net, M., Bernhofer, C., Buchmann, N., Carrara, A., Grunwald, T., Heimann, M., Heinesch, B., Knohl, A., Kutsch, W., Loustau, D., Manca, G., Matteucci, G., Miglietta, F., Ourcival, J. M., Pile-gaard, K., Pumpanen, J., Rambal, S., Schaphoff, S., Seufert, G., Soussana, J. F., Sanz, M. J., Vesala, T., and Zhao, M.: Reduction of ecosystem productivity and respiration during the European summer 2003 climate anomaly: a joint flux tower, remote sens-ing and modellsens-ing analysis, Global Change Biol., 13, 634–651, doi:10.1111/j.1365-2486.2006.01224.x, 2007.

Robock, A., Vinnikov, K. Y., Srinivasan, G., Entin, J. K., Hollinger, S. E., Speranskaya, N. A., Liu, S., and Namkhai, A.: The Global Soil Moisture Data Bank, B. Am. Meteorol. Soc., 81, 1281– 1299, 2000.

Schaefer, K., Collatz, G. J., Tans, P., Denning, A. S., Baker, I., Berry, J., Prihodko, L., Suits, N., and Philpott, A.: Com-bined simple biosphere/carnegie-ames-stanford approach ter-restrial carbon cycle model, J. Geophys. Res.-Biogeo., 113, G03034, doi:10.1029/2007jg000603, 2008.

(20)

van der Molen, M. K., Dolman, A. J., Ciais, P., Eglin, T., Gob-ron, N., Law, B. E., Meir, P., Peters, W., Phillips, O. L., Reich-stein, M., Chen, T., Dekker, S. C., Doubková, M., Friedl, M. A., Jung, M., van den Hurk, B. J. J. M., de Jeu, R. A. M., Kruijt, B., Ohta, T., Rebel, K. T., Plummer, S., Seneviratne, S. I., Sitch, S., Teuling, A. J., van der Werf, G. R., and Wang, G.: Drought and ecosystem carbon cycling, Agr. Forest Meteorol., 151, 765–773, 2011.

van der Velde, I. R., Miller, J. B., Schaefer, K., van der Werf, G. R., Krol, M. C., and Peters, W.: Terrestrial cycling of13CO2by photosynthesis, respiration, and biomass burning in SiBCASA, Biogeosciences, 11, 6553–6571, doi:10.5194/bg-11-6553-2014, 2014.

Verhoef, A. and Egea, G.: Modeling plant transpiration under limited soil water: Comparison of different plant and soil hy-draulic parameterizations and preliminary implications for their use in land surface models, Agr. Forest Meteorol., 191, 22–32, doi:10.1016/j.agrformet.2014.02.009, 2014.

Verstraeten, W. W., Veroustraete, F., Wagner, W., van Roey, T., Heyns, W., Verbeiren, S., and Feyen, J.: Remotely sensed soil moisture integration in an ecosystem carbon flux model. The spatial implication, Climatic Change, 103, 117–136, doi:10.1007/s10584-010-9920-8, 2010.

mass variations from GRACE in central Siberia, J. Geodesy, 87, 287–299, doi:10.1007/s00190-012-0597-9, 2013.

Wagner, W., Lemoine, G., and Rott, H.: A method for es-timating soil moisture from ERS Scatterometer and soil data, Remote Sens. Environ., 70, 191–207, doi:10.1016/s0034-4257(99)00036-x, 1999.

Way, J., Zimmermann, R., Rignot, E., McDonald, K., and Oren, R.: Winter and spring thaw as observed with imaging radar at BOREAS, J. Geophys. Res.-Atmos., 102, 29673–29684, doi:10.1029/96jd03878, 1997.

Wegmüller, U.: The effect of freezing and thawing on the mi-crowave signatures of bare soil, Remote Sens. Environ., 33, 123– 135, doi:10.1016/0034-4257(90)90038-N, 1990.

Figure

Figure 1. (a) The water stress function in SiBCASA as a function of plant available water fraction
Table 1. Characteristics of the flux tower sites used in this study.
Figure 2. Soil moisture anomalies in August 2009 with respect to the average soil moisture in the months August 2007–2011.anomaly in SiBCASA, ASCAT and passive microwave soil moisture.SiBCASA soil moisture; each point represents one grid point in the maps
Figure 3. The seasonal variation of the spatial correlation coef-ficient of SiBCASA and ASCAT soil moisture for all grid cells(black x), tundra cells (red *), forest (green triangles), and steppe(brown diamonds)
+7

References

Related documents

3: The effect of PTU-exposure (1.5, 3, and 6 ppm) and levothyroxine therapy (Hypo 6 ppm + Levo) on the distance moved (A) and the escape latency (B) of the male

Мөн БЗДүүргийн нохойн уушгины жижиг гуурсанцрын хучуур эсийн болон гөлгөр булчингийн ширхгийн гиперплази (4-р зураг), Чингэлтэй дүүргийн нохойн уушгинд том

In Shatzer v. Maryland, the Court created an expiration date for invocations of the Fifth Amendment right to counsel: after a suspect in custodial interrogation invokes

Some of the studies conducted on diagnostic assessment centred on using diagnostic classroom assessment (Ciofalo and Wylie 2006), the relationship between students’

report.. Mathematis science and girls : can we close the gender gap. A Journal of culture and African women studies. outsiders within : expriences of kenyan women in higher

However, speaking to children themselves raises nu- merous issues [7], including the developmental capacity of children to understand the questions being asked [8]; their legal

Here, we include a temporal discretisation of past ice-sheet fluctuations with a moving time window that allows us to calculate RSL as a function of the total ice-sheet volume