https://doi.org/10.5194/hess-23-4509-2019 © Author(s) 2019. This work is distributed under the Creative Commons Attribution 4.0 License.
Small dams alter thermal regimes of downstream water
André Chandesris1, Kris Van Looy2, Jacob S. Diamond1,3, and Yves Souchon1
1River Hydro-Ecology Lab, National Research Institute of Science and Technology for Environment and Agriculture, UR Riverly, Lyon, France
2OVAM, Stationsstraat 110, 2800 Mechelen, Belgium
3Université de Tours, E.A 6293 GéoHydrosytèmes COntinentaux, Parc de Grandmont, 37200 Tours, France Correspondence:André Chandesris (andre.chandesris@irstea.fr)
Received: 28 March 2019 – Discussion started: 9 April 2019
Revised: 27 September 2019 – Accepted: 3 October 2019 – Published: 5 November 2019
Abstract. The purpose of this study was to quantify the downstream impacts of different types of small dams on summer water temperature in lowland streams. We examined (1) temperature regimes upstream and downstream of dams with different structural characteristics, (2) relationships be-tween stream temperature anomalies and climatic variables, watershed area, dam height, impoundment length and surface area, and residence time, (3) the most significant variables explaining the different thermal behaviors, and (4) the dam thermal effect considering a biological threshold of 22◦C, with a calculation of both the number of days with a temper-ature above this threshold and the average hourly duration above this threshold.
Water temperature loggers were installed upstream and downstream of 11 dams in the Bresse region (France) and monitored at 30 min intervals during summer (June to September) over the 2009–2016 period, resulting in 13 paired water temperature time series (two sites were monitored for two summers, allowing the opportunity to compare cold and hot summers).
At 23 % of the dams, we observed increased downstream maximum daily temperatures of more than 1◦C; at the re-maining dams we observed changes in the maximum daily temperature of −1 to 1◦C. Across sites, the mean down-stream increase of the minimum daily temperature was 1◦C, and for 85 % of the sites this increase was higher than 0.5◦C. We hierarchically clustered the sites based on three tem-perature anomaly variables: upstream–downstream differ-ences in (1) maximum daily temperature (1Tmax), (2) min-imum daily temperature (1Tmin), and (3) daily temperature amplitude (1Tamp). The cluster analysis identified two main types of dam effects on thermal regime: (1) a downstream
increase in Tmin associated with Tmax either unchanged or slightly reduced for impoundments of low volume (i.e., a residence time shorter than 0.7 d and a surface area less than 35 000 m2), and (2) a downstream increase of bothTmin andTmaxof the same order of magnitude for impoundments of larger volume (i.e., a residence time longer than 0.7 d and a surface area greater than 35 000 m2). These downstream tem-perature increases reached 2.4◦C at certain structures with the potential to impair the structure of aquatic communities and the functioning of the aquatic ecosystem.
Overall, we show that small dams can meaningfully al-ter the thermal regimes of flowing waal-ters, and that these that these effects can be explained with sufficient accuracy (R2=0.7) using two simple measurements of small dam physical attributes. This finding may have importance for modelers and managers who desire to understand and restore the fragmented thermalscapes of river networks.
1 Introduction
1.1 Temperature is a master physical variable in streams
for a review on cold-water fish; Souchon and Tissot, 2012 for a review on European non-salmonid fish). Water temperature also governs the life history of invertebrates by affecting egg development, fecundity, dormancy, growth, maturation, vol-tinism, and emergence (Rader et al., 2007). Therefore, under-standing the river thermal regime is crucial to underunder-standing ecological functioning (Hester et al., 2009), particularly in an era of global warming (IPCC, 2007, 2013) and numerous ecological changes (Woodward et al., 2010).
1.2 Drivers of water temperature
Major natural drivers of water temperature are (1) climate, i.e., solar radiation, air temperature, wind, precipitation, up-stream water temperature, (2) topography, i.e., up-stream orien-tation, stream shading by surrounding vegeorien-tation, (3) stream bed characteristics, i.e., hyporheic exchanges, groundwater input, and (4) stream discharge (Caissie, 2006). These gov-erning physical variables can be used to identify the primary environmental determinants of a thermal regime for a given site (Caissie, 2006; Hannah et al., 2004; Kelleher et al., 2012; Mohseni et al., 1998; Webb et al., 2008). During summer, which is a particularly sensitive time for aquatic organisms, the factors leading to stream warming are (1) the input of heat fluxes from upstream (depending on discharge and wa-ter temperature), (2) direct and indirect solar radiation dom-inated by infrared radiation, (3) air–water conduction (vective heat flux or sensible heat), and (4) stream bed con-duction. The factors leading to cooling are (1) longwave ra-diation emitted by the water surface, (2) latent heat, and (3) the influx of groundwater. Importantly, the stream thermal regime may also be influenced by anthropogenic structures, with point-scale effects in the case of dams, or more spatially distributed effects in the case of riparian vegetation clearings. Hence, impacts can vary in spatial and temporal scope, de-pending on relative size effects of stream (headwater to river) versus human features (e.g., power plant reservoir volume; extent of vegetation clearings). Specifically, dams can mod-ify stream thermal regimes by altering heat storage volumes, and by increasing the contact surface of a stream with the atmosphere.
1.3 Large dam effects
The Hester and Doyle (2011) literature review reveals that the cooling effect of large dams (above 15 m high), where water is released downstream from cooler hypolimnetic lay-ers during stratified periods, is the most described worldwide. The serial discontinuity concept (SDC, Ward and Stanford, 1983) is largely based on this property of water cooling by large stratified impoundments. In the SDC framework, large dams can alter longitudinal downstream water temperature pattern for tens of kilometers depending on dam character-istics, flow regime, river physical charactercharacter-istics, and down-stream inputs of lakes, groundwater, and tributaries (Olden
and Naiman, 2010; Ellis and Jones, 2013 for a review). In ad-dition, Ward and Stanford (1983) suggest that dams in head-waters may not alter the natural temperature range, with the assumption that canopy shading, and springs or groundwa-ter influx can buffer annual temperature variations. However, this view may be incomplete, as downstream warming may occur during summer releases from small surface reservoirs (O’Keeffe et al., 1990).
1.4 Small dam characteristics are not well established
Although much is known regarding thermal effects of large dams, less is known about the impacts of small dams be-cause their spatial distribution and physical characteristics are not well established. This is especially true for run-of-the-river dams (RRDs) with little or no thermal stratification and the absence of surface releases (Cumming, 2004; Hayes et al., 2008). Due to the increased surface of the impound-ment exposed to solar radiation and decreased flow veloc-ity, RRDs are expected to increase downstream water tem-peratures, contrary to large dams with cold hypolimnion re-lease. These small dams have been built over many years for a variety of uses (e.g., mills, irrigation, livestock wa-tering, storm water management, aesthetic lakes, hydroelec-tricity, and stream stabilization). Moreover, in contrast to large dams, the number, spatial location, and characteris-tics of small dams are not well known or are often very imprecise depending on national databases. The Interna-tional Commission of Large Dams (ICOLD, 2017) invento-ried 59 071 large dams (i.e., a height of ≥15 m or a height of 5–15 m impounding more than 3×10⁶m3) in 160 coun-tries, but the number of smaller dams could be several mil-lion worldwide. In France alone, the Referentiel des Ob-stacles à l’Ecoulement des Eaux (the national inventory of dams and weirs) database maintained by the French Biodi-versity Agency inventoried 96 222 hydraulics works cross-ing streams and rivers as of September 2017. This corre-sponds to a density of 0.42 obstacles per kilometer on a ba-sis of 230 000 km streams with permanent flow. However, the complete characteristics of these hydraulic works are not yet quantified, and it is important to note that height alone is not sufficient to discriminate their environmental effects (Poff and Hart, 2002). Mbaka and Mwaniki (2015) proposed definitions for the different features, considering RRDs as impoundments with heights not exceeding the river bank ele-vation, small weirs (SW) corresponding to heights of around 5 m, and low-head dams (LHD) with heights of between 5 and 15 m. In this work, we studied dams with a height of less than 5 m, which we hereafter refer to as small dams.
1.5 Small dam thermal effects
Mwaniki (2015), in their global review of the downstream effect of small impoundments, found that out of 43 stud-ies, 25 % reported a temperature increase effect, 2 % noted a decrease effect, and 73 % observed no change. Dripps and Granger (2013) studied the influence of three res-idential artificial headwater lakes (17–45 ha) on stream (discharge=0.0024–0.0109 m3s−1) thermal regimes. They measured a summer downstream temperature increase of as much as 8.4◦C and a decrease of diurnal variability of as much as 3.9◦C. Maxted et al. (2005) found that impound-ments (height<5 m and surface area<1 ha) in rural catch-ments increased downstream mean daily stream temperatures by 3.1–6.6◦C during the critical summer period, and temper-ature differences were 3 times higher than those in woody catchments (0.8–2.0◦C). In the Laurentian Great Lakes re-gion, Hayes et al. (2008) studied two types of dams with dif-ferent uses. They measured a weak to no existent thermal effect of low-head barriers (height<0.5 m) built to prevent the upstream migration of sea lamprey (Petromyzon mari-nus, L.). Conversely, they measured a greater effect for small hydroelectric dams (downstream temperature increases of up to 5.6◦C). Analyzing the thermal effects of beaver dams, We-ber et al. (2017) found a complex and diverse range of tem-perature responses. Similarly, some authors find little to no thermal influence of beaver dams (Sigourney et al., 2006), and others find extreme temperature increases of up to 7◦C in a headwater passing through large (5 ha) beaver dam com-plexes (Margolis et al., 2001).
These studies illustrate the large variability in the down-stream responses to small dams, and the difficulty in iden-tifying the explanatory variables governing these responses, with dam height alone being a poor predictor. Nevertheless, several explanatory variables are clearly relevant, including stream size, stream order, watershed surface and vegetation cover, climate context, geology and alluvial aquifers, ground-water exchange, impoundment surface directly submitted to radiation, water residence time, and base flow discharge. Variability in the downstream responses appears to be greater in headwaters due to the weak thermal inertia and great di-versity of these waterbodies, especially with regard to local shading effects from riparian canopy cover and the relative importance of spring or tributary discharges.
1.6 Objective of the study
The purpose of this study was to quantify the downstream impacts of different types of small dams on the summer wa-ter temperature in lowland streams. We chose to examine the summer period because this is when stream temperatures reach maximum annual values with the corresponding high-est probability of reducing ecological functioning. We ex-amined the following: (1) temperature regimes upstream and downstream of dams with different structural characteristics, (2) relationships between upstream–downstream stream tem-perature anomalies and climatic variables, watershed
charac-teristics, and dam hydraulic geometry, (3) the most signifi-cant variables explaining the different thermal behaviors, in order to account for dam diversity and functioning in future climate, and (4) the dam thermal effect considering a biolog-ical threshold of 22◦C, with a calculation of both the number of days with a temperature above this threshold and the aver-age hourly duration above this threshold.
2 Methods 2.1 Study area
Our study area is an alluvial lowland plain northeast of Lyon, France, between the Jura and the northern Mas-sif Central mountain ranges (Fig. 1), at altitudes of be-tween 170 and 320 m. The main river in our study area is the Saone, which has a network of tributaries (Strahler orders 1–5) drained primarily by agricultural (67.4 %; French average=59.5 %) and urban land cover (7.2 %; French average=5.5 %) (UE-SOeS, CORINE Land Cover, available at: https://www.data.gouv.fr/fr/datasets/ corine-land-cover-occupation-des-sols-en-france/, last ac-cess: June 2019), characteristic of temperate European plain regions. The dam and weir density is 0.64 features per kilo-meter, which is 50 % greater than the French average of 0.42 features per kilometer for streams with permanent flow. The density of the stream network is comparable with that of the national average (0.4 km km−2).
The climate in our study area is cold continental, charac-terized by hot, dry summers (average maximum temperature of 25.8◦C) and cold winters (average maximum temperature of 5◦C). The average annual precipitation for the region is
900 mm. This region is distinguished climatically by maxi-mum median air temperatures in July (1960–1990 period) ex-ceeding 25.5◦C, which is equivalent to those of the Mediter-ranean region and of southwest France (Wasson et al., 2002). Regionalized climate projections on the scale of France (Pe-ings et al., 2012) indicated that this region is susceptible to higher summer air temperatures, with increases of 2–3◦C for maximum daily temperatures. For scenario A1B (mean concentration of greenhouse gases), the estimation was more than 10 additional days of heat waves (as defined by WMO, 1966) by 2050.
2.2 Sampling sites
Figure 1.Location of the study area, the Bresse region – the black points on the right map indicate temperature recording sites.
(French database HYDRO) that are weighted by a correc-tion coefficient during low flow periods. The correccorrec-tion coefficient is estimated from synoptic gauging performed by the regional hydrometric institute (Direction Regionale de l’Environnement, de l’Amenagement et du Logement, DREAL, 2018). Average residence times at our dams vary from 0.1 to 8.4 d (Table 1).
The structures studied differ considerably in impoundment surface area, residence time, and their position in the hydro-graphic network (Table 1). These variables govern (1) the input of diurnal heat from solar radiation, (2) the loss of noc-turnal heat linked to evaporation and emitted longwave radi-ation, and (3) the upstream permanent inflow of heat.
2.3 Temperature monitoring
The temperature sampling was performed in summer (from the end of June to the beginning of September) in different years (from 2009 to 2016) by the local water management organization (Syndicat Mixte Veyle Vivante). For two sites, we have data for two different summers (Champagne in 2009 and 2015 and Fretaz in 2014 and 2016) because the local water management organization was particularly interested in the thermal regimes of these rivers (Table 1).
We installed temperature sensors (Hobo® Pendant, On-set Computer Application; accuracy±0.54◦C) upstream and downstream of each dam. Upstream sensors were placed up-stream of the backwater flow length of the dam, and down-stream sensors were placed<100 m downstream of the dam in the main flow channel. Both upstream and downstream
sensors were placed at depths of 20–50 cm. The temperature was recorded at a time step of 30 min. The temperature sen-sors were calibrated each year using the simple “ice bucket” procedure introduced by Dunham et al. (2005).
The monitoring period had higher than normal air temper-atures, except for 2014 (only one site), which was colder with significantly higher precipitation. Precipitation was normal throughout the study period, except in 2009 and 2016, which were lower than normal (Table 2). The summer climatic char-acteristics for our analysis period are compared with the nor-mal values produced by Meteo France (1981–2010). 2.4 Temperature data analysis
To characterize the influence of dams on stream thermal regimes we first calculated three variables: daily difference between upstream and downstream temperature (1) max-imums (1Tmax), (2) minimums (1Tmin), and (3) ampli-tudes (1Tamp) for each site and year. With these data, we then conducted the following analyses:
1. median summer differences in 1Tmax, 1Tmin, and 1Tamp (median is used instead of mean to limit the influence of extreme values);
2. regression between daily upstream and downstream wa-ter temperature to directly assess dam thermal effects; 3. regression between daily air and water temperature over
Table 1.Physical characteristics of dams of the river and impoundments.
Stream Dam name Watershed Distance Strahler Dam Length Surface Volume Residence Year of name (km2) to the order height (impoundment) (m2) (m3) time (d) sampling
source (m) (m) (m)
Veyle Dompierre 32 11 167 3 1.2 500 10 900 10 500 8.4 2010
Veyle Fretaz 78 22 859 4 1.5 535 3500 2600 0.1 2014 0.1 2016 Veyle Montfalconnet 125 38 146 4 2.4 1200 14 400 20 160 0.5 2015 Veyle Peroux 500 50886 5 2.4 2150 39 200 53 000 0.6 2015 Veyle Thuets 350 43 912 5 1.9 2950 57 000 51 000 0.6 2016 Veyle Thurignat 640 60 537 5 1.4 1500 34 600 31 165 0.2 2016 Vieux Jonc Cailloux 67 11 680 3 1.0 280 2340 1200 0.7 2009
Renon Champagne 122 42 368 3 1.5 405 2840 2130 0.7 2009 0.5 2015 Reyssouze Moulin Neuf 209 48 217 3 1.0 1800 35 520 12 420 0.3 2016 Reyssouze Peloux 145 34 842 3 1.5 1700 49 930 17 340 0.5 2016 Solnan Revel 88 15 431 3 1.8 3200 31 140 28 370 2.6 2016
Table 2.Climatic characteristics during years of stream temperature monitoring (2009–2016).
Year Air Precipitation
(July– temperature anomaly (%) August) anomaly (◦C)
2009 +1.1 70
2010 +0.3 50
2014∗ −1.8 165
2015 +2 50
2016 +0.3 70
Source: https://www.infoclimat.fr (last access: June 2018) Lyon Bron station normal 1991–2015. ∗2014 is bold to highlight the relatively large climate anomaly in this year.
To assess the potential biological importance of dam thermal effects, we also calculated (1) the number of days that maxi-mum water temperatures were greater than 22◦C, and (2) the mean of the maximum daily duration (in hours, h) where the water temperature was greater than 22◦C. We chose 22◦C as an illustrative threshold, which is known to be a ther-mal stress benchmark value for salmonids (Elliott and Elliot, 2010; Ojanguren et al., 2001).
2.5 Site typology analysis
We observed different thermal regimes in our data and wanted to classify them. To do so, we carried out a hierar-chical cluster analysis using Euclidian dissimilarities matrix according to the method of Ward Jr. (1963) using the daily dataset (n=807) of1Tmaxand1Tminobtained over all time
series. We forced the classification to integrate the different time-series effect by adding a complete disjunctive table dif-ferentiating each time series to the dataset. This procedure makes it possible to group the data first by time series, then in a second step to differentiate them from each other (i.e., to differentiate site thermal regimes).
2.6 Ordination analysis
To characterize the impacts of the different dams, a princi-pal component analysis (PCA) was carried out using the XL-STAT (Addinsoft™) software on the three water temperature variables:1Tmax,1Tmin, and1Tamp. We used the median values for variables in each time series in order to build an input matrix (13 occurrences for three variables).
Then a complementary redundancy analysis (RDA) with an automatic stepwise variable selection procedure was used to identify the physical dam characteristics (Table 1) that sig-nificantly explain the PCA results (Ter Braak, 1986).
After the RDA identified the relevant physical dam charac-teristics, we conducted a multiple linear regression between these characteristics and temperature variables to determine the specific effect sizes of these characteristics on the thermal regime.
3 Results
3.1 General temperature patterns
[image:5.612.87.247.373.473.2]Figure 2.Time series of water temperature (◦C) upstream (blue) and downstream (red) of the Fretaz dam in the Veyle stream, respectively, in the years 2014(a)and 2016(b). These example sites are illustrative of the group A typology, whereTminis increased downstream butTmax is not.
– daily (diel) variation (minimum in early morning, max-imum in late evening);
– periods of progressively increasingTminandTmax; and – rapid drops in temperature that interrupt these periods,
and that are generally linked to precipitation events. The periods of progressively increasing temperature vary in length, magnitude, and timing from one year to another, but the general pattern remains the same, as demonstrated by the case of the Fretaz dam, monitored in 2014 (a cold and humid year) and 2016 (a more normal year, Fig. 2; Table 2).
We observed two consistent patterns in upstream– downstream thermal regimes. In the first pattern, Tmin is higher downstream, but Tmax stays relatively constant (Fig. 2). We note that these upstream–downstream differ-ences were muted in 2014, the cold and humid year (Fig. 2). This thermal pattern (i.e., whereTminincreases downstream, but notTmax) is observed in 7 out of 13 cases (Table 3). In the other cases (6 out of 13; Table 3), we observed a second
pattern, where bothTminandTmaxare higher downstream of the structure, which results in a consistent shift between the two temperature time series (Fig. 3, selected examples: Dom-pierre dam, 2010 and Peroux dam, 2015).
3.2 Upstream–downstream differences
The two dominant patterns of temperature differences are further illustrated by plotting downstream versus upstream TminandTmaxvalues at the site. For example, at Dompierre in 2010, we observed a consistent shift of approximately
+1.5◦C (both T
min and Tmax) between the upstream and downstream areas with respect to the dam (Fig. 4a). In con-trast, at Fretaz in 2014, this shift is dampened, and temper-ature values between the upstream and downstream regions more closely follow a 1:1 relationship (Fig. 4b).
tem-Figure 3.Time series of water temperatures upstream (blue line) and downstream (red line) of the(a)Dompierre and(b)Peroux dams in the Veyle stream (2010 and 2015, two warm summer years, respectively,+1.1 and 2◦C, Table 2). These example sites are illustrative of the group B typology, where bothTminandTmaxare increased downstream.
[image:7.612.127.468.64.412.2] [image:7.612.116.480.485.635.2]Table 3.Median values of differences between daily maximum (1Tmax) and minimum temperatures (1Tmin) and the diurnal ranges (1Tamp) between upstream and downstream regions of the run-of-the-river dams. The daily maximum upstream temperature (Tmax,up) is indicated to show the limited influence of the initial temperature on upstream–downstream differences.
Group Run-of-the-river dam (stream) 1Tmax 1Tmin 1Tamp Tmax,up (◦C) (◦C) (◦C) (◦C)
A
Moulin Neuf (Reyssouze), 2016 −0.6 0.5 −1.0 24.0 Cailloux (Vieux Jonc), 2009 −0.4 0.9 −1.3 18.1 Fretaz (Veyle), 2014 0.3 0.7 −0.3 19.4 Fretaz (Veyle), 2016 −0.3 1.2 −1.4 21.2 Champagne (Renon), 2015 0.1 0.9 −0.9 20.2 Montfalconnet (Veyle), 2015 −0.1 1.0 −0.8 19.8 Champagne (Renon), 2009 −0.1 0.7 −1.0 19.3
B1
Thurignat (Veyle), 2016 0.6 0.3 0.4 23.2
Thuets (Veyle), 2016 0.7 0.8 0.0 21.0
Peloux (Reyssouze), 2016 0.8 0.5 0.1 23.9
B2
Peroux (Veyle), 2015 1.1 1.1 −0.3 21.3
Revel (Solnan), 2016 2.1 1.7 0.1 21.9
Dompierre (Veyle), 2010 2.4 2.2 0.4 18.2
perature that is 0.96◦C higher on average than that of the upstream region.
During the summer season, the upstream–downstream changes in the thermal regime are not well correlated with air temperature for the same periods. For example, a sim-ple linear regression between daily maximum air temperature and1Tmaxindicates that air temperature explains only 0.8 % of the variability in upstream–downstream thermal regime shifts.
3.3 Site typology
The hierarchical cluster analysis applied to the daily summer temperature anomalies distinguished three groups.
1. A first group (A) characterized by a – median1Tmaxof less than 0.5◦C, – median1Tminof+0.4–1.3◦C, and – median1Tampof less than−0.2◦C. 2. A second group (B1) characterized by a
– median1Tmaxof+0.6–1.2◦C and – median1Tminof+0.3–1.1◦C. 3. A third group (B2) characterized by a
– median1Tmaxof greater than 1.2◦C and – median1Tminof greater than 1.2◦C.
The hierarchical cluster analysis differentiates the B2 group primarily from the B1 and A groups (Fig. 6). We propose to retain the major distinction between group A and group B,
because it is based on a temperature increase between up-stream and downup-stream, not only for Tmin (group A), but forTminandTmax(group B), which is an important threshold for the physiology of aquatic organisms. The distribution of the differences between the minimum and maximum temper-ature values during summer (Fig. 5) confirms the difference among these three groups.
3.4 Ordination results
The first axis of the PCA analysis (74.1 % of total inertia) is correlated to all daily temperature daily anomalies, in par-ticular to the1Tmax. The second axis (25.3 %) discriminates the 1Tamp with1Tmin (Fig. 6). Results of the RDA show that the water residence time and the impoundment surface explain 95.2 % of the PCA structure. The projection of the sites on these axes shows a strong spreading along the first axis (Fig. 6). Additionally, the dams that had two different measurement years stay within the same range on this first axis (i.e., Fretaz and Champagne) (Fig. 6).
Multiple regression analyses between the temperature variables (median values of1Tminand1Tmax) and the phys-ical characteristics obtained by the RDA (residence time and impoundment surface) resulted in high explanatory power (R2≈0.7). These regressions identified the significant con-tribution of residence time for1Tmin and1Tmax, whereas only the surface area had a significant contribution for1Tmax (Table 4).
3.5 Ecologically relevant intra-daily temperature variations
Figure 5.Box plot distribution (25 %–75 %) of upstream–downstream differences of daily(a)minimum and(b)maximum temperatures for all of the time series studied. (Red lines denote 0◦C for1Tmaxand 1◦C for1Tminand are drawn to help distinguish typologies.) The vertical dashed lines drawn in bold are the limits of the three typologies based on the hierarchical cluster analysis. Dendrogram hierarchical cluster analysis is shown as an inset.
Table 4. Results of multiple linear regressions performed on the two indicators,1Tminand1Tmax, using the dam physical charac-teristics surface area and residence time. Significantp values are shown in bold.
Dependent Independent Standardized pvalue R2
variable variable physical coefficient characteristics
1Tmax Surface areaResidence time 0.390.80 0.0410.001 0.72
1Tmin Surface area −0.13 0.48 0.68 Residence time 0.80 0.001
variations for a 3 d time series in group A (small thermal ef-fect) with group B (large thermal effect; Fig. 7):
– In the example of group A (Fig. 7a), the downstream thermal warming effect is limited to the nighttime (Tmin) period (observed difference of 1◦C warmer). Addition-ally, although the biological benchmark of 22◦C is ex-ceeded both upstream and downstream during the day on 20 August, the duration above the thermal threshold is short, preceded and followed by more favorable tem-peratures (i.e., the remission period).
[image:9.612.46.282.554.645.2]Figure 6.PCA analysis with sites plotted and temperature anomaly variables shown. Ellipses are drawn to visualize the groups obtained with the hierarchical cluster analysis.
remission (return to a temperature that is better tolerated physiologically by fish). At the same time, the upstream part of the stream is maintained at daily temperatures not exceeding this threshold.
These differences between the downstream responses in diur-nal temperature variation hold throughout the time series. In other words, group A has a consistent response of no change in downstream maximum water temperatures, coupled to a consistent increase in the downstream minimum temperature (e.g., Fig. 7a). Group B differs in that the downstream maxi-mum temperatures are also increased (e.g., Fig. 7b).
For all sites, by studying the average daily duration with a temperature continuously exceeding 22◦C, we can see the following (Fig. 8):
– downstream durations are always greater than or equal to those of the upstream durations, regardless of site ty-pology;
– the largest upstream–downstream differences occur in the B2 group;
– group A is generally not affected by an upstream– downstream increase, except for two sites which exhibit a 2 h increase.
3.6 Ecologically relevant seasonal temperature variations
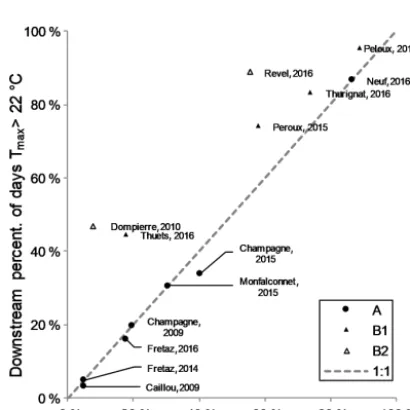
We observed very similar results to our intra-daily duration analysis in our analogous study on the proportion of sum-mer days where the maximum water temperature exceeded the threshold of 22◦C. For example, group B was much
[image:10.612.326.526.333.599.2]Figure 8.Mean of the daily maximum duration with a stream tem-perature above 22◦C, upstream and downstream of each site mon-itored in the study. A (circles), B1 (closed triangles), and B2 (open triangles) are the groups of sites resulting from the hierarchical clus-ter analysis.
Figure 9.Percentage of the number of summer days with a diur-nal maximum water temperature above 22◦C, upstream and down-stream of each site monitored in the study. A (circles), B1 (filled triangles), and B2 (open triangles) are the groups of sites resulting from the hierarchical cluster analysis.
more likely to exhibit downstream increases in daily thresh-old exceedances (Fig. 9). Conversely, several of the group A sites had lower proportions of days where downstream daily exceedances were greater than upstream daily exceedances (i.e., Champagne 2015, Caillou 2009, Fretaz 2016).
4 Discussion
The number of small dams in streams is greater than the num-ber of large dams (>15 m) by several orders of magnitude (Downing et al., 2006; Poff and Hart, 2002; Verpoorter et al., 2014). Despite this, small dam effects on thermal regimes are much less well known than those of large dams (Down-ing, 2010; Ecke et al., 2017; Smith et al., 2017). Thus, this presents a challenge with respect to identifying and general-izing the significant drivers of a realistic thermalscape (Isaak et al., 2017), which is essential for understanding the current ecological status of rivers and for predicting future changes under different climate change scenarios with sufficient re-alism. In addition, summertime, which has the highest tem-peratures, appears to potentially be the most critical period for aquatic organisms and, as such, requires special attention (Kemp et al., 2012; Zaidel, 2018).
The purpose of this study was to quantify the downstream impacts of different types of small dams on the summer wa-ter temperature in lowland streams. We investigated these ef-fects in 11 dams across five lowland streams in the Bresse region for different climate years (12 summer time series in warmer and drier years than normal and one series in a colder and wetter year 2014; Table 2). We observed the clear influ-ence of small dams on the downstream thermal regime at all sites: 23 % of the time series exhibited a >1◦C elevation of Tmax, and 77 % of the time series exhibited Tmax shifts −1 to 1◦C. Across all time series, the mean increase ofTmin was 1◦C. For 85 % of time series, the increase inTminwas greater than 0.5◦C; this increase reached 2.4◦C at certain structures (Dompierre, Fig. 6).
Our results corroborate the reviews and meta-analyses in the general trend for a small dam warming effect within a range of 0–3◦C (Lessard and Hayes, 2003; Maxted et al., 2005; Mbaka and Mwaniki, 2015; Ecke et al., 2017, 27 stud-ies; Means, 2018, 24 sites; Zaidel, 2018, 18 sites). Occasion-ally, downstream warming effects reach as high as 7◦C (Mar-golis et al., 2001; Carlisle et al., 2014), or 3–6◦C (Fraley, 1987; Lessard and Hayes, 2003, for a part of their sample; Dripps and Granger, 2013). One possible explanation is that such sites correspond to very large impoundments in compar-ison with low natural flows, with large areas exposed to solar radiation, which emphasizes the need for an analysis of the physical characteristics of their structures. There are also sit-uations where the downstream temperature is lower than the upstream temperature, as we observed in one situation in our study (Moulin Neuf, Reyssouze, Fig. 6). We suggest that this phenomenon, as in the case of certain beaver dams (Majerova et al., 2015; Weber et al., 2017), occurs when the existence of a structure modifies the equilibrium conditions of the alluvial groundwater table, which under increased pressure can sup-ply the downstream end of the structure with cooler water.
[image:11.612.65.270.342.547.2]temperatures, whereas impoundments with low-head dams and a large surface area would have warmer downstream temperatures (Fuller and Peckarsky, 2011, Rocky Mountains in Colorado; Means, 2018, upper Columbia River). We at-tempted to avoid possible temperature effects from alluvial groundwater by placing the downstream stations as close as possible to the dam (<100 m). Despite the operating precautions taken, it is possible that the Moulin Neuf site, Reyssouze, which had several secondary channels, was still influenced by groundwater inflows.
Dams in our study area also caused downstream damp-ening in diurnal thermal amplitudes. We observed that the daily amplitude of the downstream temperature is reduced in 61.5 % of studied cases compared with that of the upstream region; this is the same proportion as noted in the observa-tions of Zaidel (2018) for 58 % of the 30 structures studied in Massachusetts. Kemp et al. (2012) also concluded that the main influence of beaver ponds was a reduction in river tem-perature fluctuations. Amplitude reduction is primarily due to increased daily minimum downstream temperatures (by
+0.96◦C in our study). Studying 24 beaver ponds in Wash-ington State, Means (2018) also observed that the minimum temperature downstream was 0.8◦C higher compared with the minimum temperature upstream.
4.1 What physical variables are important?
The effect of small dams on stream thermal regimes has re-ceived little attention to date, and there is still no consensus regarding which dam physical variables best predict down-stream temperature patterns. Most research is focused on iso-lated case studies (i.e., one stream, Kornis et al., 2015; Ma-jerova et al., 2015; Smith et al., 2017; Weber et al., 2017), and in cases where thermal measurements are secondary vari-ables, there is often incomplete information about the phys-ical dam characteristics (Kemp et al., 2012). Nevertheless, as early as the pioneering studies (Cook, 1940), certain dam characteristic emerged as candidate variables (e.g., exposed surface subjected to radiation and water residence time) to explain downstream shifts in thermal regime. At the same time, other commonly used dam characteristics, like dam wa-ter level and dam height, appear to be insufficient to predict a thermal effect downstream (Poff and Hart, 2002). We have described precisely these different candidate metrics for the observed sites (Table 1). Our results show that the sites can be grouped based on different behaviors for1Tmin,1Tmax, and1Tamp.
We observed two distinct behaviors in upstream– downstream thermal regime shifts in the 13 time series (Fig. 6). The first behavior, which we call group A, is char-acterized by an impoundment effect that reduced the down-stream amplitude of the daily temperature and increased the minimum temperature (the median of1Tmaxwas limited to 0.3◦C at most). The second behavior, which we call group B (split into subgroups B1 and B2), is characterized by an
in-crease of both daily minimum and maximum temperatures with a corresponding change in amplitude.
We found that residence time and surface area were the principal explanatory variables of upstream–downstream temperature differences. Indeed, redundancy analysis indi-cated the primary differences among our site typologies were explained by these variables. For example, Group A is char-acterized by a short residence time (less than 0.7 d) and a small impoundment surface area (less than 35 500 m2), whereas group B is characterized either by a large surface area (greater than 35 000 m2) with a short residence time (e.g., 0.2 d; group B1), or by long residence times (e.g., 8.4 d; group B2,). These physical differences are directly linked to the observed differences in thermal regime shifts. In group B2, we suggest that long residence times reduce cool-ing effects; the nocturnal input (i.e., the coolcool-ing effect) be-comes negligible in the general heat exchange balance. How-ever, for group B1 dams with short residence time, but large surface areas, increased energy supply by solar radiation on the larger surface may overwhelm any potential cooling ef-fects. Multiple regression (Table 4) clarified the direction and magnitude of these effects and indicated that1Tmaxis best explained by both residence time and surface area (group B effects), whereas1Tminis best explained by only residence time (group A effects).
To summarize, we observed two primary thermal regime effects of small dams. The first group is characterized by a downstream impoundment effect that increasesTminand re-ducesTamp, but does not significantly change1Tmax(−0.6 to 0.3◦C). The second group shows downstream increases in bothTminandTmax, with the little change to1Tamp(−0.3 to 0.4◦C). For the second group, the change in thermal regime
is much clearer, with overall median1T differences of ap-proximately +0.6–2.4◦C. This clear break in the thermal regime between the upstream and downstream ecosystems was most notable during very hot periods. A larger sample of this second group type (group B) would permit a more quantitative characterization of the dams (surface area, res-idence time, and morphometry of the impoundment), and a possible indication of threshold values above which thermal regime shifts may emerge. One potential path forward is to create regionalized statistical models based on geographical data and dam databases, analogous to the way that ecological risk analyses are constructed (Allan et al., 2012; Van Looy et al., 2015). However, we realize that our dataset is provincial in temporal and regional extent, potentially limiting extrapo-lation of results to other areas with different groundwater and climatic influences.
precise information than most dam descriptions in the vast majority of available public databases.
4.2 Analysis of the thermal regime from an ecological perspective
The influence of dams on downstream processes varies throughout time. For example, analyses of hydrological regimes’ shifts should simultaneously consider intensity, du-ration, frequency, seasonality, and rhythm of change (Poff et al., 1997). Ecological stresses from thermal regime shifts should account for the duration and amplitude of exposure to high temperatures and the recovery from stress during peri-ods of lower temperature (Bevelhimer and Bennet, 2000). In this work, we examined both seasonal and intra-daily thermal effects of dams using an ecological perspective.
Shifts in downstream ecological pattern and process are dependent on the magnitude of thermal change from up-stream to downup-stream. For fish, the literature suggests that downstream increases of approximately 2◦C (Hay et al., 2006) or 3◦C (Verneaux, 1977) can result in significant com-munity shifts for many biotypologies. From this perspec-tive, the majority of our sites belonging to groups A and B1 present a low risk with regard to the potential change in fish communities as they exhibited a moderate absolute down-stream temperature increase of 0–1◦C. However, the higher downstream increases of our B2 group (1.2–2.4◦C; Fig. 6) are likely to influence the composition of fish communi-ties. This is especially true for certain species close to the threshold of their thermal comfort, which are often the same species already under conservation efforts. Such tempera-ture increases can also amplify the general metabolism in the stream, possibly leading to the unwanted proliferation of algae, a less stable oxygen cycle, and stronger effects of toxic compounds (Heugens et al., 2001 in Souchon and Tis-sot, 2012).
On the scale of several days, it is important not to under-estimate the influence of cumulative exposure to tempera-tures close to the maximum tolerable temperatempera-tures (Tissot and Souchon, 2010), for which the incidence of temperature variations has an impact on biological communities (Lessard and Hayes, 2003; in nine streams in Michigan, USA). In this study, we used a temperature of 22◦C as an illustra-tive threshold known to be a thermal stress benchmark value for salmonids, especially for brown trout,Salmo trutta (El-liott and Elliot, 2010: upper critical incipient lethal tempera-ture for juveniles, which is considered a very sensitive stage; Ojanguren et al., 2001: general activity of brown trout ju-venile). In addition, this threshold is known to be impor-tant for the life cycle of aquatic invertebrates (Ward, 1976; Brittain and Saltveit, 1989). By looking at the fraction of time that daily maximum temperatures exceeded this thresh-old, we found that the majority of sites in our study area, regardless of dam structure, are unfavorable in summer for species sensitive to this threshold. Importantly, however, we
found that for sites that are more favorable (e.g., Dompierre or Thuets, left side of figure), the presence of small dams induces a clear shift towards an elevated percentage of the number of days above the temperature threshold, from less than 20 % upstream to more than 40 % downstream.
On the daily scale, it is necessary to not only consider the maximum tolerable temperature, but also its duration of in-fluence, as the temperature of nocturnal remission and its du-ration must be sufficient for organisms to repair their heat stress proteins. For example, Schrank et al. (2003) and John-stone and Rahel (2003) suggested that daily minima provide a respite from elevated daily maximum temperatures if there is sufficient time to repair protein damage (McCullough et al., 2009). We explored this issue by calculating the average hourly duration of temperatures above the 22◦C threshold at each site. We found that small dams more than doubled this daily threshold exceedance duration on average (2.2±0.7, mean±SE), and at one site (Dompierre) increased this du-ration by an order of magnitude (Fig. 8). To further illustrate this effect and the differences among site typology, we pre-sented two examples of a daily temperature regime during 3 d in August at the Caillou (type A) and Revel (type B2) sites (Fig. 7). At Caillou, upstream from the dam (Fig. 7a), the diel natural variation offers remission temperature for brown trout, with several hours at a temperature<20◦C each day. The situation is less favorable downstream with no sufficient time below this temperature. At Revel (Fig. 7b), the observed thermal daily pattern is similar, but the structure associated with group B2 exacerbated the warming of water, leading to fewer remission periods.
Without appropriate biological data, it is difficult to know how minimum and maximum water temperatures affect acclimation, performance, and stress (McCullough et al., 2009). Exploring this question may be especially relevant be-cause small dams clearly alter stream thermal regimes. More-over, future global warming could exacerbate these effects as it is expected to increase daily minimum temperatures more than daily maximum temperatures, with a corresponding de-crease in the diurnal temperature range and an inde-crease in mean daily temperature (Easterling et al., 1997; Vose et al., 2005).
4.3 Diversity of situations
in the long term, it is necessary to account for additional features than we have done here. For example, it is impor-tant to consider the effects of unshaded versus shaded river reaches, which influence radiation warming effects, and the spatial distributions of groundwater inflows, which provide cooling effects. We note that regardless of application, using air temperature to predict water temperature at the daily scale should be used with caution (see Sect. 3.2).
Our work highlights physical dam characteristics that could be useful in a large-scale heat risk analysis, or in mod-eling scenarios aiming to account for changes in thermal regimes. For example, a simple model using only a small dam residence time and surface area may be able to diag-nose thermal regime change at the regional scale with suf-ficient accuracy. Moreover, the results presented here could also provide essential guidance to environmental protection authorities in their prioritization of rivers to be protected or restored, especially for those rivers that require greater ther-mal resilience.
Given the complexity and high variability of the river sys-tems encountered in this study (Strahler orders spanning 3– 5), it seems essential to us (and see Isaak et al., 2017, 2018; Steel et al., 2017; Dzara et al., 2019) to continue to con-duct and expand well targeted stream temperature monitor-ing. This type of monitoring is requisite before being able to model stream temperature with sufficient spatial and tem-poral resolution. Modeling these systems accurately is a jor challenge, because these aquatic spaces will undergo ma-jor thermal and hydrological alteration with climate change, where tipping points in biotic distributions are likely to oc-cur.
5 Conclusions
We quantified the impact of small dams on the temperature of streams, and identified major drivers of these impacts, adding to a current paucity of information on this topic in the scien-tific literature. Our unique interannual, cross-site analysis of summer stream temperatures showed that contemporary dam impacts are already ecologically significant to downstream reaches, and these effects may be exacerbated by expected warming in the study area (see IPCC scenarios of global change for Val de Saone). We identified the primary drivers of the temperature regime responses as residence time and the impoundment surface area. The influence of these drivers in other landscapes needs to be confirmed by other datasets that are not yet well developed or accessible.
Code and data availability. Code, spreadsheets, and data used in this work are available upon request from the authors.
Author contributions. AC, KVL, and YS designed the field study and AC conducted it. JSD conducted the stream temperature dura-tion threshold analysis and provided critical review/editing of the paper and figures. All authors contributed to the paper preparation.
Competing interests. The authors declare that they have no conflict of interest.
Acknowledgements. We thank the three anonymous referees who made it possible to improve the text. We also thank the local river management body, the Syndicat Mixte Veyle Vivante and its em-ployees Laurent Charbonnier and Stéphane Kihl, for installing the measurement network, for their help with field monitoring, and for their valuable practical advice. Furthermore, we are grateful for the punctual gauging data (edition of 15 April 2002) provided by the regional branch of the Ministry of the Environment (Dreal Rhône-Alpes; formerly DIREN SEMA). The Rhone Mediterranean Cor-sica Water Agency provided financial support which allowed the times series to be recorded and the data to be analyzed. Jacob Di-amond is supported by POI FEDER Loire n◦2017-EX001784, the Water Agency of Loire Catchment AELB, and the University of Tours.
Review statement. This paper was edited by Anas Ghadouani and reviewed by three anonymous referees.
References
Allan, J. D. and Castillo, M. M.: Stream Ecology. Structure and Function of Running Waters, 2nd Edn., Springer, Dordrecht, the Netherlands, 436 pp., 2007.
Allan, J. D., Yuan, L. L., Black, P., Stockton, T. O. M., Davies, P. E., Magierowski, R. H., and Read, S. M.: Investigating the relation-ships between environmental stressors and stream condition us-ing Bayesian belief networks, Freshwater Biol., 57, 58–73, 2012. Bernhardt, E. S., Heffernan, J. B., Grimm, N. B., Stanley, E. H., Harvey, J., Arroita, M., Appling, A., Cohen, M., McDowell, W. H., and Hall, R.: The metabolic regimes of flowing waters, Lim-nol. Oceanogr., 63, S99–S118, 2018.
Bevelhimer, M. and Bennett, W.: Assessing cumulative thermal stress in fish during chronic intermittent exposure to high tem-peratures, Environ. Sci. Policy, 3, 211–216, 2000.
Brett, J. R. and Groves, T. D. D.: Physiological energetics, in: Fish Physiology, Vol. 8, edited by: Hoar, W. S., Randall, D. J., and Brett, J. R., Academic Press, New York, 279–352, 1979. Brittain, J. E. and Saltveit, S. J.: A review of the effect of river
regu-lation on mayflies (Ephemeroptera), Regulat. Rivers: Res. Man-age., 3, 191–204, 1989.
Brown, J. H., Gillooly, J. F., Allen, A. P., Savage, V. M., and West, G. B.: Toward a metabolic theory of ecology, Ecology, 85, 1771– 1789, 2004.
Carlisle, D. M., Nelson, S. M., and Eng, K.: Macroin-vertebrate community condition associated with the sever-ity of streamflow alteration, River Res. Appl., 30, 29–39, https://doi.org/10.1002/rra.2626, 2014.
Cook, D. B.: Beaver-trout relations, J. Mammal., 21, 397–401, 1940.
Coutant, C.: Thermal preference: when does an asset become a lia-bility?, Environ. Biol. Fish., 18, 161–172, 1987.
Cumming, G. S.: The impact of low-head dams on fish species rich-ness in Wisconsin, USA, Ecol. Appl., 14, 1495–1506, 2004. Downing, J. A.: Emerging global role of small lakes and ponds:
little things mean a lot, Limnetica, 29, 9–24, 2010.
Downing, J. A., Prairie, Y. T., Cole, J. J., Duarte, C. M., Tranvik, L. J., Striegl, R. G., McDowell, W. H., Korte-lainen, P., Caraco, N. F., Melack, J. M., and Middelburg, J. J.: The global abundance and size distribution of lakes, ponds, and impoundments, Limnol. Oceanogr., 51, 2388–2397, https://doi.org/10.4319/lo.2006.51.5.2388, 2006.
DREAL – Direction Regionale de l’Environnement, de l’Amenagement et du Logement: Bulletins hydrologiques de la région Auvergne-Rhône-Alpes, available at: http://www.auvergne-rhone-alpes.developpement-durable. gouv.fr/hydrometrie-r3157.html, last access: 20 April 2018. Dripps, W. and Granger, S. R.: The impact of artificially
impounded, residential headwater lakes on downstream water temperature, Environ. Earth Sci., 68, 2399–2407, https://doi.org/10.1007/s12665-012-1924-4, 2013.
Dunham, J. B., Chandler, G. L., Rieman, B. E., and Martin, D.: Measuring stream temperature with digital data loggers: A user’s guide, Gen. Tech. Rep. RMRSGTR-150WWW, Department of Agriculture, Forest Service, Rocky Mountain Research Station, Fort Collins, CO, USA, 15 pp., 2005.
Dzara, J. R., Neilson, B. T., and Null, S. E.: Quantify-ing thermal refugia connectivity by combinQuantify-ing temperature modeling, distributed temperature sensing, and thermal in-frared imaging, Hydrol. Earth Syst. Sci., 23, 2965–2982, https://doi.org/10.5194/hess-23-2965-2019, 2019.
Easterling, D. R., Horton, B., Jones, P. D., Peterson, T. C., Karl, T. R., Parker, D. E., Salinger, M. J., Razuvayev, V., Plummer, N., and Jamason, P.: Maximum and minimum temperature trends for the globe, Science, 277, 364–367, 1997.
Ecke, F., Levanoni, O., Audet, J., Carlson, P., Eklöf, K., Hart-man, G., McKie, B., Ledesma, J., Segersten, J., and Truchy, A.: Meta-analysis of environmental effects of beaver in re-lation to artificial dams, Environ. Res. Lett., 12, 113002, https://doi.org/10.1088/1748-9326/aa8979, 2017.
Elliott, J. M. and Elliott, J. A.: Temperature requirements of At-lantic salmon Salmo salar, brown trout Salmo trutta and Arctic charr Salvelinus alpinus: predicting the effects of climate change, J. Fish Biol., 77, 1793–1817, https://doi.org/10.1111/j.1095-8649.2010.02762.x, 2010.
Ellis, L. E. and Jones, N. E.: Longitudinal trends in regu-lated rivers: a review and synthesis within the context of the serial discontinuity concept, Environ. Rev., 21, 136–148, https://doi.org/10.1139/er-2012-0064, 2013.
Fraley, J. J.: Effects of elevated stream temperatures below a shal-low reservoir on a cold water macroinvertebrate fauna, in: The ecology of regulated streams, edited by: Ward, J. V. and Stan-ford, J. A., Plenum Press, New York, London, 257–272, 1987.
Fuller, M. R. and Peckarsky, B. L.: Ecosystem engineering by beavers affects mayfly life histories, Freshwater Biol., 56, 969– 979, 2011.
Hannah, D. M., Malcolm, I. A., Soulsby, C., and Young-son, A. F.: Heat exchanges and temperatures within a salmon spawning stream in the Cairngorms, Scotland: seasonal and sub-seasonal dynamics, River Res. Appl., 20, 635–652, https://doi.org/10.1002/rra.771, 2004.
Hay, J., Hayes, J. W., and Young, R. G.: Water quality guidelines to protect trout fishery values, Cawthron Institute, Nelson, New Zealand, 2006.
Hayes, D. B., Dodd, H., and Lessard, J.: Effects of small dams on coldwater stream fish communities, in: American Fisheries Soci-ety Symposium, 25–26 August 2004, Bethesda, Maryland, USA, 587–602, 2008.
Hester, E. T., Doyle, M. W., and Poole, G. C.: The influence of in-stream structures on summer water temperatures via induced hyporheic exchange, Limnol. Oceanogr., 54, 355–367, 2009. Hester, E. T. and Doyle, M. W.: Human Impacts to River
Tem-perature and Their Effects on Biological Processes: A Quan-titative Synthesis, J. Am. Water Resour. Assoc., 47, 571–587, https://doi.org/10.1111/j.1752-1688.2011.00525.x, 2011. Heugens, E. H., Hendriks, A. J., Dekker, T., v. Straalen, N. M., and
Admiraal, W.: A review of the effects of multiple stressors on aquatic organisms and analysis of uncertainty factors for use in risk assessment, Crit. Rev. Toxicol., 31, 247–284, 2001. ICOLD – International Commission on Large Dam: Number
of Dams by Country Members, available at: http://www. icold-cigb.org/GB/world_register/general_synthesis.asp, last ac-cess: 20 April 2018.
IPCC: Climate Change 2007: The Physical Science Basis, in: Con-tribution of Working Group I to the Fourth Assessment Report of the Intergovernmental Panel on Climate Change, 996 pp., 2007. IPCC: Climate Change 2013: The Physical Science Basis, in:
Con-tribution of Working Group I to the Fifth Assessment Report of the Intergovernmental Panel on Climate Change, 1535 pp., 2013. Isaak, D. J., Wenger, S. J., and Young, M. K.: Big biology meets microclimatology: defining thermal niches of ectotherms at land-scape scales for conservation planning, Ecol. Appl., 27, 977–990, 2017.
Isaak, D. J., Luce, C. H., Horan, D. L., Chandler, G. L., Wollrab, S. P., and Nagel, D. E.: Global Warming of Salmon and Trout Rivers in the Northwestern U.S.: Road to Ruin or Path Through Purgatory?, T. Am. Fish. Soc., 147, 566–587, https://doi.org/10.1002/tafs.10059, 2018.
Johnstone, H. C. and Rahel, F. J.: Assessing temperature tolerance of Bonneville cutthroat trout based on constant and cycling ther-mal regimes, T. Am. Fish. Soc., 132, 92–99, 2003.
Kelleher, C., Wagener, T., Gooseff, M., McGlynn, B., McGuire, K., and Marshall, L.: Investigating controls on the thermal sensi-tivity of Pennsylvania streams, Hydrol. Process., 26, 771–785, https://doi.org/10.1002/hyp.8186, 2012.
Kemp, P. S., Worthington, T. A., Langford, T. E., Tree, A. R., and Gaywood, M. J.: Qualitative and quantitative effects of reintro-duced beavers on stream fish, Fish Fisher., 13, 158–181, 2012. Kornis, M. S., Weidel, B. C., Powers, S. M., Diebel, M. W., Cline,
Aquat. Sci., 77, 465–480, https://doi.org/10.1007/s00027-014-0391-2, 2015.
Lessard, J. L. and Hayes, D. B.: Effects of elevated water temper-ature on fish and macroinvertebrate communities below small dams, River Res. Appl., 19, 721–732, 2003.
Majerova, M., Neilson, B. T., Schmadel, N. M., Wheaton, J. M., and Snow, C. J.: Impacts of beaver dams on hydrologic and tempera-ture regimes in a mountain stream, Hydrol. Earth Syst. Sci., 19, 3541–3556, https://doi.org/10.5194/hess-19-3541-2015, 2015. Margolis, B. E., Castro, M. S., and Raesly, R. L.: The impact
of beaver impoundments on the water chemistry of two Ap-palachian streams, Can. J. Fish. Aquat. Sci., 58, 2271–2283, 2001.
Maxted, J. R., McCready, C. H., and Scarsbrook, M. R.: Effects of small ponds on stream water quality and macroinvertebrate com-munities, New Zealand, J. Mar. Freshw. Res., 39, 1069–1084, 2005.
Mbaka, J. G. and Mwaniki, W. M.: A global review of the down-stream effects of small impoundments on down-stream habitat condi-tions and macroinvertebrates, Environ. Rev., 23, 257–262, 2015. McCullough, D. A., Bartholow, J. M., Jager, H. I., Beschta, R. L., Cheslak, E. F., Deas, M. L., Ebersole, J. L., Foott, J. S., Johnson, S. L., Marine, K. R., Mesa, M. G., Petersen, J. H., Souchon, Y., Tiffan, K. F., and Wurtsbaugh, W. A.: Research in thermal biol-ogy: Burning questions for coldwater stream fishes, Rev. Fish. Sci., 17, 90–115, 2009.
Means, C.: Stream temperature variability in headwater beaver dam complexes in relation to hydrologic and environmental factors, MS thesis, Univerity of Washington, Washington, USA, 48 pp., 2018.
Mohseni, O., Stefan, H. G., and Erickson, T. R.: A nonlinear regres-sion model for weekly stream temperatures, Water Resour. Res., 34, 2685–2692, https://doi.org/10.1029/98WR01877, 1998. Ojanguren, A. F., Reyes-Gavilán, F. G., and Braña, F.: Thermal
sensitivity of growth, food intake and activity of juvenile brown trout, J. Therm. Biol., 26, 165–170, 2001.
O’Keeffe, J. H., Palmer, R. W., Byren, B. A., and Davies, B. R.: The effects of impoundment on the physicochemistry of two contrast-ing southern African river systems, River Res. Appl., 5, 97–110, 1990.
Olden, J. D. and Naiman, R. J.: Incorporating thermal regimes into environmental flows assessments: Modifying dam operations to restore freshwater ecosystem integrity, Freshwater Biol., 55, 86– 107, 2010.
Peings, Y., Jamous, M., Planton, S., Le Treut, H., Déqué, M., Gallée, H., and Li, L.: Scénarios régionalisés-Indices de référence pour la métropole, Ministère de l’Écologie, du Développement durable, des Transports et du Logement, Paris, 2012.
Poff, N. L. and Hart, D. D.: How dams vary and why it matters for the emerging science of dam removal, Bioscience, 52, 659–668, 2002.
Poff, N. L., Allan, J. D., Bain, M. B., Karr, J. R., Prestegaard, K. L., Richter, B. D., Sparks, R. E., and Stromberg, J. C.: The natural flow regime. A paradigm for river conservation and restoration, BioScience, 47, 769–784, 1997.
Rader, R. B., Voelz, N. J., and Ward, J. V.: Post-flood recovery of a macroinvertebrate community in a regulated river: resilience of an anthropogenically altered ecosystem, RestorationEcology,
16, 24–33, https://doi.org/10.1111/j.1526-100X.2007.00258.x, 2007.
Schrank, A. J., Rahel, F. J., and Johnstone, H. C.: Evaluating laboratory-derived thermal criteria in the field: an example in-volving Bonneville cutthroat trout, T. Am. Fish. Soc., 132, 100– 109, 2003.
Sigourney, D. B., Letcher, B. H., and Cunjak, R. A.: Influence of Beaver Activity on Summer Growth and Condition of Age-2 At-lantic Salmon Parr, T. Am. Fish. Soc., 135, 1068–1075, 2006. Smith, S. C. F., Meiners, S. J., Hastings, R. P., Thomas, T., and
Colombo, R. E.: Low-Head Dam Impacts on Habitat and the Functional Composition of Fish Communities, River Res. Appl., 33, 680–689, https://doi.org/10.1002/rra.3128, 2017.
Souchon, Y. and Tissot, L.: Synthesis of Thermal Toler-ances of the Common Freshwater Fish Species in Large Western Europe Rivers, Knowledge and Management of Aquatic Ecosystems, EDPsciences/ONEMA, 405, 48, https://doi.org/10.1051/kmae/2012008, 2012.
Steel, E., Beechie, T., Torgersen, C., and Fullerton, A.: Envisioning, Quantifying, and Managing Thermal Regimes on River Networks, BioScience, 67, 506–522, https://doi.org/10.1093/biosci/bix047, 2017.
Ter Braak, C. J. F.: Canonical correspondence analysis: a new eigen-vector technique for multivariate direct gradient analysis, Ecol-ogy, 67, 1167–1179, 1986.
Tissot, L. and Souchon, Y.: Synthèse des tolérances thermiques des principales espèces de poissons des rivières et fleuves de plaine de l’ouest européen, Hydroécol. Appl., 17, 17–76, https://doi.org/10.1051/hydro/2010004, 2010.
Van Looy, K., Piffady, J., Tormos, T., Villeneuve, B., Valette, L., Chandesris, A., and Souchon, Y.: Unravelling River System Im-pairments in Stream Networks with an Integrated Risk Approach, Environ. Manage., 55, 1343–1353, 2015.
Verneaux, J.: Biotypologie de l’écosystème “eau courante”. Déter-minisme approché de la structure biotypologique, Comptes Ren-dus de l’Académie des Sciences de Paris, 284, 77–80, 1977. Verpoorter, C., Kutser, T., Seekell, D. A., and Tranvik, L. J.: A
global inventory of lakes based on high-resolution satellite im-agery, Geophys. Res. Lett., 41, 6396–6402, 2014.
Vose, R. S., Easterling, D. R., and Gleason, B.: Maxi-mum and miniMaxi-mum temperature trends for the globe: An update through 2004, Geophys. Res. Lett., 32, L23822, https://doi.org/10.1029/2005GL024379, 2005.
Ward Jr., J. H.: Hierarchical Grouping to Optimize an Objective Function, J. Am. Stat. Assoc., 58, 236–244, 1963.
Ward, J. V.: Effects of flow patterns below large dams on stream benthos: a review, in: Instream flow needs symposium, edited by: Orsborne, J. F. and Allman, C. H., American Fisheries Society, Bethesda, Maryland, USA, 235–253, 1976.
Ward, J. V. and Stanford, J. A.: The serial discontinuity concept of lotic ecosystems, in: Dynamics of lotic ecosystems, edited by: Fontaine, T. D. and Bartell, S. M., Ann Arbor Science, Ann Ar-bor, Michigan, 29–42, 1983.
Wasson, J. G., Chandesris, A., Pella, H., and Blanc, L.: Typology and reference conditions for surface water bodies in France: the hydro-ecoregion approach, TemaNord, 566, 37–41, 2002. Webb, B. W., Hannah, D. M., Moore, R. D., Brown, L. E., and
Weber, N., Bouwes, N., Pollock, M. M., Volk, C., Wheaton, J. M., Wathen, G., Wirtz, J., and Jordan, C. E.: Alteration of stream temperature by natural and artificial beaver dams, PLOS ONE, 12, e0176313, https://doi.org/10.1371/journal.pone.0176313, 2017.
WMO: International meteorological vocabulary, No. 182, TP. 91, Pp. xvi, 276, Sw. fr. 40, Secretariat of the World Meteorological Organization, Geneva, 1966.
Woodward, G., Perkins, D. M., and Brown, L. E.: Climate change and freshwater ecosystems: Impacts across multiple levels of or-ganization, Philos. T. Roy. Soc. B, 365, 2093–2106, 2010. Zaidel, P.: Impacts of Small, Surface-Release Dams on Stream