www.hydrol-earth-syst-sci.net/18/1467/2014/ doi:10.5194/hess-18-1467-2014
© Author(s) 2014. CC Attribution 3.0 License.
Hydrology and
Earth System
Sciences
Technical Note: Alternative in-stream denitrification equation
for the INCA-N model
J. R. Etheridge1, F. Birgand1, M. R. Burchell II1, A. Lepistö2, K. Rankinen2, and K. Granlund2
1North Carolina State University, Department of Biological and Agricultural Engineering Campus Box 7625,
Raleigh, North Carolina, USA
2Finnish Environment Institute, P.O. Box 140, 00251, Helsinki, Finland
Correspondence to: F. Birgand ([email protected])
Received: 16 July 2013 – Published in Hydrol. Earth Syst. Sci. Discuss.: 29 November 2013 Revised: 9 March 2014 – Accepted: 27 March 2014 – Published: 16 April 2014
Abstract. The Integrated Catchment model for Nitrogen
(INCA-N) is a semi-distributed, process based model that has been used to model the impacts of land use, climate, and land management changes on hydrology and nitrogen loading. An observed problem with the INCA-N model is reproduc-ing low nitrate–nitrogen concentrations durreproduc-ing the summer growing season in some catchments. In this study, the current equation used to simulate the rate of in-stream denitrifica-tion was replaced with an alternate equadenitrifica-tion that uses a mass transfer coefficient and the stream bottom area. The results of simulating in-stream denitrification using the two differ-ent methods were compared for a one year simulation period of the Yläneenjoki catchment in Finland. The alternate equa-tion (Nash–Sutcliffe efficiency = 0.61) simulated concentra-tions during the periods of the growing season with the low-est flow that were closer to the observed concentrations than the current equation (Nash–Sutcliffe efficiency = 0.60), but the results were mixed during other portions of the year. The results of the calibration and validation of the model using the two equations show that the alternate equation will sim-ulate lower nitrate–nitrogen concentrations during the grow-ing season when compared to the current equation, but pro-mote investigation into other errors in the model that may be causing inaccuracies in the modeled concentrations.
1 Introduction
Catchment scale nutrient models can be used to predict the effect of changing land use and climate on nutrient export. The Integrated Catchment model for Nitrogen (INCA-N) is
a catchment scale model that simulates both hydrology and mineral nitrogen processes (Wade et al., 2002; Whitehead et al., 1998). INCA-N has been applied to many European catchments, but one problem has been the overestimation of nitrate–nitrogen (NO3–N) concentrations during the summer
growing season (Jarvie et al., 2002; Rankinen et al., 2006). It is assumed that the current equations used in INCA-N to model in-stream denitrification also take into account other retention mechanisms (O’Shea and Wade, 2009), but results indicate that a retention process such as macrophyte uptake is not accurately represented by the current equations for in-stream denitrification (Jarvie et al., 2002; Rankinen et al., 2006, 2013). Other potential causes of the overestimation of concentrations is too much NO3–N being added from other
sources such as groundwater (Wade et al., 2006, 2008) or the simulated volume of water in the stream being too low. With some simplification it can be shown that the current equation used to simulate in-stream denitrification assumes that the mass of nitrogen removed via in-stream denitrification varies linearly with the mass of NO3–N in the stream (Sect. 2.1).
This approach does not take into account the impact of dilu-tion on the concentradilu-tion gradient that drives the delivery of NO3–N to the stream sediments where denitrification is most
likely to occur (Reddy et al., 1978).
Birgand et al. (2007) proposed the use of a mass trans-fer coefficient (ρ) to quantify in-stream NO3–N retention in
their extensive review of in-stream denitrification in agricul-tural catchments. The mass transfer coefficient multiplied by the NO3–N concentration corresponds to the mass of
al. (2007) recommended that the mass transfer coefficient be used in streams with NO3–N concentrations above 1 mg L−1
based on the premise that above this threshold, the concen-tration gradient would be in a downward direction in accor-dance with the mass transfer coefficient theoretical applica-tion. The goal of this work was to test the equations proposed by Birgand et al. (2007) to determine their effectiveness in improving the simulation of in-stream NO3–N
concentra-tions as the first step in the process of determining/addressing the issue of errors in the simulation of low NO3–N
concen-trations during the growing season in the INCA-N model.
2 Methods
2.1 Estimation of in-stream denitrification as implemented in the INCA-N model
The INCA-N model is a dynamic model that uses a mass bal-ance approach to track the movement of mineral nitrogen in a catchment (Wade et al., 2002; Whitehead et al., 1998). Wade et al. (2002) described the equations for in-stream denitrifi-cation that have been used in the model since version 1.6. INCA-N model version 1.11.10 was used in this study.
Equation (1) shows how the mass of nitrogen removed through in-stream denitrification is calculated in the INCA-N model:
mINCA =
RnC1,t−1V
1000 (1)
wheremINCAis the total mass of nitrogen removed through
in-stream denitrification in a single reach (kg N day−1),Rn
is the temperature adjusted in-stream denitrification rate (day−1),C1,t−1is the in-stream NO3–N concentration on the
previous day (mg L−1), andV is the volume of water stored in the reach (m3).
The denitrification rate (Rn) is temperature dependent, so
it varies daily. The relation between temperature and the den-itrification rate in the INCA-N model are shown in Eq. (2).
Rn =1.047R(T−20) (2)
whereR is the process rate before temperature adjustment (day−1) andT is the in-stream water temperature (◦C).
In the model, the water temperature is assumed to be the same as the air temperature, but a minimum water tempera-ture is defined as a model input. In this simulation, the water temperature was not allowed to drop below 0◦C.
The NO3–N concentration (C1) in the INCA-N model is
calculated using Eq. (3):
C1=
1000mr
V (3)
wheremris the mass of NO3–N in the stream reach (kg). If
V is assumed to be equal toVt−1, then Eq. (1) becomes:
mINCA=Rnmr,t−1 (4)
AlthoughV is not always equal toVt−1, this simplifying
as-sumption is reasonable except immediately following a large precipitation event. Based on Eq. (4), the simulated mass of nitrogen removed via in-stream denitrification in the INCA-N model varies linearly with the mass of nitrogen in the stream assuming a constant water temperature.
2.2 In-stream mass balance of NO3–N as implemented in the INCA-N model
Equation (5) describes the in-stream mass balance calcula-tions for NO3–N used in INCA-N:
dmr
dt =min−
Q mr,t−1×86 400
V −mINCA+
RiC2,t−1V
1000 (5) whereminis the NO3–N input mass from upstream and
non-point sources in the watershed (kg N day−1),Qis the reach discharge (m3s−1),Riis the temperature adjusted in-stream
nitrification rate (day−1), andC2,t−1is the in-stream
ammo-nium concentration on the previous day (mg L−1).
2.3 Estimation of in-stream denitrification using the mass transfer coefficient
Equation (6) was used to calculate the mass of nitrogen re-moved by denitrification using the mass transfer coefficient and the stream bottom area. Equation (6) was adapted from Birgand et al. (2007). ThemINCAin Eq. (5) was replaced with
themaltvalue to model the in-stream NO3–N mass balance:
malt =
ρnA C1,t−1
1000 (6)
where malt is the total mass of nitrogen removed via
in-stream denitrification in a single reach calculated based on the mass transfer coefficient and the stream bottom area (kg N day−1), ρn is the temperature adjusted mass
trans-fer coefficient for nitrogen removal through denitrification (m day−1), andAis the stream bottom area of the reach (m2). The mass transfer coefficient is temperature dependent and is adjusted to temperature variations using an equation sim-ilar to Eq. (2). The assumption that the water temperature never drops below 0◦C was maintained for the mass transfer coefficient.
The equation using the mass transfer coefficient is differ-ent from the equation currdiffer-ently used in the INCA-N model because the mass of nitrogen removed via denitrification changes based on the NO3–N concentration instead of the
mass of NO3–N in the stream. The stream bottom area is
held constant in the model, which is discussed in Sect. 2.4. Basing the mass of NO3–N removed via in-stream
denitri-fication on the NO3–N concentration instead of the mass of
NO3–N in the stream more accurately represents the
down-ward gradient that partially drives the delivery of NO3–N to
2.4 Model calibration
The alternate equation was tested on the portion of the River Yläneenjoki upstream of the Vanhakartano monitoring sta-tion for 2004 (Lepistö et al., 2008). The Yläneenjoki catch-ment is located in southwestern Finland and drains to Lake Pyhäjärvi. The portion of the Yläneenjoki catchment that was modeled was divided into 4 sub-catchments based on previ-ous model applications (Lepistö et al., 2008; Etheridge et al., 2014). The modeled area was 197 km2with 33 % of the land being in agricultural production. The main reach of the River Yläneenjoki has a length of 29 km in the modeled area.
The hydrology portion of the model was calibrated first, followed by the nitrogen portion of the model using the methods described in Granlund et al. (2004) and Etheridge et al. (2014). The hydrology portion of the model was cal-ibrated to continuous flow data at the Vanhakartano moni-toring station by adjusting the flow velocity parameters and time constants for the soil and groundwater zones. The ni-trogen portion of the model was calibrated such that the in-stream nutrient concentrations followed the dynamics of the observed concentrations and were of similar magnitude. This was done by adjusting the nutrient process rates in the model. Data available related to nitrogen process rates ranging from fertilizer application data to rates of denitrification measured experimentally were used to reduce uncertainty in model re-sults. More details about the Yläneenjoki Catchment and the general process used to calibrate the model can be found in Etheridge et al. (2014).
The in-stream denitrification and nitrification are the final two processes that alter nitrogen in the INCA-N model, so it was possible to change the in-stream denitrification cal-culations without changing the results from any other por-tion of the model. The order of calculapor-tions in INCA-N al-lowed the alternate equation calculations to be completed us-ing a spreadsheet instead of alterus-ing the model code. Simu-lations with the alternate in-stream denitrification equation were done using Excel 2007 (Microsoft, Redmond, WA, USA). Equation (5) is the in-stream mass balance equation for NO3–N in the model. The input mass of NO3–N (min),
the reach discharge (Q), the reach volume (V), and the mass of nitrogen that is nitrified in the reach are all outputs of the model. These model outputs were taken directly from the calibrated model and were not altered in this work. The pri-mary change that was made was replacingmINCAwithmalt
in Eq. (5), which changes the concentration of NO3–N in the
stream.
To make the calculations using the alternate equation, the stream bottom area (A) of the modeled reach was esti-mated using ArcGIS (ESRI, Redlands, CA, USA). The main sources of data were a raster map (1 m resolution) of all of the water areas in Finland and a map showing the stream-line of the modeled reach. A buffer was created around the modeled streamline using the analysis tools in ArcGIS. All of the water area from the raster map located within this
buffer was considered the stream bottom area input to the model. The stream bottom areas that were used in this simu-lation were 20 000, 80 000, 200 000, and 160 000 m2for the sub-catchments moving from upstream to downstream. This method may overestimate the stream bottom area of the pri-mary reach as it includes both the stream bottom and the banks in the projected area. This error was considered rea-sonable because the entire stream bottom in the catchment was not included, but denitrification and other retention pro-cesses occur in the tributaries that feed the main channel.
Assuming a constant stream bottom area throughout the modeling period was not an ideal representation of the phys-ical system because the stream width (i.e., submerged width of the stream) will increase with increasing depth and flow. This simplifying assumption was made so that extensive col-lection of channel dimensions was not required and model complexity was not further increased. The wetted stream bot-tom area in natural streams is dynamic, but increasing the wetted area does not necessarily increase denitrification dur-ing periods of higher flow due to the reduction in residence time. As stream flow and depth increase, the amount of time that NO3–N rich water would be exposed to sites suitable
for denitrification decreases, so an increase in the actual wet-ted stream bottom area does not always indicate an increased removal of nitrogen via denitrification. Having a constant stream bottom area in the model may compensate for the ef-fect of water residence time on in-stream denitrification.
When using the alternate equation to calculate the mass of nitrogen removed from the system through in-stream deni-trification, the mass transfer coefficient was the only model input that was changed in the calibration process. An initial ρwas chosen based on values found in published results of many previous studies (Birgand et al., 2007). The calibration results were evaluated based on visual comparison to the ob-served data, theR2value, and the Nash–Sutcliffe (NS) effi-ciency. An NS efficiency greater than zero indicates that the model output is better than using the mean of the observed data (Nash and Sutcliffe, 1970). Theρ was adjusted to pro-duce simulated NO3–N dynamics that most closely followed
the dynamics of the observed concentrations along with ac-ceptable goodness-of-fit values.
2.5 Model validation
2.6 Sensitivity analysis
An added input that is not easily defined is not generally thought of as a model improvement. One drawback of us-ing the mass transfer coefficient alternate equation in the INCA-N model is that it requires an added input of stream bottom area. The method used in this work to estimate the stream bottom area is quick and practical for modeling, but has a high degree of uncertainty. The amount of uncertainty varies depending on the data available for the catchment to be modeled. To better understand the impact that uncertainty in the estimated stream bottom area may have on the results, a simple sensitivity analysis was carried out. In this sensi-tivity analysis the stream bottom area used in the model for each sub-catchment was varied by 20 and 40 %. The impact of varying stream bottom area on the simulated NO3–N
con-centrations and the mass of nitrogen removed via denitrifica-tion were evaluated.
3 Results and discussion
3.1 Model calibration
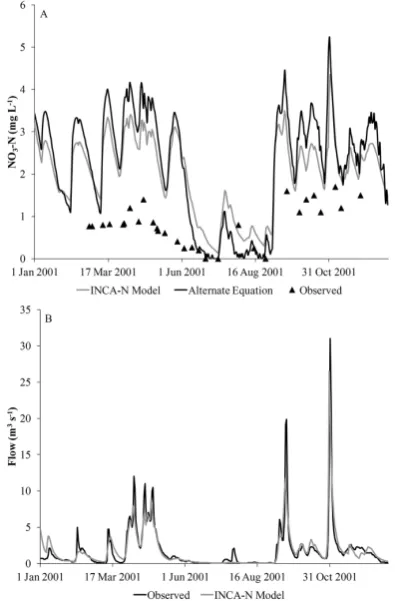
The outputs from the INCA-N model were compared to the results obtained using the alternate in-stream denitrifi-cation equation for the calibration period in Fig. 1a. Based on a visual inspection of the results, the alternate equation simulated the lowest observed concentration in 2004 better than the existing equation. The remainder of the results var-ied with each equation modeling certain observed concen-trations better than the other. The observed concenconcen-trations above 3 mg L−1prior to May 2004 were simulated better by
the alternate equation, but this may have been caused by an incorrect simulation of flow dynamics just prior to this event (Fig. 1b). The simulated flow was closer to the observed flow for the event in February 2004 where the NO3–N
concen-tration simulated using the alternate equation was closer to the observed concentration than the simulation using the cur-rent equation. This may be an example of the simulated mass of nitrogen removed via stream denitrification being in-correctly inflated in the current model due to an increase in the mass of NO3–N in the stream. At the peak
concentra-tion the simulated mass of NO3–N in the stream was more
than six times higher than prior to the event when using the current equation in the INCA-N model. The mass of NO3–
N increased by more than six times when the concentration increased only two times its pre-storm value because the vol-ume of water in the stream also increased. The simulated mass of nitrogen removed via denitrification with the current equation was more than six times higher at the concentration peak when compared to the mass of nitrogen removed via denitrification at the pre-storm low concentration. The simu-lated mass of nitrogen removed via in-stream denitrification at the peak concentration increased only three times that of
Fig. 1. (A) Graph comparing the INCA-N model results to the re-sults with the alternate equation for the calibration period in 2004. (B) Graph of the simulated and observed flows for the calibration period in 2004.
the value at the minimum concentration when using the al-ternate equation.
These results show that the alternate equation simulates lower NO3–N concentrations than the existing equation
dur-ing the portions of the growdur-ing season with little flow. The lower rate of in-stream denitrification simulated by the cur-rent model during these periods is caused by the rate of deni-trification being based on the low simulated mass of NO3–N
in the stream. The low removal of nitrogen via in-stream den-itrification using the current method of modeling the process and the low volume of water in the reach result in elevated concentrations (Eq. 3). It is possible that during this low flow period, the simulated volume of water in the reach was too low. An increase in the simulated volume would result in a lower NO3–N concentration due to dilution. Changes in the
hydrologic portion of the model would also impact the re-sults of the alternate equation, but a change in the calibrated mass transfer coefficient could potentially be used to com-pensate for the changes. It is possible that the lower simulated NO3–N concentrations during the periods with lower flow
[image:4.595.331.526.66.370.2]when compared to the actual stream and the simulated mass of nitrogen removed via in-stream denitrification may be too high.
Using the alternate equation had a negligible impact on the goodness-of-fit values of the modeled results when compared to the observed concentrations. The original INCA-N equa-tion produced anR2value of 0.63 and an NS of 0.60 when comparing the observed NO3–N concentrations to the
simu-lated concentrations. The alternate equation using the mass transfer coefficient produced anR2value of 0.63 and an NS of 0.61. The lack of improved goodness-of-fit values is in-dicative of the observation that each equation produced more accurate simulations at different points during the year.
The calibrated rate of in-stream denitrification in the INCA-N model was 0.145 day−1. This resulted in a total ni-trogen removal due to in-stream denitrification of 65 000 kg for the 12 month modeling period in the 4 sub-catchments. This was equivalent to 30 % of the nitrogen that entered the stream being retained by in-stream processes. A mass transfer coefficient of 0.21 m day−1 was used in the alter-nate equation as it produced the best results through calibra-tion. The nitrogen removal via in-stream denitrification was 44 000 kg or 20 % of the total nitrogen that entered the stream for the alternate equation. The mass of nitrogen removed through denitrification was lower using the alternate equation because it did not simulate as much nitrogen removal during periods of high flow. The lower in-stream retention simulated by the alternate equation was closer to values of between 5 and 15 % that have been estimated in Finnish catchments (Lepistö et al., 2006; Martikainen et al., unpublished). The mass transfer coefficient of 0.21 m day−1used in this model
application was within the range of plausible values based on the review by Birgand et al. (2007) as most of the values in the review were below 0.3 m day−1.
3.2 Model validation
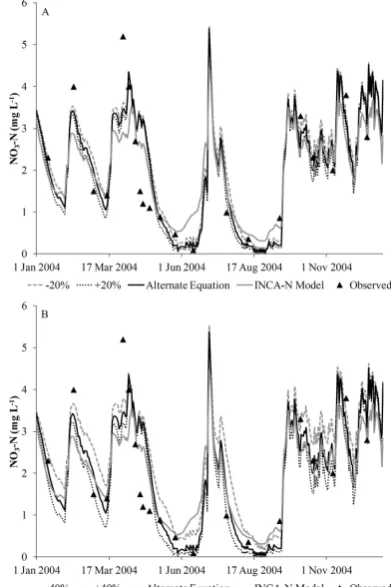
The models using the two different equations were validated for 2001 and the results are shown in Fig. 2. The validation shows that neither the current model nor the model with the alternate equation adequately simulated the observed NO3–
N concentrations prior to June 2001 or after August 2001. This indicates that either the mass of NO3–N input to the
stream was too high or the volume of water simulated in the stream was too low during these periods. During the sum-mer low flow periods, the alternate equation was able to simulate the lowest NO3–N concentrations better than the
equation currently used in the INCA-N model. This could be a result of the uncertainty related to other simulated pro-cesses (e.g., leaching) being lower during this period of time and an improved simulation of in-stream denitrification be-ing shown by the improved simulation of NO3–N
concentra-tions. The low input of flow to the stream through surface water and groundwater would result in lower NO3–N inputs
to the stream; therefore the process most likely to impact
Fig. 2. (A) Graph comparing the INCA-N model results to the re-sults with the alternate equation for the validation period in 2001. (B) Graph of the simulated and observed flows for the validation period in 2001.
the in-stream NO3–N concentrations during this time was
in-stream denitrification. Since in-stream denitrification was likely the dominant process an improved simulation of NO3–
N concentrations could be attributed to an improved simula-tion of denitrificasimula-tion. Basing the simulated mass of nitro-gen removed via denitrification on the mass of NO3–N in the
stream accounts for the dynamics of lower peak concentra-tions and higher minimum concentraconcentra-tions simulated by the current equation when compared to the alternate equation. TheR2values were similar with values of 0.45 and 0.48 for the current equation and alternate equation respectively. The NS efficiency in both cases was below zero.
Although Birgand et al. (2007) recommended using the mass transfer coefficient when the NO3–N concentrations
were greater than 1 mg L−1, it appears that the alternate equa-tion, using the mass transfer coefficient, simulates in-stream denitrification during low flow and low NO3–N
concentra-tion condiconcentra-tions better than the current equaconcentra-tions used in the INCA-N model. It is possible that a downward flux of NO3–
N continued to occur at concentrations below 0.5 mg L−1and
[image:5.595.330.528.66.367.2]3.3 Sensitivity analysis
The impact of varying the stream bottom area by 20 % on the NO3–N concentrations during the calibration period is
shown in Fig. 3a. The average of the NO3–N concentration
increased 0.2 mg L−1when the stream bottom area was de-creased by 20 % and dede-creased 0.1 mg L−1when the stream bottom area was increased by 20 %. The maximum dif-ference in NO3–N concentration based solely on changing
the stream bottom area was a decrease in concentration of 0.4 mg L−1 when the NO3–N concentration was decreasing
following the spike in July 2004. The simulated mass of nitrogen removed via in-stream denitrification was 44 000, 49 000, and 39 000 kg for the calibrated alternate equation model, the model with the stream bottom area increased by 20 %, and the model with stream bottom area decreased by 20 %, respectively. These results indicate that a 20 % change in the stream bottom area does not result in a 20 % change in the simulated in-stream denitrification and that a decrease in the stream bottom area, as would be expected during the low flow periods, still does not raise the NO3–N
concentra-tions simulated by the alternate equation to the level of those simulated using the current equation in the model. Figure 3b shows that a change in stream bottom area of 40 % does not account for the difference between the current equation used in the INCA-N model and the alternate equation, which in-dicates the influence of basing the mass of nitrogen removed via in-stream denitrification on the mass of NO3–N in the
stream versus the NO3–N concentration. Uncertainty in the
stream bottom area measurement can cause changes in the model results, but errors caused by inaccurate measurement of the stream bottom area are smaller than the errors in other portions of the model.
Using the alternate equation in INCA-N may improve the simulation of NO3–N concentrations during the low-flow
portions of the growing season, but may not be addressing the root cause of the overestimation of NO3–N concentrations.
Improvements in the simulation of the volume of water in the stream during the summer could produce similar results. The validation period also shows that the mass of NO3–N going
into the stream is overestimated and needs improvement.
4 Conclusions
Using a short period of time to test the proposed in-stream denitrification equation is not as accurate as doing a multi-ple year calibration in the model, but this work shows that the use of alternate equation results in lower simulated NO3–
N concentrations during the growing season when compared to the alternate equation. During the calibration period the alternate equation shows promise for being able to better simulate peak concentrations. The influence of other factors such as the incorrect simulation of the volume of water in the reach or the mass of NO3–N input to the stream also
Fig. 3. (A) Graph comparing the INCA-N model results to the re-sults with the alternate equation and the alternate equation with the stream bottom area varying±20 % for the calibration period. (B) Graph comparing the INCA-N model results to the results with the alternate equation and the alternate equation with the stream bottom area varying±40 % for the calibration period.
play a major role in the inaccuracy of the simulated NO3–
N concentrations. Further investigation is required into the simulation of the other factors controlling in-stream NO3–
N concentrations, but this work provides evidence that the mass transfer coefficient equation should be considered as an alternate method of modeling the in-stream denitrification in the INCA-N model if the problem of simulating low NO3–N
concentrations during the growing season persists after other factors are investigated.
Acknowledgements. The authors would like to thank the two
anonymous reviewers and the editor for their helpful comments, which greatly improved this technical note. This material is based upon work supported by the National Science Foundation under grant no. DGE-0750733 and by the EU REFRESH project (FP7-ENV-2009-1/244121).
[image:6.595.329.525.67.361.2]References
Birgand, F., Skaggs, R. W., Chescheir, G. M., and Gilliam, J. W.: Nitrogen removal in streams of agricultural catchments – A liter-ature review, Crit. Rev. Environ. Sci. Tech., 37, 381–487, 2007. Etheridge, J. R., Lepistö, A., Granlund, K., Rankinen, K., Birgand,
F., and Burchell, M. R.: Reducing uncertainty in the calibration and validation of the INCA-N model by using soft data, Hydrol. Res., 45, 73–88, 2014.
Granlund, K., Rankinen, K., and Lepistö, A.: Testing the INCA model in a small agricultural catchment in southern Finland, Hy-drol. Earth Syst. Sci., 8, 717–728, doi:10.5194/hess-8-717-2004, 2004.
Jarvie, H. P., Wade, A. J., Butterfield, D., Whitehead, P. G., Tindall, C. I., Virtue, W. A., Dryburgh, W., and McGraw, A.: Modelling nitrogen dynamics and distributions in the River Tweed, Scot-land: an application of the INCA model, Hydrol. Earth Syst. Sci., 6, 433–454, doi:10.5194/hess-6-433-2002, 2002.
Lepistö, A., Granlund, K., Kortelainen, P., and Räike, A.: Nitrogen in river basins: Sources, retention in the surface waters and peat-lands, and fluxes to estuaries in Finland, Sci. Total. Environ., 365, 238–259, 2006.
Lepistö, A., Huttula, T., Bärlund, I., Granlund, K., Härmä, P., Kallio, K., Kiirikki, M., Kirkkala, T., Koponen, S., Koskiaho, J., Kotamäki, N., Lindfors, A., Malve, O., Pyhälahti, T., Tattari, S., and Törmä, M.: New measurement technology, modelling and re-mote sensing in the Säkylän Pyhäjärvi area – Catchlake, Reports of Finnish Environment Institute, Helsinki, Finland, 15, 2008. Nash, J. E. and Sutcliffe, J. V.: River flow forecasting through
con-ceptual models part I – a discussion of principles, J. Hydrol., 10, 282–290, 1970.
O’Shea, L. and Wade, A. J.: Controlling nitrate pollution: An inte-grated approach, Land Use Policy, 26, 799–808, 2009.
Rankinen, K., Karvonen, T., and Butterfield, D.: An application of the GLUE methodology for estimating the parameters of the INCA-N model, Sci. Total Environ., 365, 123–139, 2006. Rankinen, K., Granlund, K., Futter, M. N., Butterfield, D., Wade,
A. J., Skeffington, R., Arvola, L., Veijalainen, N., Huttunen, I., and Lepistö, A.: Controls on inorganic nitrogen leaching from Finnish catchments assessed using a sensitivity and uncertainty analysis of the INCA-N model, Boreal Environ. Res., 18, 373– 386, 2013.
Reddy, K. R., Patrick, W. H., and Phillips, R. E.: The role of nitrate diffusion in determining the order and rate of denitrification in flooded soil: I. Experimental results, Soil Sci. Soc. Am. J., 42, 268–272, 1978.
Wade, A. J., Durand, P., Beaujouan, V., Wessel, W. W., Raat, K. J., Whitehead, P. G., Butterfield, D., Rankinen, K., and Lepisto, A.: A nitrogen model for European catchments: INCA, new model structure and equations, Hydrol. Earth Syst. Sci., 6, 559–582, doi:10.5194/hess-6-559-2002, 2002.
Wade, A. J., Butterfield, D., and Whitehead, P. G.: Towards an im-proved understanding of the nitrate dynamics in lowland, per-meable river-systems: Applications of INCA-N, J. Hydrol., 330, 185–203, 2006.
Wade, A. J., Jackson, B. M., and Butterfield, D.: Over-parameterised, uncertain ’mathematical marionettes’ – How can we best use catchment water quality models? An example of an 80-year catchment-scale nutrient balance, Sci. Total Environ., 400, 52–74, 2008.