www.hydrol-earth-syst-sci.net/18/2325/2014/ doi:10.5194/hess-18-2325-2014
© Author(s) 2014. CC Attribution 3.0 License.
Quantifying the human impact on water resources: a critical review
of the water footprint concept
J. Chenoweth1, M. Hadjikakou1,2, and C. Zoumides3,4
1Centre for Environmental Strategy, University of Surrey, Guildford, Surrey, GU2 7XH, UK
2Water Research Centre, School of Civil & Environmental Engineering, University of New South Wales, Sydney, NSW, 2052, Australia
3Department of Environmental Science and Technology, Cyprus University of Technology, Lemesos, Cyprus 4Energy, Environment and Water Research Center, The Cyprus Institute, P.O. Box 27456, Nicosia 1645, Cyprus
Correspondence to: J. Chenoweth (j.chenoweth@surrey.ac.uk)
Received: 28 June 2013 – Published in Hydrol. Earth Syst. Sci. Discuss.: 17 July 2013 Revised: 25 April 2014 – Accepted: 26 April 2014 – Published: 24 June 2014
Abstract. The water footprint is a consumption-based
indi-cator of water use, referring to the total volume of freshwater used directly and indirectly by a nation or a company, or in the provision of a product or service. Despite widespread en-thusiasm for the development and use of water footprints, some concerns have been raised about the concept and its usefulness. A variety of methodologies have been developed for water footprinting which differ with respect to how they deal with different forms of water use. The result is water footprint estimates which vary dramatically, often creating confusion. Despite these methodological qualms, the concept has had notable success in raising awareness about water use in agricultural and industrial supply chains, by providing a previously unavailable and (seemingly) simple numerical in-dicator of water use. Nevertheless, and even though a range of uses have already been suggested for water footprinting, its policy value remains unclear. Unlike the carbon footprint which provides a universal measure of human impact on the atmosphere’s limited absorptive capacity, the water footprint in its conventional form solely quantifies a single production input without any accounting of the impacts of use, which vary spatially and temporally. Following an extensive review of the literature related to water footprints, this paper criti-cally examines the present uses of the concept, focusing on its current strengths, shortcomings and promising research avenues to advance it.
1 Introduction
Modern human societies use vast amounts of water, with in-creasing competition for scarce water resources impacting heavily on present and future human welfare and the state of our natural environment. As part of the search for an ef-fective sustainability indicator for water resource use, the water footprint has grown rapidly in prominence since being proposed a decade ago. Numerous papers have been pub-lished, conferences held, and an international Water Foot-print Network (WFN) established. Furthermore, the water footprint concept has received increasing press coverage, and a growing number of countries1, companies (Coca-Cola and Nature Conservancy, 2010; Raisio, 2010; Rep, 2011; Pepsi Co, 2011; Nestlé, 2011; SABMiller et al., 2011; Cooper et al., 2011) and organisations (WWF, 2012) have already be-gun or are currently moving towards quantifying aspects of their operations related to water, using the water footprint (Water Footprint Network, 2012). In turn, the International Standardization Organization (ISO, 2014) has considered de-veloping a new international standard for water footprinting in order to complement its existing Life Cycle Assessment (LCA) standard (Raimbault and Humbert, 2011).
The origin of the water footprint stems from the concept of “virtual water” coined by Allan (1997, 2001). Also referred
to as “embedded water” or “hidden water”, virtual water is the volume of water required to grow, produce and pack-age agricultural commodities and consumer goods; the term “virtual” was preferred as the final product usually contains only a small fraction of water compared to the total volume of water actually used for its production. Allan noticed that rather than importing huge quantities of water to achieve food self-sufficiency, a significant number of water scarce countries in the Middle East were importing grains instead. Building upon the concept of virtual water, Hoekstra and Hung (2002) sought to quantify these “virtual water” flows related to international food trade and thus developed the water footprint concept.
From a production perspective, the water footprint is nu-merically equal to the virtual water content of a given prod-uct or service (Zhang et al., 2012); what distinguishes the water footprint from virtual water is that it is also applied at a consumer level, thus creating a consumption-based indica-tor of water use (Velázquez et al., 2011)2. A water footprint refers to the total volume of freshwater consumed directly and indirectly by a nation or a company, or in the provi-sion of a product or service (Hoekstra and Chapagain, 2006; Hoekstra et al., 2009b). In essence, the additional informa-tion provided compared to the tradiinforma-tional, direct water use indicators is that it links human consumption to the space and time of production, accounting for the water use at all the stages along the supply chain of a product. The water foot-print concept provides a useful means for estimating flows of water through trade in foodstuffs, and has succeeded in raising public awareness of the already established but some-what overlooked actuality that the overwhelming majority of global water use takes place in the agricultural sector (Food and Agriculture Organization, 2007). Similarly to virtual water, water footprinting appears to have contributed to mov-ing water issues higher up the political agenda (Wichelns, 2010a).
The water footprint provides a useful means for esti-mating flows of water through international trade in pro-ducts and commodities. Trade in foodstuffs has received the most attention since it accounts for the bulk of water trade flows and relates to important national policy issues such as food security. It has been calculated that the Nether-lands, for example, has an average water footprint of ap-proximately 37.5 Gm3year−1(or 2300 m3year−1capita−1), of which 33.2 Gm3year−1 (corresponding to 89 % of the total) is imported into the country in the form of “virtual water” (van Oel et al., 2009). This indicates that the Nether-lands is a net virtual water importer. This is also true for other EU countries such as the UK, Germany and Italy,
2According to the Water Footprint Network (2012), although the “virtual water content of a product” is the same as the “water foot-print of a product”, the water footfoot-print provides more information with respect to the type of water, as well as where and when that water is being used.
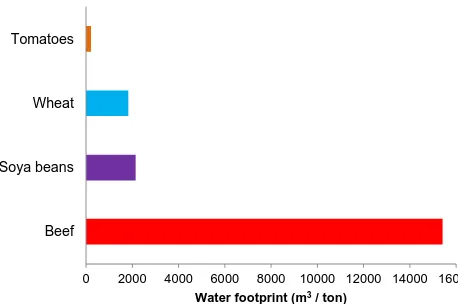
all of which import 60–95 % of their total water footprint (Yu et al., 2010; Hoekstra and Mekonnen, 2012b; Tamea et al., 2013) despite none of them being water scarce ac-cording to the standard indicator of water scarcity proposed by Falkenmark (Falkenmark, 1986; Seckler et al., 1998). Water footprinting also confirms that meat and dairy pro-ducts are usually associated with much greater water use compared to plant products because of the large amounts of feed crops, drinking water and service water required by the animals (Hoekstra and Hung, 2002). A recent study also shows the enormous variation in water use efficien-cies between different animal production systems around the world (Gerbens-Leenes et al., 2013). This is exem-plified by the water footprint of beef (15,415 m3ton−1) (Mekonnen and Hoekstra, 2012a), which clearly dwarfs the average water footprints of most plant products such as tomatoes (214 m3ton−1), wheat (1827 m3ton−1) and soya beans (2145 m3ton−1) (Mekonnen and Hoekstra, 2011b) (see Fig. 1).
Despite the growing enthusiasm for the development and use of water footprints, several researchers have raised signif-icant concerns with respect to the concept and its usefulness, both as a policy tool, as it does not provide sufficient informa-tion on the opportunity cost of water, and as an indicator of sustainability and environmental impact (Wichelns, 2011a, 2010b; Gawel and Bernsen, 2011b, a; Perry, 2014). Fur-thermore, the wide spectrum of methodological approaches currently employed in different sectors and spatiotemporal scales can potentially result in large discrepancies between estimates, creating some understandable scepticism and hes-itance when it comes to interpreting the meaning and rele-vance of different water footprint estimates.
This review firstly considers the importance of method-ological differences such as the overall approach (bottom-up or top-down) to water footprinting, stand-alone or em-bedded in LCA, choice of spatiotemporal scale of analysis, along with their repercussions on the validity and credibility of water footprint results. The review then critically evaluates its usefulness for informing policymakers and consumers by considering the arguments that have been put forward in re-lation to the concept. The review concludes with an appraisal of the current strengths of recent studies and possible present and future options available to researchers, policy-makers, corporations and consumers.
2 Water footprinting methodologies – still a work
in progress
2.1 Bottom-up vs. top-down
41 1
2
Figure 1: The water footprint of selected agricultural products. Data source: Mekonnen and
3
Hoekstra (2012a). Note that these are average global values which show considerable 4
variability from place to place depending on climate and agricultural efficiency (Hoekstra and 5
Chapagain, 2008). 6
7 8 9 10 11
0 2000 4000 6000 8000 10000 12000 14000 16000 Beef
Soya beans Wheat Tomatoes
Water footprint (m3/ ton)
Figure 1. The water footprint of selected agricultural products. Data source: Mekonnen and Hoekstra (2012a). Note that these are ave-rage global values which show considerable variability from place to place depending on climate and agricultural efficiency (Hoekstra and Chapagain, 2008).
(van Oel et al., 2009). The top-down approach for assessing a water footprint is to take the total water use in a country and then add any “virtual water” imports and subtract exports. It is based upon environmental input–output analysis (Leontief, 1970; Munksgaard et al., 2005) and uses data on sectoral water use (within countries), inter-sectoral monetary transac-tions (from national accounts) and trade between countries or regions. Several recent studies appear to favour this approach (Zhang and Anadon, 2014; Cazcarro et al., 2014; Wang et al., 2013). The bottom-up approach was the first to be applied in water footprinting, and is still considered as the more con-ventional of the two. It sums the water used to make the full range of final consumer goods and services consumed in a country, adding up the water use at each stage of the supply chain for each product. Where primary products are processed into more than one product, the water footprint is attributed according to product and value fractions of the de-rived products so as to ensure that there is no double counting of water footprints (Chapagain and Hoekstra, 2004; Feng et al., 2011).
The two approaches have their respective merits and weak-nesses. The bottom-up approach is more widely used due to its relative simplicity (providing more intuitive commodity information) and its increased level of stability (van Oel et al., 2009) (mainly because of a better availability of the nec-essary data). Being process based, the bottom-up approach better captures the direct water use of specific agricultural products, while the top-down approach, that relies on highly aggregated sectoral water use figures, captures entire sup-ply chains and as such can better produce detailed water footprints of industrial products (Feng et al., 2011). The two approaches give significantly different results due to the different computational methods as well as the definitions adopted regarding the sectoral origins of output products. Feng et al. (2011) for example show that for eight key
water-consuming economies (Australia, China, Japan, US, Brazil, Germany, Russia and South Africa), the estimated total water footprints between bottom-up and top-down methodologies vary substantially, despite the fact that both methods were compared using the same input data set. More recently, Chen and Chen (2013) acknowledge the fact that their top-down study obtained significantly smaller global and na-tional water footprints compared to the bottom-up studies of Hoekstra and Chapagain (2006) and Mekonnen and Hoekstra (2011a). Furthermore, the Chen and Chen (2013) study un-surprisingly estimates higher water footprints for processed food, industrial products and services (65 % of total) com-pared to agricultural products (35 % of total), owing to its input–output (top-down) approach. A summary of key con-tributions in the literature to the development of the bottom-up, top-down and other water footprint methodologies is given in Table 1.
2.2 Water “colours”
Due to the differing environmental impacts and opportunity costs of the various forms of water use, the total water foot-print at a national or product level is broken down into sub-categories of blue, green and grey water. Blue water refers to the consumptive volume of surface and groundwater3 used during the production process. The blue water footprint dif-fers from the more traditionally used water withdrawal vol-ume in the sense that it factors in possible return flows, which refer to the volume of water returned to the water body fol-lowing irrigation. A comprehensive definition of the blue water footprint is that it includes all irrigation water and any direct water use in industry or in households, minus return flows (Chapagain and Tickner, 2012). Green water resources have been formally defined as the infiltrated rainfall in the unsaturated soil layer (Falkenmark et al., 2009). The green water footprint therefore refers to the precipitation consumed by a crop through evapotranspiration of moisture stored in the soil (also known as effective or productive precipitation) (Mekonnen and Hoekstra, 2011b), thus constituting the rain-fed component of the water footprint. The grey component of a water footprint is defined as the volume of freshwater required in receiving water bodies for the assimilation of any pollutant resulting from production so that acceptable water quality standards are met (Mekonnen and Hoekstra, 2011b). Thus, the grey water footprint is an estimated measure of the potential water quality impairment caused by the production of a certain good or service. By including all three compo-nents, the water footprint aspires to encompass all kinds of direct and indirect consumptive (blue and green) water use and pollution assimilation (through grey water estimates).
Blue and green water footprints are calculated by mul-tiplying the modelled volume of blue and green water use
[image:3.612.51.280.65.217.2]J. Chenoweth et al.: A critical review of the water footprint concept 2329
(m3output unit−1) by the quantity of production (total out-put). In this way, any rainfall used in situ by the crop (green water) is distinguished within the water footprint of a prod-uct, as well as the volume of irrigation (blue) water assumed to be applied to each crop. The grey water footprint is an estimate of the amount of water needed to assimilate nutri-ents in agricultural runoff, generally calculated by assuming that 10 % of all nitrogen fertiliser applied to a crop is lost via leaching, and taking the average nitrogen application rate by crop in the country being assessed; the assumed fraction of nitrogen leachate is then divided by the maximum acceptable concentration of nitrogen in the receiving water body. The consideration of grey water is relatively new in water foot-printing and was not included in earlier water footfoot-printing studies, such as Chapagain and Hoekstra (2004); it was in-troduced by Chapagain et al. (2006) using the term “dilution water” which later evolved into the concept of grey water.
There is no doubt that the breakdown of a water foot-print into sub-categories provides more information than a footprint consisting of a single number. For example, the estimated global average water footprint for wheat (1827 m3ton−1) breaks down to a green water footprint of 1277 m3ton−1, a blue water footprint of 342 m3ton−1 and a grey water footprint of 207 m3ton−1. Crops frequently grown using irrigation will have higher average blue water footprints than crops that are largely rainfed.
Some crops, an example of which is rice, vary signifi-cantly between countries in the mix of water types used. In the Philippines green water makes up 63 % of the water foot-print of rice whereas in Pakistan blue water makes up 82 % of the water footprint (Chapagain and Hoekstra, 2011); in this case, the higher blue water component per unit of out-put in Pakistan can be explained by the greater use of irriga-tion compared to the Philippines. According to Vanham and Bidoglio (2013), rainfed agriculture is globally the largest productive green water user as only a small share of green water is utilised in irrigated crop systems, whereas irrigated agriculture is globally the largest blue water using sector (the others being industry and households). The blue/green/grey distinction can be used in a similar way to disaggregate na-tional water footprints into their component colours (Fig. 2). The scientific validity of breaking down a water foot-print into its three different “colours” or constituents has been questioned, however, on the grounds that blue and green water are not necessarily discrete categories (Wichelns, 2011a), while grey water is essentially a fictional measure of water pollution that does not reflect either a consump-tive use of water or pollution treatment costs (Gawel and Bernsen, 2011b). Witmer and Cleij (Witmer and Cleij, 2012) indeed argue that the three water “colours” are incompatible as blue and green water are resource use (pressure) indicators while grey water is an environmental impact indicator. Fur-thermore, the inclusion of green water creates inconsistencies between water content figures for agricultural products com-pared to non-agricultural products (Zhang et al., 2011). This
42 2
3 4 5 6
Figure 2: The composition of a national water footprint. It is composed of domestic goods
7
and services plus imports (incoming water) minus exports (outgoing water). Each of these has 8
green/blue/grey components. Data are from Hoekstra & Mekonnen (2012b) and show global 9
averages to illustrate differences in water composition. 10
11 12 13
TOTAL NATIONAL WATER FOOTPRINT
Domestic Water Footprint
Foreign Water Footprint
Green 74% Blue
11% Grey 15%
Blue 11%
Grey 9%
Blue 9%
Grey 91%
Blue 13%
Grey 87%
Blue 13% Green
80%
Blue 13%
Blue 13% Agricultural + Industrial + Domestic - Exports
Grey 19%
Green 68%
Green 68% Grey 19% Imports - Re-exports
Green 68% Grey 19%
+
Figure 2. The composition of a national water footprint. It is composed of domestic goods and services plus imports (in-coming water) minus exports (outgoing water). Each of these has green/blue/grey components. Data are from Hoekstra and Mekonnen (2012b) and show global averages to illustrate differ-ences in water composition.
is because, whereas in agriculture blue and green water can be substituted and both have a certain opportunity cost, this does not apply to products which do not receive agricultural inputs and as such have no green water component.
[image:5.612.307.550.64.296.2]2.3 Attempts to estimate impacts of water use – stand-alone impact-oriented approaches
Within the bottom-up family of approaches, and in addi-tion to the original method proposed by the WFN, there are currently several published methods. Some of these simply elaborate the WFN method whereas others critically argue for omitting or adding certain elements in order to enhance its potential as an impact indicator. Furthermore, some of these methods are proposed as stand-alone procedures (even though some use LCA software) whereas others are designed to be part of a broader and more comprehensive LCA (Berger and Finkbeiner, 2012). This section reviews several of the most important stand-alone alternatives whereas the next sec-tion examines full-blown LCA-oriented approaches.
Sausse (2011) notes that certain studies (e.g. Gerbens-Leenes et al., 2009) define the three water footprint com-ponents, but omit this distinction in the quantification pro-cess, which limits the clarity and usefulness of the concept. Ridoutt and Pfister (2010a) argue that green water should not be included in water footprints since it does not contribute to water scarcity from a water management perspective – green water neither contributes to environmental flows nor is ac-cessible for other productive uses. Rather, since green water is only accessible through the occupation of land it is better considered as an impact of land use within an environmen-tal LCA rather than through water footprinting. In contrast, many authors still argue that green water resources are also limited, scarce and highly variable, and can be substituted by blue water as well as, in the case of agriculture, act as a substitute for blue water (Jefferies et al., 2012), especially in areas where blue water resources are scarce. According to Berger and Finkbeiner (2012), the actual question to be ad-dressed is how the green water footprint affects blue water availability4.
The revised water footprint methodology developed by Ridoutt et al. (2012a) and Pfister and Hellweg (2009) con-siders only consumptive water use, using a stress-weighted blue water footprint calculated by multiplying the blue water footprint at each point of a product’s life cycle by a ge-ographically specific indicator of water stress. Using this methodology for six different beef production systems in Australia, Ridoutt et al. (2012a) estimate water footprints ranging from 3.3 to 221 m3ton−1 of beef (illustrated in Fig. 3). This compares to the global weighted average water footprint calculated by Mekonnen and Hoekstra (2012a) of 15 415 m3ton−1, with the difference largely due to Ridoutt et al.’s (2012a) exclusion of green water and grey water. Ridoutt et al. (2012b) estimate a similarly low water
foot-4In the case of managed forests in Fennoscandian forests, Launiainen et al. (2014) have shown that there is no evidence of forest management having had any effects on evapotranspiration or blue water availability. Nevertheless, this is a context- and climati-cally specific finding which may differ in other environments.
43 1
2 3 4 5 6 7 8 9 10 11 12 13 14 15
Figure 3: A comparison of the water footprints for beef and lamb calculated by Mekonnen
16
and Hoekstra (2012a) and Ridoutt et al (2012a) and Ridoutt et al (2012b), illustrating clearly 17
how different methodological approaches for calculating a water footprint can produce starkly 18
different results. 19
20 21
1 Kg of meat Mekonnen and Hoekstra (2012)
estimate
15,415 litres of water
10,412 litres of water
Ridoutt et al. (2012) estimate
< 221 litres of water
44 litres of water
WATER FOOTPRINT
Figure 3. A comparison of the water footprints for beef and lamb calculated by Mekonnen and Hoekstra (2012a) and Ridoutt et al. (2012a, b), illustrating clearly how different methodological ap-proaches for calculating a water footprint can produce starkly dif-ferent results.
print when they calculate the water footprint of lamb, es-timating a footprint of 44 m3ton−1, compared to the esti-mate 10 412 m3ton−1for lamb of Mekonnen and Hoekstra (2012a) (Fig. 3).
[image:6.612.314.541.65.275.2]Large differences in estimated water footprints frequently occur, even with relatively minor differences in methodolog-ical approaches. Some companies are recently employing the concept of “net green water” which refers to the differ-ence between water evaporated from crops and the water that would have evaporated from natural vegetation (SABMiller and WWF-UK, 2009; Vanham and Bidoglio, 2013). The use of this metric could well lead to negative water footprints in certain cases. A common example is where farming activi-ties have replaced a pre-existing forested catchment. In this case the removal of trees leads to a decrease in evapotranspi-ration, resulting in more soil moisture availability as well as more blue water in the form of surface runoff to rivers and aquifer recharge (Ruprecht and Schofield, 1989).
Herath et al. (2011) compare three methods of calculating the water footprint of hydroelectricity: (a) consumptive water use whereby the volume of water evaporated from a reser-voir is divided by the energy produced by its hydropower plant, (b) net consumptive use whereby land use changes re-sulting from the construction of the dam are considered and thus evapotranspiration that would have occurred from the vegetation which the dam replaced is subtracted from the evaporative water losses, and (c) net water balance whereby both water inputs and outputs from the reservoir are con-sidered and thus the volume of precipitation occurring over the reservoir is subtracted from the evaporative water losses from the reservoir. Approach (a) is the approach suggested by Mekonnen and Hoekstra (2012b). Approaches (b) and (c) are alternative variants of the “net green” approach. The results demonstrate the considerable range in water footprint values depending on the method: approach (a) produces an average water footprint for New Zealand hydro-electric reservoirs of 6.05 m3GJ−1, method (b) 2.72 m3GJ−1 and method (c) 1.55 m3GJ−1. Deurer et al. (2011) similarly estimate the “net blue water” footprint of kiwi fruit production by calculat-ing the net aquifer recharge occurrcalculat-ing beneath kiwi orchards. They subsequently compare this with the water footprint-ing methodology proposed by Hoekstra et al. (2009b), which estimates total water consumed during production. The net blue water footprint averaged −500 L tray−1 5 of kiwi fruit whereas the blue water footprint using the Hoekstra et al. (2009b) methodology was 100 L tray−1. Deurer et al. (2011) found that kiwi fruit production had no impact on freshwa-ter scarcity in soils and thus questioned the usefulness of the green water footprint concept.
Although the methodological possibilities for stand-alone measures are numerous depending on the context, there is as yet no established method that stands out as a gold stan-dard. To a certain extent, the appropriate methodology for a water footprint study should depend on what goal it is try-ing to achieve (Chapagain and Tickner, 2012; Jefferies et al.,
5A tray is defined by the authors as 3.6 kg of fresh produce, and is the standard functional unit of productivity in the New Zealand kiwi fruit industry (Deurer et al., 2011).
2012). However, the diversity of approaches, with their dra-matically different results, means that the outcomes of stud-ies performed by different researchers or organisations may not be compatible. In some cases there may even be a risk of biased outcomes since researchers are more likely to choose the methodology which best gives the desired result.
2.4 Attempts to estimate impacts of water use –
full-blown LCA approaches
Despite the primary aim of this review being to concentrate on the usefulness of stand-alone procedures, the voluminous LCA literature also demands some attention. In an attempt to provide water footprint methods with an improved ability to quantify environmental impact and to complement existing LCA methodologies, several studies have been published in recent years proposing various ways to integrate water foot-prints into LCA inventories (Pfister et al., 2009; Bayart et al., 2010; Boulay et al., 2011a; Milà i Canals et al., 2009; Berger and Finkbeiner, 2010). LCA, a technique which orig-inates from the field of industrial ecology, is a tool capable of measuring the combined effect of several environmental impacts of products across their supply chain (from cradle to grave) (Finnveden et al., 2009). LCA did not traditionally in-clude water consumption (freshwater use) as an impact (Milà i Canals et al., 2009), hence the process of integrating water footprinting into LCA is still relatively new and the proce-dures far from clear-cut, which is, perhaps, a reflection of the state of the concept in general.
A lengthy discussion of the aforementioned and other technical discrepancies is beyond the scope of this review but what becomes clear is that there is still only prelimi-nary scientific consensus with respect to the parameters to consider as well as the methodology to account for water use-related impacts (Núñez et al., 2012). Moreover, as with stand-alone approaches, different methods produce a range of results. Most authors agree that there are certainly advan-tages to incorporating water footprints into the more com-prehensive and tested environmental assessment tool that is LCA (Buckley et al., 2011), the most important being that water use impacts of interest can be comprehensively quan-tified as impact-oriented indicators (Berger and Finkbeiner, 2012). Recently, some authors have introduced a promis-ing stand-alone LCA-based procedure (Ridoutt and Pfister, 2013) which provides another option and yet another possi-bility, however.
Other authors maintain that LCA and conventional water footprints are useful for different purposes (Jefferies et al., 2012). Their main argument is that the volumetric water foot-print approach as defined by the WFN is effective in de-scribing the local and temporal nature of water-related im-pacts, with its focus being on the components at the differ-ent locations as opposed to the final number. Nevertheless, the problem is that this creates the need for interpretation of the separate components of the water footprint which in an impact-oriented LCA approach would be combined into a final impact indicator. An LCA-derived final impact indica-tor does require more intricate modelling and calculation but produces a result which tends to be easier to comprehend for consumers and business.
2.5 Choice of spatiotemporal scale of analysis
According to Hoekstra et al. (2011), there are three major levels where water footprint analysis can be applied, namely global, national/regional and local/corporate level. For each of these spatial applications, there are different temporal explications regarding the data requirements, ranging from mean annual data in the case of global assessments, to daily data in the case of location or corporate specific case studies. Because of these spatiotemporal differences regarding the modelling of input data, the results provided often have dif-ferent end uses. On the one hand, global studies provide static or average results that crudely capture different components of national or crop-specific water footprints. For this reason, global studies (Hoekstra and Mekonnen, 2012b; Chapagain and Hoekstra, 2004; Mekonnen and Hoekstra, 2010b) are not appropriate for policy formulation; as such, they can only be used for comparative purposes in order to raise public aware-ness with regards to agricultural water use, or for developing projections for future water consumption levels at a global level.
The results of global assessments are typically used to quantify the virtual water flows related to food trade (van Oel
et al., 2009; Yu et al., 2010; Hoekstra and Mekonnen, 2012b). On the other hand, local-specific assessments rely on spa-tial and temporally explicit data, and can potenspa-tially provide more relevant results for local policy formulation. For ex-ample, Aldaya et al. (2010b) analysed the crop production water footprint of the Mancha Occidental Region in Spain using monthly average climate data for three distinct years (dry, average and humid). The study revealed that the share of green and blue crop water footprints for typical crops grown in the region can vary substantially between seasons.
Another example is a spatiotemporally explicit soil water balance model for the island of Cyprus (Zoumides et al., 2012, 2013). The model used daily climatic data and community-level land use data for the period 1995–2009. The results of this model were compared with previous global water use assessments of Siebert and Döll (2010) and Mekonnen and Hoekstra (2010a, 2011b) for Cyprus, to re-veal the large discrepancies among estimates. In particular, the Siebert and Döll (2010) estimates for Cyprus were 72 % lower for total green water use and 41 % higher for blue water use for the period 1998–2002, while the Mekonnen and Hoekstra (2011b) average estimates for the period 1996– 2005 were 43 % higher for blue water use and almost identi-cal for green water use. These differences in modelling out-comes are attributed both to different climate and land use data sets, but also to different modelling parameters, such as planting and harvesting dates, soil and other parameters.
The differences between global and local model estimates indicate one of the key issues regarding the credibility and usefulness of the water footprint as environmental impact indicator. Finger (2013) has recently argued that the mean global crop water footprint values that are most frequently cited are not informative enough. This mainly relates to the fact that the spatial heterogeneity in terms of both climate pa-rameters and production systems is poorly captured and re-ported. Furthermore, although the limitations of global water footprint assessments are usually included in academic re-ports, they are not stressed to the same extent when these mean global values are reported in the media or forwarded to policy makers. A recent example is the attempt by the Federal Statistical Office of Germany to establish water foot-print accounts of food products in the country, for the pe-riod 2000–2010 (Flachmann et al., 2012). Although the input statistics are directly derived from the national food-related accounts of Germany, the water footprint values per crop and per country are from the global water footprint assessment of Mekonnen and Hoekstra (2011b).
using location-specific data as well as calibration and vali-dation of model parameters with field data, such studies can potentially result in false estimates and provide the wrong indication both to policy makers and the general public re-garding the internal and external water footprint, and the blue and green water components of production and consumption within a country or region. The same limitation also applies for product-specific water footprint assessments that rely on global water use model estimates (Mekonnen and Hoekstra, 2010b; Van Oel and Hoekstra, 2012; Ercin et al., 2011). Ad-ditional development is required if water footprints are going to be used for sustainability assessments, as the social and economic components require further development and test-ing (Vanham and Bidoglio, 2013). However, it is in sustain-ability assessments and the identification of specific unsus-tainable hot spots in a supply chain which Witmer and Cleij (2012) see as among the major uses of water footprints.
The choice of spatiotemporal scale should depend on what the study is trying to achieve. Using global averages taken from the WFN for a locally specific application is certainly not advisable and is likely to result in erroneous estimations of local water use impacts. This is particularly relevant to businesses wishing to engage in transparent water use es-timates across product supply chains, with potential bene-fits to both their own interests (saving water and reducing costs) as well as for better informing customers. Many com-panies and corporations have already embraced water foot-printing of their operations (Unilever, 2012; Coca-Cola and Nature Conservancy, 2010; Raisio, 2010; Rep, 2011; Pepsi Co, 2011; Nestlé, 2011; SABMiller et al., 2011; Cooper et al., 2011; Ruini et al., 2013; Francke and Castro, 2013).
Nevertheless, it would appear that most studies do not use their own spatially and temporally explicit water footprint values and are potentially basing the analysis of their own operations on previously published global values. Herein lies one of the dangers with conventional water footprints. A company or institution wishing to quantify the water embed-ded in its supply chain must carry out its own estimates of water use at different stages of production and also engage with all its suppliers in order to acquire the most representa-tive water use data for all inputs to production. Making use of existing global figures from the WFN or other figures cal-culated in previous studies is unlikely to provide an insight-ful metric of water use impact along a specific supply chain or lead to reliable environmental hotspot identification (see Sect. 3.2).
3 Uses of water footprints
Despite the growing interest in water footprinting and the continuing refinements and comparisons of alternative methodologies, there has been relatively little critical discus-sion about the purpose or the uses of water footprints, with only a handful of papers questioning its purpose. Uses of
water footprinting suggested by those developing the water footprinting methodologies can be grouped under three broad themes: (i) a tool for assisting water resources management and dealing with water scarcity; (ii) a means of consumer empowerment; and (iii) a way of promoting equity in the use of global water resources.
3.1 A tool for assisting water resources
management and managing water scarcity at national/regional/corporate level
Water footprinting is put forward as a tool for assisting policy development in the water sector by showing the extent of in-terdependence of individual countries on the water resources of other countries (Chapagain et al., 2006) and thus allowing countries to assess their national food security and develop environmental policy (Hoekstra and Mekonnen, 2012b). The ability to quantify in simple terms the hydrological interde-pendencies at the national level is one of the strengths of water footprinting, as prior to the development of water foot-prints such an indicator was lacking.
It has been suggested that water footprinting can help gov-ernments understand the extent to which the size of their national water footprint is due to consumption patterns or inefficient production and thus to prioritise policy actions such as changing consumption patterns or improving the water efficiency of production (Hoekstra and Mekonnen, 2012b; Hoekstra and Chapagain, 2007; Aldaya et al., 2010a; Flachmann et al., 2012). Similarly, water footprinting has been proposed as a tool for exploring whether production sites are suitable for producing crops for export (Chapagain and Orr, 2009; Mekonnen et al., 2012). It has also been sug-gested as a means to assist corporations improve their ef-ficiency of production and minimise water-related business risk by identifying any components of their supply chain which are vulnerable (Coca-Cola and Nature Conservancy, 2010; Ercin et al., 2011). However, by adopting an entirely water-centric approach, other factors, like the livelihoods of those working in agriculture, are largely ignored (Mostert and Raadgever, 2008). It has been argued, for instance, that the main purpose of trade worldwide is not necessarily to re-duce the demand for scarce production inputs but to enhance incomes and well-being, especially when the net benefit of such a policy to the local environment or society is uncertain or poorly justified (Wichelns, 2010b). While water is clearly an input to production, it cannot be the sole criterion for judg-ing the rationality of tradjudg-ing patterns, as trade between coun-tries is determined by a variety of factors such as land, labour, technology, trade agreements and other factors (Aldaya et al., 2010b; Verma et al., 2009).
with the dominant argument being that water-scarce coun-tries should aim at importing water-intensive products from humid countries with abundant water resources. Conceptu-ally, however, it is difficult to see how a water-scarce country can save through international trade something which it never had, and some countries are shown to have saved through food imports more water than they have available locally (Wichelns, 2010b, 2011b). Antonelli et al. (2012) strongly criticise the concept of “savings”, particularly in the case of green water, which is trapped in the soil and cannot possibly be diverted to non-agricultural uses.
Suggesting that a country “loses” water by exporting goods from employment- and wealth-generating industries is also conceptually problematic. While countries need to en-sure that water is allocated in ways that reflect its scarcity and its opportunity cost, water footprinting does not assess the opportunity cost of water (Wichelns, 2010b). Furthermore, there is no consideration of the important concept of eco-nomic water productivity in a basic water footprint (Gleick, 2003). However, water footprints do allow comparisons of economic productivity if results are linked to the gross value added per unit of water used in addition to just product yields per unit of water (Aldaya et al., 2010b). Economic water pro-ductivity (usually measured in dollars per unit of water), im-plies that any comparisons of volumes of water used in the making of agricultural or industrial products must also ac-count for (at least) the economic yield of the water used.
Dividing water footprints into blue, green and grey water footprints has been suggested by Mekonnen and Hoekstra (2010b) as a means to identify ways of saving blue water, which is seen as having a higher opportunity cost than green water. However, the opportunity cost of water use is location-specific: high value rain-fed agricultural land may be scarce in a region where blue water is not scarce, thus blue water will not always have a higher opportunity cost than green water. For example, in the Netherlands 8.7 % of total renew-able (blue) water resources are withdrawn each year, sug-gesting that blue water is not particularly scarce, but arable land is obviously a limited resource (FAO, 2009). This comes back to the argument with respect to the usefulness of the green water concept. Where there is no apparent impact of any green water use on surface or groundwater, its use impact is essentially a land use impact and so should be considered as such via LCA rather than through water footprints.
Water footprints have been suggested as a means to en-courage improved agricultural water efficiency throughout the world. Nevertheless, improving irrigation efficiency does not necessarily save water at the basin scale as it may reduce valuable return flows and limit aquifer recharge (Ward and Pulido-Velazquez, 2008). Watersheds differ with respect to their physical and institutional characteristics, meaning that decisions to achieve more efficient water use are best taken at the water-basin scale, as advocated by more traditional water resources management perspectives (Mitchell, 1990; Bach et al., 2011; Gooch and Stalnacke, 2010). It is along these lines
that some of the recent developments in water footprints have occurred whereby monthly or daily climatic variables have been combined with annual land use and crop production to obtain location- and time-specific water footprints (Aldaya et al., 2010b; Zoumides et al., 2014).
While such developments of the water footprint concept make the results more accurate (rather than just being global averages), policy makers and the media are attracted to the big simple numbers derived from global studies which have little relevance for local water resources management or po-licy making. As the methodology and results of water foot-print analysis becomes more spatially and temporally spe-cific and thus sophisticated, it loses its major strength – an indicator that simplifies complicated data down to a form which is conceptually simple and readily understood. The further water footprints move in this direction, the further they get from their starting point of quantifying the volumes of “virtual water” being traded between countries and their role as a consumer indicator, thus becoming simply another form of local hydrological assessment.
The water footprint is a useful indicator for highlighting in simple terms global or regional hydrological interdepen-dences and drawing attention to water issues but in its ba-sic form its simplicity restricts its usefulness for local water management or policy making while enhancing the indicator to overcome this problem means losing the simplicity.
3.2 A means of consumer empowerment
Water footprinting at the product level has been suggested as a means of empowering consumers by providing informa-tion to allow them to take responsibility for the impact of their consumption (Ridoutt and Pfister, 2010b; Hoekstra and Mekonnen, 2012b; Feng et al., 2012). According to its propo-nents, by empowering the final consumers of products, a tool like water footprinting can extend water management beyond single catchments or countries (Chapagain et al., 2006), thus providing a means to overcome the inadequacies of water governance found in some countries (Ridoutt and Pfister, 2010b).
when, for the sake of simplicity, only total water footprints of products are reported, with no elaboration on what the figure includes and where it was taken from.
Breaking the footprint down into its constituent compo-nents of blue, green and grey waters at the global or na-tional level still does not provide consumers with real infor-mation on the opportunity cost of the water or the environ-mental impact of production, besides the fact that the agri-cultural stages of production are always shown to account for the majority of water use for all three components. It also means that consumers are no longer being provided with a single indicator but a set of indicators. It instead becomes an-other composite sustainability indicator complete with value judgements upon which the weighting is based.
As mentioned above, several companies have already made attempts to calculate water footprints of their activi-ties. Most of these companies have embraced the concept of water footprints, seeing them as a natural follow-up to carbon footprints and offering an additional way to render the environmental impact of their supply chains more trans-parent to consumers. While the credibility of such corporate water footprints can be questioned, as previously discussed, they do appear to force companies to directly consider their use of water in the supply chain and the broader impacts on the aquatic environment. Indeed, Witmer and Cleij (2012) argue that by calculating the water footprint of their supply chains and operations, companies can identify hot spots of environmental impact relating to their water use. Focusing upon these “unsustainable hot spots” they argue would be more beneficial than publishing their overall water footprint in their sustainability report.
Water footprints thus do not provide a means of environ-mental consumer empowerment but through their calculation water footprints may focus corporate attention on the water use of their operations. This may lead corporations to start considering inefficient or unsustainable water use even if a conventional water footprint assessment does not explicitly identify inefficient or unsustainable water use.
3.3 A way of promoting equity of water use and “virtual
water” trade
By quantifying direct and indirect water use, water footprint-ing allows the comparison of total per capita water use in different countries where previously it was only possible to compare direct water use and only within national bound-aries. The inclusion of indirect and external water use allows consideration of the equity and sustainability of consump-tion (Chapagain et al., 2006). Under current producconsump-tion ef-ficiencies, it is not possible for everyone in the world to de-velop water footprints equal to those currently achieved in countries with very high water footprints, such as the US (Hoekstra, 2011). Based upon this concept of inequitable water use, Ridoutt and Pfister (2010b) argue that developed countries, through their supply chains, take a
disproportion-ate share of the world’s wdisproportion-ater resources, and therefore just as greenhouse gas reduction targets have been set, water footprint reduction targets need to be set. Mekonnen and Hoekstra (2010b) suggest that a water scarcity rent on traded products would be another means of tackling the inequality of water resources use and allow externalities to be passed on to the consumers of products. Hoekstra (2011) advocates for water footprint quotas to be allocated to countries on a per capita basis to ensure that their citizens consume a fair proportion of the world’s water resources and thus increase equity in total water use. Furthermore, Hoekstra (2013) and Mekonnen and Hoekstra (2013) suggest that benchmarking values can be used for formulating water footprint reduction targets.
Conversely, it has been argued that the discussion on the equity of water use ignores the fact that water scarcity is a largely local or regional problem where demands on water resources exceed local supplies; if people in one location cut their consumption of water-intensive products it will have little impact on water scarcity in other regions (Wichelns, 2011a). Farmers in the exporting regions would likely adapt by switching to other crops or export markets while carry-ing on uscarry-ing the water, while water-intensive products be-ing consumed may not originate from water-scarce regions in the first place. Suggesting that people in one location are consuming an unfair amount of water because they consume more than people in another region is unhelpful. People liv-ing in humid areas are likely to consume more water than people living in arid areas simply because people tend to make use of the available resources in the area where they live (Wichelns, 2011a). Countries with high total water foot-prints tend to consume water available from their own ter-ritories (Fader et al., 2011), while many of those countries with high external water footprints (such as the Netherlands; van Oel et al., 2009) import goods due to a scarcity of arable land not local water resources (Wichelns, 2010b). To this end, water is just one of the factors influencing a country’s comparative advantage when it comes to trade.
of allowing itself to be exploited by developed countries seeking to externalise their water footprints and associated environmental damage (Gawel and Bernsen, 2013). Apply-ing normative criteria to water footprints and associated “vir-tual water” trading is problematic and suggests that water-related problems need to be tackled according to the specifics of their location. Thus, as an indicator for ethical trade or consumption, water footprints are unhelpful.
4 Water footprinting compared to other “footprint”
indicators
In a globalised world, production and consumption are fre-quently geographically distant, allowing the outsourcing of high environmental impact activities to less developed coun-tries (Galli et al., 2012). As such, indicators are needed to link consumers to the demands they place on the environ-ment. Water footprinting has been suggested as a comple-mentary indicator to the ecological and carbon footprints, with some researchers already considering grouping the three footprints into a “family” of indicators (Fang et al., 2014; Galli et al., 2012). However, the water footprint is fundamen-tally different to both the ecological and carbon footprints (Perry, 2014).
The ecological footprint was introduced by Rees (1992) to measure human consumption in terms of land use, with all consumption being converted into a common metric, global-hectares – the land area needed to sustainedly supply the re-sources used or assimilate the wastes produced. Whereas the ecological footprint considers the land use implications of consumption, the water footprint considers the water use im-plications of consumption (Hoekstra, 2009).
Meanwhile, carbon footprinting measures the total amount of greenhouse gas emissions which are directly or indirectly caused by a product over its life cycle, with carbon footprints expressed in the common metric of kg of CO2 equivalent (Galli et al., 2012). Carbon footprinting thus tries to show the impact of consumption decisions for climate change. Ridoutt and Pfister (2010b) argue that, just like carbon footprinting, water footprinting can create pressure for change. They do, though, point out that, unlike in the case of the carbon foot-print where several companies and countries have set them-selves arbitrary targets, it remains unclear how much reduc-tion in water consumpreduc-tion needs to be achieved at present.
Water footprints, however, are not analogous to either car-bon or ecological footprints, as carcar-bon footprints describe impacts in terms of the limited absorptive capacity of the Earth’s atmosphere of a consumption output and ecological footprints in terms of the productive and absorptive capac-ity6 of scarce land resources (Wichelns, 2011a; Gawel and Bernsen, 2013). Water footprints in their conventional form
6The majority (54 %) of the world’s ecological footprint, accord-ing to the Global Footprint Network, is composed of the land area required to sequester global CO2emissions (Global Footprint
Net-are simply calculations of a single important input used for production or consumption without any accounting of the impacts of use. In the same way that methane and carbon dioxide emissions cannot be compared directly on a kilo-gram level (because of their very different global warming potential), water consumption in places with different water scarcity levels are not comparable (Berger and Finkbeiner, 2012). Products often have complex, spatially disconnected production chains. This means that simply aggregating all local water consumption determined at catchment or river basin level into one figure is physically incorrect (Launiainen et al., 2014). Although with methodological developments like the inclusion of pollution impacts through grey water footprint accounting there have been attempts to incorpo-rate impacts of use, such innovations move water footprints away from being an actual quantitative measure of water used in production. Furthermore, within LCA, there are still several possible characterisation models available for water consumption whereas an internationally agreed characterisa-tion model for carbon footprinting already exists (Berger and Finkbeiner, 2012).
While water may be scarce in some locations, in many re-gions it is not. The impacts of water use vary spatially and thus water saved in a water-abundant region will have no ef-fect on abundance in water-scarce regions. Water availability is also subject to significant seasonal and inter-annual varia-tion in certain places, meaning that the impact of water use can vary markedly from one month or one year to the next. A kilogram of carbon dioxide emitted to the atmosphere has the same impact regardless of where or when the emission occurs but the impact on the environment of a litre of water use will vary dramatically.
Contrasting a hypothetical energy footprint with that of a carbon footprint illustrates what is, perhaps, the key short-coming of water footprints. An energy footprint which in-volves calculating the total energy input required for pro-ducing and supplying a consumer product, would be a poor substitute for the carbon footprint since it would not pro-vide information on the environmental impacts of the en-ergy used. As such, it would provide little useful information to consumers or policy makers. Breaking down energy foot-prints into subcategories, such as a product’s renewable en-ergy and non-renewable enen-ergy footprints, along similar lines to which water footprints have been broken down to green, blue and grey water footprints, would still not provide suf-ficient information to allow useful comparisons of the envi-ronmental impact of two products. A carbon footprint, how-ever, while only assessing a single environmental impact – the climate change impact – does theoretically provide a met-ric for direct comparison of two products for the impact on the atmosphere will be the same where ever the carbon emis-sion occurs (Gawel and Bernsen, 2013). Water footprints are
thus fundamentally different to carbon footprints due to the fact that the former focuses upon a production input with lo-calised environmental characteristics while the latter focuses on an output with global environmental impact.
5 Conclusions: present options and future directions
In this review we have shown that there is still no consensus with regards to both the methodological standard to be em-ployed for water footprinting as well as the actual purpose behind water footprinting. We believe that these two types of uncertainty (methodological and purpose-related) may be re-inforcing each other as part of a vicious cycle. Exhaustive de-bates with respect to the methodological procedures actually detract from the fact that there are numerous proposed uses of the concept, with no universally defined and agreed purpose. To some extent, the purpose of a water footprint assessment is determined by the spatiotemporal scale of application. For broad scale analysis of water use, water footprinting can pro-vide some useful insight through its aggregation of massive quantities of data into simple figures. For real decision mak-ing and policy at the regional and local levels, water foot-prints have limited use because too much critical informa-tion, like the opportunity cost of different water resources, their spatial and temporal dimensions, and the wider socio-economic and environmental context, are currently missing from most applications and assessments.
The recent global water footprint studies distinguish water use into green, blue and grey water footprint com-ponents and attempt to address some of the shortcomings of previous assessments by including environmental flows and monthly variations in water availability (Hoekstra et al., 2012; Hoekstra and Mekonnen, 2012a; Mekonnen and Hoekstra, 2011b). While these revised approaches offer more insight on water-stressed areas compared to worldwide water assessments that do not employ a water footprinting ap-proach (Vörösmarty et al., 2000, 2010; Oki and Kanae, 2006; Döll et al., 2003; Alcamo et al., 2007; Hanasaki et al., 2008), the distinction between different “colours” of water may be debated (based on arguments presented earlier).
In our view, the quantitative components that separate green and blue water are interrelated and their distinction provides further insights. On the other hand, the grey water footprint component is heavily criticised in the literature which implies that it either needs to be abandoned (which would mean that the water footprint concentrates solely on water use without any consideration for water quality) or sig-nificantly developed in order to arrive at an accepted method-ology. It is also important to consider that both recent and previous global water use assessments rely on broad assump-tions with relatively low climate, spatial and temporal reso-lution data compared to locally specific studies. On the one hand, such global assessments offer the advantage of using dynamic models which can incorporate future climate,
popu-lation and economic projections for scenario analysis (Ercin and Hoekstra, 2014). On the other hand, the uncertainties of global assessments are significant and results need to be care-fully interpreted, especially when zooming in to specific lo-cations. In essence, much more hydrological modelling pre-cision and socio-economic information is required for for-mulating such policies, which are currently lacking in water footprint assessments.
When the water footprint framework is applied at regional, river-basin and local levels, model parameters need to be cal-ibrated and validated with field data, and results accompanied by a sensitivity analysis (Bastiaanssen et al., 2007; Zhuo et al., 2014). In addition, blue water footprints need to be distin-guished between surface and groundwater resources, as the potential impacts associated with the use of each blue water source can vary considerably at the local scale (Zoumides et al., 2012, 2013; Dumont et al., 2013) Such complex applica-tions, however, are well established in hydrological sciences, which implies that the actual contribution of the water foot-print concept to water management policy is rather limited (Perry, 2014).
Despite its methodological limitations, the water footprint has succeeded in stimulating the discussion on the inter-linkages between water use, food security and consump-tion (both in terms of different diet types as well as the in-creasing quantities of food produced and consumed world-wide) (Hadjikakou et al., 2013; Vanham and Bidoglio, 2013; Cazcarro et al., 2012). The concept has also stimulated in-creasing attention at the corporate level (Mason, 2013), fa-cilitating companies to begin to consider the environmental impact of their water use. At the present stage of its method-ological development, corporate water footprinting is best carried out through incorporating water use into LCA – a more comprehensive tool which does not focus on a single environmental parameter or production input. There are also some emerging stand-alone procedures (Ridoutt and Pfister, 2013) that make use of LCA methodologies.
Acknowledgements. The authors would like to thank the editor, the three anonymous referees, and also Davy Vanham for their valuable review comments.
Edited by: P. van der Zaag
References
Alcamo, J., Florke, M., and Marker, M.: Future long-term changes in global water resources driven by socio-economic and climatic changes, Hydrolog. Sci. J., 52, 247–275, 2007.
Aldaya, M. M., Garrido, A., Llamas, M. R., Varela-Ortega, C., Novo, P., and Casado, R. R.: Water footprint and virtual water trade in Spain, in: Water Policy in Spain, edited by: Garrido, A. and Llamas, M. R., CRC Press, Leiden, 49–59, 2010a.
Aldaya, M. M., Martinez-Santos, P., and Llamas, M. R.: Incorpo-rating the water footprint and virtual water into policy: Reflec-tions from the Mancha Occidental Region, Spain, Water Resour. Manag., 24, 941–958, 2010b.
Allan, T.: “Virtual Water”: A Long Term Solution for Water Short Middle Eastern Economies?, British Association Festival of Sci-ence, Water and Development Session – TUE.51, 14.45, Univer-sity of Leeds, 9 September 1997 1997.
Allan, T.: The Middle East Water Question: Hydropolitics and the Global Economy, I. B. Tauris, London, 2001.
Antonelli, M., Roson, R., and Sartori, M.: Systemic Input-Output Computation of Green and Blue Virtual Water “Flows” with an Illustration for the Mediterranean Region, Water Resour. Manag., 26, 4133–4146, 2012.
Bastiaanssen, W. G. M., Allen, R. G., Droogers, P., D’urso, G., and Steduto, P.: Twenty-five years modeling irrigated and drained soils: State of the art, Agr. Water Manage., 92, 111–125, 2007. Bach, H., Clausen, T. J., Trang, D. T., Emerton, L., Facon, T., Hofer,
T., Lazarus, K., Muziol, C., Noble, A., Schill, P., Sisouvanh, A., Wensley, C., and Whiting, L.: From local watershed management to integrated river basin management at national and transbound-ary levels, Mekong River Commission, Vientiane, 2011. Bayart, J.-B., Bulle, C., Deschênes, L., Margni, M., Pfister, S.,
Vince, F., and Koehler, A.: A framework for assessing off-stream freshwater use in LCA, Int. J. Life Cycle Ass., 15, 439–453, 2010.
Berger, M. and Finkbeiner, M.: Water Footprinting: How to Ad-dress Water Use in Life Cycle Assessment?, Sustainability, 2, 919–944, 2010.
Berger, M. and Finkbeiner, M.: Methodological challenges in vol-umetric and impact: oriented water footprints, J. Ind. Ecol., 17, 79–89, 2012.
Biewald, A.: Give virtual water a chance! An attempt to rehabilitate the concept, GAIA, 20, 168–170, 2011.
Biewald, A. and Rolinski, S.: The theory of virtual water: Why it can help to understand local water scarcity, GAIA, 21, 88–90, 2012.
Boulay, A.-M., Bouchard, C., Bulle, C., Deschênes, L., and Margni, M.: Categorizing water for LCA inventory, Int. J. Life Cycle Ass., 16, 639–651, 2011a.
Boulay, A.-M., Bulle, C. C., Bayart, J.-B., Deschênes, L., and Margni, M.: Regional characterization of freshwater use in LCA: modeling direct impacts on human health, Environ. Sci. Tech-nol., 45, 8948–8957, 2011b.
Buckley, C., Friedrich, E., and von Blottnitz, H.: Life-cycle assess-ment in the South African water sector: A review and future chal-lenges, Water SA, 37, 719–726, 2011.
Cazcarro, I., Duarte, R., and Sánchez-Chóliz, J.: Water flows in the Spanish economy: agri-food sectors, trade and households diets in an input-output framework, Environ. Sci. Technol., 46, 6530– 6538, 2012.
Cazcarro, I., Hoekstra, A. Y., and Sánchez Chóliz, J.: The water footprint of tourism in Spain, Tourism Manage., 40, 90–101, 2014.
Chapagain, A. and Hoekstra, A.: Water Footprints of Nations: Vol-ume 1: Main Report, UNESCO-IHE Delft, Delft, 2004. Chapagain, A. and Hoekstra, A. Y.: The blue, green and grey water
footprint of rice from production and consumption perspectives, Ecol. Econ., 70, 749–758, 2011.
Chapagain, A. K. and Hoekstra, A. Y.: Virtual water flows between nations in relation to trade in livestock and livestock products, UNESCO-IHE, Delft, 2003.
Chapagain, A. K. and Orr, S.: An improved water footprint method-ology linking global consumption to local water resources: a case of Spanish tomatoes, J. Environ. Manage., 90, 1219–1228, 2009. Chapagain, A. K. and Tickner, D.: Water footprint: Help or
hin-drance?, Water Alternatives, 5, 563–581, 2012.
Chapagain, A. K., Hoekstra, A. Y., Savenije, H. H. G., and Gautam, R.: The water footprint of cotton consumption: as assessment of the impact of worldwide consumption of cotton products on the water resources in the cotton producing countries, Ecol. Econ., 60, 186–203, 2006.
Chen, Z. M. and Chen, G. Q.: Virtual water accounting for the glob-alized world economy: national water footprint and international virtual water trade, Ecol. Indic., 28, 142–149, 2013.
Coca-Cola and Nature Conservancy: Product Water Footprint As-sessments: Practical Application in Corporate Water Steward-ship, The Coca-Cola Company, Atlanta, 2010.
Cooper, T., Fallender, S., Pafumi, J., Dettling, J., Humbert, S., and Lessard, L.: A semiconductor company’s examination of its water footprint approach, in: ISSST 2011: IEEE International Symposium on Sustainable Systems and Technology, Chicago, doi:10.1109/ISSST.2011.5936865, 16–18 May 2011.
Deurer, M., Green, S. R., Clothier, B. E., and Mowatt, A.: Can prod-uct water footprints indicate the hydrological impact of primary production? – A case study of New Zealand kiwifruit, J. Hydrol., 408, 246–256, 2011.
Döll, P., Kaspar, F., and Lehner, B.: A global hydrological model for deriving water availability indicators: model tuning and vali-dation, J. Hydrol., 270, 105–134, 2003.
Dumont, A., Salmoral, G., and Llamas, M. R.: The water footprint of a river basin with a special focus on groundwater: the case of Guadalquivir basin (Spain), Water Resources and Industry, 1, 60–76, 2013.
Ercin, A. E., Aldaya, M. M., and Hoekstra, A. Y.: CCorporate Water Footprint Accounting and Impact Assessment: The Case of the Water Footprint of a Sugar-Containing Carbonated Beverage, Water Resour. Manag., 25, 721–741, 2011.
Ercin, A. E. and Hoekstra, A. Y.: Water footprint scenarios for 2050: A global analysis, Environ. Int., 64, 71–82, 2014.
Fader, M., Gerten, D., Thammer, M., Heinke, J., Lotze-Campen, H., Lucht, W., and Cramer, W.: Internal and external green-blue agri-cultural water footprints of nations, and related water and land savings through trade, Hydrol. Earth Syst. Sci., 15, 1641–1660, doi:10.5194/hess-15-1641-2011, 2011.
Falkenmark, M.: Fresh water – time for a modified approach, Am-bio, 15, 192–200, 1986.
Falkenmark, M., Rockström, J., and Karlberg, L.: Present and future water requirements for feeding humanity, Food Security, 1, 59– 69, 2009.
Fang, K., Heijungs, R., and de Snoo, G. R.: Theoretical exploration for the combination of the ecological, energy, carbon, and water footprints: Overview of a footprint family, Ecol. Indic., 36, 508– 518, 2014.
Food and Agriculture Organization: Aquastat: FAO’s Information System on Water and Agriculture, Land and Water Development Division, Food and Agriculture Organization, 2007.
FAO (Food and Agriculture Organization): Statisti-cal Yearbook 2009: available at: http://www.fao.org/ economic/ess/publications-studies/statistical-yearbook/ fao-statistical-yearbook-2009/a-resources/en/, access: 22 September 2010, 2009.
Feng, K., Chapagain, A. K., Suh, S., Pfister, S., and Hubacek, K.: Comparison of bottom-up and top-down approaches to calculat-ing the water footprints of nations, Econ. Systems Res., 23, 371– 385, 2011.
Feng, K., Siu, Y. L., Guan, D., and Hubacek, K.: Assessing re-gional virtual water flows and water footprints in the Yellow River Basin, China: a consumption based approach, Appl. Ge-ogr., 32, 691–701, 2012.
Finger, R.: More than the mean – A note on heterogeneity aspects in the assessment of water footprints, Ecol. Indic., 29, 145–147, 2013.
Finnveden, G., Hauschild, M. Z., Ekvall, T., Guinée, J., Heijungs, R., Hellweg, S., Köhler, A., Pennington, D., and Sangwon, S.: Recent developments in life cycle assessment, J. Environ. Man-age., 91, 1–21, 2009.
Flachmann, C., Mayer, H., and Manzel, K.: Water Footprint of Food Products in Germany, Statistisches Bundesamt (Federal Statisti-cal Office of Germany), Wiesbaden, 2012.
Francke, I. C. M. and Castro, J. F. W.: Carbon and water footprint analysis of a soapbar produced in Brazil by Natura Cosmetics, Water Resourc. Ind., 1–2, 37–48, doi:10.1016/j.wri.2013.03.003, 2013.
Franke, N. A., Boyacioglu, H., and Hoekstra, A. Y.: Grey water footprint accounting: Tier 1 supporting guidelines, UNESCO-IHE Institute for Water Education, Delft, 2013.
Galli, A., Wiedmann, T., Ercin, E., Knoblauch, D., Ewing, B., and Giljum, S.: Integrated ecological, carbon and water footprint into a “footprint family” of indicators: definition and role in tracking human pressure on the planet, Ecol. Indic., 16, 100–112, 2012. Gawel, E. and Bernsen, K.: Do we really need a water footprint?
Global trade, water scarcity and the limite role of virtual water, GAIA, 20, 162–167, 2011a.
Gawel, E. and Bernsen, K.: The colour of water: what does it tell us about scarcity? Reaction to two articles regarding the virtual water concept, GAIA, 20, 224–228, 2011b.
Gawel, E. and Bernsen, K.: What is wrong with virtual water trad-ing? On the limitations of the virtual water concept, Environ. Plann. C, 31, 168–181, 2013.
Gerbens-Leenes, P. W., Hoekstra, A. Y., and van der Meer, T.: The water footprint of energy from biomass: a quantitative assess-ment and consequences of an increasing share of bio-energy in energy supply, Ecol. Econ., 68, 1052–1060, 2009.
Gerbens-Leenes, P. W., Mekonnen, M. M., and Hoekstra, A. Y.: The water footprint of poultry, pork and beef: A comparative study in different countries and production systems, Water Resources and Industry, 1–2, 25–36, doi:10.1016/j.wri.2013.03.001, 2013. Gleick, P. H.: Water use, Annu. Rev. Env. Resour., 28, 275–314,
2003.
Global Footprint Network: National Ecological Footprint and Bio-capacity for 2007: Results from National Footprint Accounts 2010 edition, Global Footprint Network, Oakland, USA, 2010. Gooch, G. and Stalnacke, P.: Science, Policy and Stakeholders in
Water Management: an Integrated Approach to River Basin Man-agement, Earthscan, London, 2010.
Guieysse, B., Bechet, Q., and Stilton, A.: Variability and uncer-tainty in water demand and water footprint assessments of fresh algae cultivation based on case studies from five climatic regions, Bioresource Technol., 128, 317–323, 2013.
Hadjikakou, M., Chenoweth, J., and Miller, G.: Estimating the di-rect and indidi-rect water use of tourism in the eastern Mediter-ranean, J. Environ. Manage., 114, 548–556, 2013.
Hanasaki, N., Kanae, S., Oki, T., Masuda, K., Motoya, K., Shi-rakawa, N., Shen, Y., and Tanaka, K.: An integrated model for the assessment of global water resources – Part 2: Applica-tions and assessments, Hydrol. Earth Syst. Sci., 12, 1027–1037, doi:10.5194/hess-12-1027-2008, 2008.
Herath, I., Deurer, M., Horne, D., Singh, R., and Clothier, B.: The water footprint of hydroelectricity: a methodological comparison from a case study in New Zealand, J. Clean. Prod., 19, 1582– 1589, 2011.
Hoekstra, A. Y.: Human appropriation of natural capital: a compar-ison of ecological footprint and water footprint analysis, Ecol. Econ., 68, 1963–11974, 2009.
Hoekstra, A. Y.: The Global Dimension of Water Governance: Why the River Basin Approach Is No Longer Sufficient and Why Co-operative Action at Global Level Is Needed, Water, 3, 21–46, 2011.
Hoekstra, A. Y.: Wise freshwater allocation: Water footprint caps by river basin, benchmarks by product and fair water footprint shares by community, UNESCO-IHE, Delft, 2013.
Hoekstra, A. Y. and Chapagain, A. K.: Water footprints of nations: Water use by people as a function of their consumption pattern, Water Resour. Manag., 21, 35–48, 2006.
Hoekstra, A. Y. and Chapagain, A. K.: The water footprints of Mo-rocco and the Netherlands: global water use as a result of do-mestic consumption of agricultural commodities, Ecol. Econ., 64, 143–151, 2007.
Hoekstra, A. Y. and Chapagain, A. K.: Globalization of Water: Sharing the Planet’s Freshwater Resources, Blackwell Publish-ing, Oxford, 2008.