Georgia State University Georgia State University
ScholarWorks @ Georgia State University
ScholarWorks @ Georgia State University
Public Health Theses School of Public Health
Summer 7-29-2010
Epidemiology of Adiposity in Childbearing Ghanaian Women
Epidemiology of Adiposity in Childbearing Ghanaian Women
Emma Roselyne Konan Mrs IPH
Follow this and additional works at: https://scholarworks.gsu.edu/iph_theses
Part of the Public Health Commons
Recommended Citation Recommended Citation
Konan, Emma Roselyne Mrs, "Epidemiology of Adiposity in Childbearing Ghanaian Women." Thesis, Georgia State University, 2010.
https://scholarworks.gsu.edu/iph_theses/138
1
Epidemiology of Adiposity in
2 ABSTRACT
BACKGROUND: The prevalence of adiposity (overweight and obesity) is increasing in among Ghanaian women. The disparity between urban and rural Ghanaian women in adiposity is seldom described due to data paucity. The purpose of this study was to provide a comparative analysis between urban and rural women in regards to the socio-demographic factors associated with adiposity.
METHODS: The analyses used cross-sectional data from the Ghana Demographic Health Survey involving child bearing women ages14 to 49 years old. The eligible population comprised 4848 non-pregnant women (2023 from urban and 2825 from rural areas). Residence-specific (urban versus rural) associations between selected independent variables and adiposity were quantified using odds ratios from univariate and multivariate logistic regression analyses. Stepwise logistic regression analyses were used to describe the variables that were best predictors of adiposity.
RESULTS: The overall crude prevalence of overweight (25.0-29.9 kg/m2) and obesity (≥30kg/m2) were 40% and 18% in urban and rural areas, respectively. There was a positive statistically significant difference between urban and rural women with respect to the distribution of overweight as well as obese (p<.001). Result from the univariate models showed that among rural and urban resident women, older age, higher education, higher wealth, and lack of job was each associated with increased odds of overweight. Compared to Akan women, being of other ethnic group was associated with decreased odds of overweight in women of urban and rural settings. Lack of fruits consumption and Muslim religion were each associated with increased odds of overweight in women who live in rural settings. Consumption of less than 5 fruits in a day was associated with decreased odds of overweight in urban resident women. For urban and rural resident women, wealth index and age were the best predictors for overweight. Older age, higher education, higher weight index, lack of jobs and being other than Akan ethnicity were each associated with increased odds of obesity in urban and rural settings. Compared to married women, being unmarried was associated with increased odds of obesity in urban and rural women. Wealth index was the best predictor variable of obesity in urban women. older age, education, wealth index, having a job, and fruit consumptions were the best predictors of obesity in rural women.
CONCLUSION: Adiposity was more prevalent in urban living women compare to women who reside in rural areas. This finding is critical for planning effective adiposity control in Ghana. Proving education for Ghana women may enhance their wealth and knowledge about adiposity.
3 EPIDEMIOLOGY OF ADIPOSITY IN GHANAIAN WOMEN OF CHILDBEARING AGE: a
comparative study between urban and rural place of residence
By Emma Roselyne Kossere-Konan
MD, Abidjan- Cocody School of Medicine (Ivory Coast)
A thesis submitted to the Graduate Faculty of Georgia State University in Partial Fulfillment of the Requirements for the Degree
Master of Public Health
Atlanta, GA
4
Approval Page
A comparative analysis of the attitudes towards people living with HIV/AIDS between Haiti and the Dominican Republic
By:
Emma Roselyne Kossere-Konan
Approved:
Ike Okosun, MS, MPH, PHD, FRIPH, FRSH Committee Chair:
Rodney Lyn, PhD, MS, Assistant Professor Committee Member:
5 Acknowledgements
To my Savior, the Almighty God: you know me from the womb of my mom thanks for gift of life.
I would like to thank the faculty and staff of Georgia State University’s Institute of Public Health.
I would like to especially acknowledge my thesis committee members, Dr Ike Okosun, Dr
Rodney Lyn for providing guidance and support throughout this process.
To my husband, my parents, my brothers and sisters and my whole family in the Ivory Coast, In
Europe and in the US: I am grateful for your love and support. You always believe in me and lift
me up when I stumble.
To my classmates at Georgia State University and especially to the 2008 Fulbright scholars: I am
thankful for your help, friendship and encouragement.
To the Ivory Coast, you are undergoing a hard moment in your history, you are seeking peace,
6 Authors’ Statement
In presenting this thesis as a partial fulfillment of the requirements for an advanced degree from Georgia State University, I agree that the Library of the University shall make it available for inspection and circulation in accordance with its regulations governing materials of this type. I agree that permission to quote from, to copy from, or to publish this thesis may be granted by the author or, in her absence, by the professor under whose direction it was written, or in his absence, by the Associate Dean, College of Health and Human Sciences. Such quoting, copying, or publishing must be solely for scholarly purposes and will not involve any potential financial gain. It is understood that any copying from or publication of this dissertation which involves potential financial gain will not be allowed without written permission of the author.
______________________________ Signature of the Author
7 Notice to Borrowers
All these deposited in the Georgia State University Library must be used in accordance with the stipulations described by the author in the preceding statement.
The author of this thesis is:
Emma Roselyne Kossere-Konan 737 Twin Oaks Drive, Apt # 4 Atlanta, GA 30030
The Chair of the committee for this thesis is:
Ike Okosun, MS, MPH, PHD, FRIPH, FRSH
College of Health and Human Sciences
Georgia State University
P.O. BOX 4018
Atlanta, GA 30302-4018
Users of this thesis who not regularly enrolled as student as Georgia State University are required to attest acceptance of the preceding stipulation by signing below. Libraries borrowing this thesis for the use of their patrons are required to see that each user records here the information requested.
NAME OF USER ADDRESS DATE TYPE OF USE
(EXAMINATION ONLY FOR COPYING
8 737 Twin Oaks Drive, No # 4 Decatur, GA, 30030
Mobile: 404 437 0618 [email protected]
EDUCATION and ACADEMIC DEGREES
• Georgia State University, Atlanta GA
MPH with concentration in Epidemiology 2010
• University of Abidjan, Faculty of Medicine, Côte d’Ivoire
Diploma in Emergency Medical Services 2004
• University of Abidjan, Faculty of Medicine, Côte d’Ivoire
MD 2003
Volunteer
Health condition of the African Diaspora: 2008 – 2009
HealthSTAT Childhood Obesity Prevention Initiative 2009
Intern CDC-DGPHCD 2009
SKILLS: MS office package, Epi-Info program, SPSS 18.0 for Windows, SAS, PowerPoint, Excel
HONORS
• Fulbright Scholar (Foreign Student Programfor a Master in Public Health at Georgia State University, Atlanta, USA) 2008 - 2010
AFFILIATION AND MEMBERSHIP
• Member of the American College of Sports Medicine (ACSM)
9 TABLE OF CONTENTS
CHAPTER I: INTRODUCTION ………PAGE 1
1. Background ………PAGE 1
2. Defining Adiposity……….…PAGE 3
3. Purpose of the Study……….. PAGE 4
4. The Theoretical Framework………...…PAGE 5
5. Current status of Ghanaian women……… PAGE 8
CHAPTER II:LITERATURE REVIEW……… PAGE 9
2.1 The pandemic of adiposity in the world……….PAGE20
2.2 The demographic and socio-economic transition in developing countries public health implications………...PAGE 23
2.3Ghanaian current food situation, norms and values and impact women…. PAGE 25
CHAPTER III: METHODS AND PROCEDURES……….. PAGE 27
3.1 Data Source………...PAGE 27
3.2 Study Variables………..PAGE 27
3.2. 1 list of independent variables ……… PAGE 28
3. 2. 1 list of dependent variables ……….. PAGE 29
3.3 Statistical Analysis………PAGE 29
CHAPTER IV: RESULTS ...PAGE 31
4.1 Descriptive Epidemiology………... PAGE 31
10 CHAPTER V:DISCUSSION AND CONCLUSION ………...PAGE 39
5.1 Discussion………. PAGE 39
5.2 Limitations……… ………PAGE 43
5.3 Recommendations for Future Research……….PAGE 44
5.4 Conclusion……… ……… PAGE 44
REFERENCES ………..PAGE 45
11
CHAPTER 1:
INTRODUCTION
1.1 Background
Adiposity including overweight and obesity is a major disease worldwide (WHO Monica
1989) and is major risk factor to many chronic diseases. Obesity is associated with increased risk
for type 2 diabetes mellitus, hypertension, cardiovascular disease, stroke, hyper-lipidemia and
certain types of cancers (Bray, 1996; Burton, 1985). Although genetic pattern may be
underlying certain cases, most chronic diseases are preventable through behavioral changes at
individual and community levels and also policies adjustment at the government level.
The obesity pandemic originated in the US and crossed to Europe and the world’s other
rich nations before, remarkably, it penetrated even the world’s poorest countries especially in
their urban areas (Prentice, 2006). The WHO even warns that the greater future burden of
adiposity and diabetes will affect developing countries and the projected numbers of new cases
of diabetes run into the hundreds of millions within the next two decades (WHO: Obesity, 2000).
The pandemic is transmitted through the vectors of subsidized agriculture and multinational
companies providing cheap, highly refined fats, oils and carbohydrates, labor-saving mechanized
devices, affordable motorized transport, and the seductions of sedentary hobbies such as
television (Prentice, 2006). Yet, public health awareness alerts have triggered two alternative
interventions: First, specialists prescribe and implement medical interventions comprising
medication, physical activity and surgery to treat patients. Secondly, another alternative consists
of preventive protocols and ongoing legislative actions to contain the spread. Preventive
measures are the hope for the future so that in the US, in Europe and other western countries
12 In developing countries almost three decades ago, the WHO in collaboration with
international nutritionists and experts were looking for interventions to assist starving
populations, particularly children and childbearing women; today, those experts are seeking
strategies to minimize the effects of overeating or at least improperly eating on the said-starving
populations years ago. In Africa, the ongoing nutritional transition, along with certain
socio-cultural beliefs are fertile grounds for both undernourished infants living in the same household
with oversized mothers. Unfortunately, little is known about the epidemiology of adiposity in the
sub-Saharan region of Africa. Populations, although unaware of the alarming statistics on obesity
by the WHO, continue to suffer and die from diseases associated with adiposity (Boutayeb,
2006). Adding to other causes of adiposity already diagnosed in developed countries, factors
such as illiteracy, poverty and social inequities are significant contributors to its emergence in
Sub-Saharan Africa where the prevalence of adiposity is said to be 1.5 to 2 times higher among
women than men (Scidell, 2005).
In Ghana particularly, some studies confirm this trend in the Capital city, Accra. However,
very few epidemiology studies have been conducted on women in the country. The Demographic
Health Survey (DHS), funded by the United State Agency for International Development
(USAID), has collected nationally representative data on anthropometric measurements, diet,
physical activity and socio-demographic information in more than 80 countries around the world
including Ghana. The DHS contains questionnaires that serve as valuable indicators of adiposity
13 1.2Defining adiposity
Adiposity or obesity is defined based on the WHO criteria as abnormal or excessive fat
accumulation that present a risk to health (WHO, 2000). The most common and crude measure
of obesity is the Body Mass Index (BMI) or Quetelet Index. The BMI is a statistical measure
which compares a person’s weight and height. The BMI is a good tool to screen for problems in
weight status that may lead to health hazards. An adult who has a BMI between 25 and 29.9 is
considered overweight. An adult who has a BMI of 30 or higher is considered obese (CDC,
2008). The BMI, however has some limitations when used with some categories of persons. For
example because athletes have a disproportionately higher muscle mass for a given height, their
BMI calculation often places them in the high risk categories for many chronic diseases. In such
cases, an assessment of body composition is required to determine how much of the body weight
is composed of fat and nonfat tissues.
Other methods exist to estimate body fat and fat distribution including measurements of skinfold
thickness and waist circumference, calculation of waist-to-hip circumference ratios and
techniques such as ultrasound, hydrostatic weighting, computed tomography, and magnetic
resonance imaging (MRI). All these techniques measure a person’s:
- Body composition: the ratio of person’s body fat to lean body mass
- Body fat mass: the amount of body fat, or adipose tissue, a person has.
- Lean body mass: the amount of fat-free tissue, or bone, muscle, and internal organs, a
person has (CDC, 2008).
14 The primary purpose of this study is to determine socio-demographic factors that are
associated with overweight and obesity in child bearing women respondent to the Ghana
Demographic Health Survey. First, the study will conduct a review of the literature for an
accurate understanding of the economic and nutrition transition ongoing in developing countries
like Ghana. Second, the study will examine the consequences of that transition at a public health
level. The study will conduct a comparative analysis by type of place of residence: urban versus
rural. Finally, the study will propose some recommendations for public health interventions in
order to contain the obesity trend in Ghanaian women.
The main research questions will be:
1- Is there any association between the type of place of residence and obesity prevalence
in Childbearing women
2- Is there any difference in adiposity of the respondents in urban versus rural according
to their socio-demographic status?
3- Is there any difference in obesity between women living in rural and urban areas according to their diet and physical activity level?
15 1.4The Theoretical Framework
Despite the scientific knowledge, the prevention campaigns and other educational programs,
obesity has progressed from the USA in the past three decades, to Europe, Australia and now
reaching into developing countries. Thus, it should be considered a pandemic (James, 1992).
Obesity is the result of imbalance between energy intake and energy expenditure. The energy
intake is the composition of food and drink and the expenditure relates to physical activity.
Changes in weight equal energy intake minus energy expenditure. Traditionally,
overweight/obesity treatment consisted only in finding, at an individual level, the best way to
recreate the energy balance. Public Health campaigns encouraged populations either to reduce
the amount of food consumed or to increase the level of physical activity. This approach has
shown limited success.
Obesity, like HIV/AIDS, is a real public health threat to our millennium. Many public health
professionals have tried to understand the problem that goes beyond individual behaviors alone
to include other factors. A contemporary approach suggests that environment surrounding the
individual is a determinant in the occurrence of disease.
Intervention models are, therefore, dominated by a socio-ecological model which tends to
intervene at different levels. The Jane Moore socio-ecological model has five levels of
intervention: the individual level, interpersonal level, the organizational level, the community
16 Figure 1: The Socio-ecological Model by Jane Moore
Socio-Ecological Model--Looking Beyond the Individual
What are ALL the Factors That Influence Your Weight? Is It JUST You?
The World We Live In InfluencesUs.
17 Figure 2: Social Ecological model in a nutshell
Social Norms and Values
Primary and Secondary Leverages
• Food and Agriculture . Education . Media .
Government . Public Health . health Care
Behavioral Settings
• Home . Work . Market .
Farms . .Ponds . Churches, Mosques,
Genetic, Psychosocial, and other Personal Factors
Physical Activity Food and
Beverage Intake
Energy Intake
Energy Expenditure
Energy Imbalance
18 The socio-ecological model recognizes the interwoven relationship that exists between
the individuals and their environment.
• While individuals are responsible for instituting and maintaining the lifestyle changes
necessary to reduce risk and improve health, individual behavior is determined to a large
extent by social environment, e.g. community norms and values, regulations, and policies.
• Barriers to healthy behaviors are shared among the community as a whole. As these
barriers are lowered or removed, behavior change becomes more achievable and
sustainable.
• The most effective approach leading to healthy behaviors is a combination of the efforts
at all levels--individual, interpersonal, organizational, community, and public policy.
Many factors may influence Ghanaian women weight; they are described as (figure 2):
• Social norms and values in Ghanaian society. Example overweight labeled as beauty stereotype
• Political stability, development of Western and Global business. Example emergence of affordable fast food, improvement of living standard and the use of motorized transportation
• Behavioral factors including the person’s values, culture, exposure as well as community life. Example consumption of fried food and sweet beverages, extensive TV viewing • Intra-personal factors including biological and psycho-social factors. Example family
history of diabetes, eating disorder etc
19 • Current status of Ghanaian women
The last Friday in February each year, has been declared by The African Union Executive
Council Africa Healthy Lifestyle Day. In 2006 the day was celebrated in Ghana under the theme
‘’Food, Fun, and Fitness: Health is Wealth. The day was celebrated within the World Health
Organization (WHO) program for prevention and control of non-communicable disease (The
Ghanaian Journal, 2010). Ghanaians have been encouraged to embrace behavioral changes for a
new lifestyle including a healthy diet and physical activity in order “to stay healthy and live
longer” (Amoah, spring 2003).
The research question in this thesis is grounded on this advertising slogan to find out sources of
data as baselines to evaluate the association between environmental factors and risk behaviors in
Ghanaian women in both urban and rural areas. This study is designed to provide further
understanding of the socio-demographic factors that are associated with adiposity in child
bearing women in Ghana. The analysis will compare the rates of adiposity and its associated
factors in women in rural areas to those living in cities with the ultimate goal of suggesting
20 CHAPTER 2:
LITERATURE REVIEW
In order to better understand the Ghanaian specific adiposity problem, the literature will
first, discuss obesity as a pandemic; next the paper will review the ongoing economic and
nutritional transition in developing countries and its public health implications. Third, the
literature will explain the Ghanaian current food situation, norms and values and how those
factors are related to the prevalence of adiposity in women.
2.1The pandemic of adiposity in the world
In 2003 the World Health Organization statistics declared more than one billion adults
overweight worldwide with at least 300 million of them clinical clinically obese. About 75% of
cardiovascular diseases (CVD) can be attributed to high cholesterol, high blood pressure, low
fruit and vegetable intake, inactive lifestyle and tobacco (WHO, 2003).
In the USA
During the past 20 years there has been a dramatic increase in obesity in the United States.
In 2008, only one state (Colorado) had a prevalence of obesity less than 20%. Thirty-two states
had prevalence equal to or greater than 25%; six of these states (Alabama, Mississippi,
Oklahoma, South Carolina, Tennessee, and West Virginia) had a prevalence of obesity equal to
or greater than 30%. Results from the 2007-2008 National Health and Nutrition Examination
Survey (NHANES), using measured heights and weights, indicate that an estimated 17 percent of
children and adolescents ages 2-19 years are obese. The age-adjusted percentage of adults aged
≥20 years who were obese during 2003--2006 varied by race/ethnicity among women, ranging
from 53.3% for non-Hispanic black women to 41.8% for Mexican-American women and 31.6% for non-Hispanic white women. Obesity levels were more similar for Mexican-American men
21 In 1999 the Center for Disease Control and Prevention (CDC, 2008) created a Division of
Nutrition, Physical Activity, and Obesity (DNPAO) to address the obesity epidemic and other
chronic diseases in the US. In 2010 the division funds about 25 states through efforts coordinated
with multiple partners. The program main objective is to create policy and environment changes
to improve the health places where Americans live, work, learn and play. The DNPAO is
currently providing a variety of nutrition and physical activity strategies to the 25 states targeted
(CDC, 2008).
In Europe
From 1958 to 1964 a survey was conducted on seven countries in northern and southern
Europe on men aged 40 to 59. The cohort was followed up with a systematic analysis of ten year
coronary heart disease incidence in order to produce a European coronary risk charts (Menotti,
2000). The Survey estimated between 15 to 20 % of European men to be obese (Kromhout,
2001). In 1995, the United Kingdom Department of Health showed that the prevalence of obesity
in women had almost tripled from 8% to 21% between 1980 and 1998. In 1998, the Health
Survey Unit for England found more than half the population to be overweight or obese. For
those at risk of obesity-associated diseases with a body mass index equal or superior to 22kg.m -2
22 In Australia
The most recent Australian National Health survey (NHS) data on overweight and
obesity for adults aged 18–75 was based on self-reported BMI data from 2004 to 2005.
Self-reported data are considered less reliable than measured data because people tend to overestimate
their height and underestimate their weight. However, the survey showed alarming results:
32.6% of adults were reported as overweight with 40.5% males and 24.9% females. 16.4% of
adults were reported as obese with 17.8% male versus 15.1% females.
The NHS showed higher rates of overweight or obesity in older age groups. Those in the 55–64
age groups had the highest combined rates of overweight and obesity; 72% of males and 58% of
females. The prevalence of overweight and obesity increased markedly between 1995 and
2004-2005, according to historical data presented in the 2004-2005 NHS. Levels of overweight
increased from 29.5% reported in the 1995 NHS to 32.6% in 2004-2005. At the more severe end
of the spectrum, the prevalence of obesity among Australian adults was 11.1% in 1995, rising to
16.4% from 2004 to 2005(Australian Bureau of Statistics, 2007).
23 Experts use the term ‘’epidemiological transition’’ to understand changing ecological
relationships between humans, pathogens and other hazards. The first transition was
characterized by ecological and social relationships that minimized the impact of infectious
disease. Later a second epidemiological transition in which public health measures improved
nutrition and medicine resulted in declines in infectious disease and a rise in non-infectious
disease, chronic and degenerative diseases. Later again those populations (mainly in developed
countries) who were at their second transition underwent a third transition with the emergence of
new diseases and also reemergence of ancient infectious diseases (Armelagos, 2005). Most
developing countries are undergoing, at the same time demographic, economic and
epidemiologic transitions resulting in many threats. In 1997 the WHO Expert consultation on
Obesity warned that the obesity epidemic was penetrating the poorest nations in the world, first,
among urban middle-aged adults but increasingly affecting semi-urban and rural areas, and
younger age groups (Prentice, 2006). Some nutritionists have tried to explain this trend by the
shift in the overall structure of dietary patterns in Asian, Latin American, Northern African,
Middle Eastern, and urban sub-African populations. Major dietary changes have included a large
increase in the consumption of fat and added sugar in the diet, often a marked increase in animal
food products contrasted with a fall in total cereal intake and fiber. In Asia for instance, a major
component appears to be the increase in amount of edible oils in the diet (Popkin, 2001). Experts
conclude their analyses saying that dietary fat has a determinant role in the development of
obesity (Bray, 1998).
Experts highlight another determinant of obesity, that is, populations’ daily energy
expenditure. They warn that several changes in physical activity patterns are occurring rapidly
and jointly. One is a shift away from the high-energy expenditure activities such as farming,
24 occupation are the second change. Other major changes relate to the modes of transportation and
activity patterns during leisure hours (Popkin, 2004). In either case, the statistics on excess
dietary fats and insufficient energy expenditure or both, are alarming. In Ecuador, for instance,
studies evaluating chronic disease associated with overweight and obesity have shown that death
from heart disease remained stable among Ecuadorian women between 1970 and 200 at 21% to
22% of all deaths, whereas for men it climbed from 32% to 36% (Rodriguez, 2002).
Death from diabetes rose from 8% of all deaths to 18% for men between 1990 and 2000;
for women during the same time period it rose from 11% to 22% (WHO, 2000). Metabolic
syndrome (a condition associated with excess weight and increased risk for cardiovascular
disease and defined by the presence of any three of the following: hypertension,
hyper-triglycidemia, central obesity, low level of high density lipoprotein cholesterol, and elevated
fasting glucose) among post-menopausal women in thecity of Guayaquil was recently estimated
at 41% (Hidalgo, 2006). Trends in obesity-related cancer mortality such as postmenopausal
breast cancer and endometrial cancer were difficult to estimate (Bosetti, 2005). Martorell et al.
(2000) estimated obesity in women aged 14 to 49 from developing countries from 38 nationally
representative surveys carried out in the last decade. A total of 147,938 non-pregnant women
were included in the analyses. The percentage of obese 0.1 % in South Asia, 2.5% in sub-Sahara
Africa, 9.6% in Latin America and the Caribbean, 17.2% in the Middle East and North Africa.
Levels of obesity in countries increased sharply until a gross national product of $ 1500 per
capita (1992 values) was reached and changed little thereafter. In very poor countries, such as in
Sub-Saharan Africa, obesity levels were greatly concentrated among urban and higher educated
women. The study of Belahsen in Morocco and some others in Cameroon and The Ivory Coast
had the same results of higher prevalence of adiposity in childbearing women living in urban
25 either overweight or obese. The prevalence of obesity showed considerable variation with age in both genders. Among women, using waist-to-hip ratio and waist circumference yielded the
highest prevalence of obesity (28%) and body mass index the lowest (19.5%). There was a trend
towards an increase in age-adjusted odd ratios of being overweight or obese with duration of
education in both sexes (Kamadjeu, 2006). The Ivory Coast and Ghana are close to each other
and share a border on the eastern side of Ghana. Akan populations, the main ethnic group in
Ghana, are also found in The Ivory Coast. They have in common the same diet and socio-cultural
customs. The results of a study on 3180 non-pregnant women from the Ivory Coast determine the
prevalence of 11% overweight and 7.4 % obese (Martorell, 2000).
2.3 Ghanaian current food situation, norms and values and impact women
Nutritionists assert that the cultural background determines what is eaten as well as when
and how. People’s culture influences the kind of foods they eat. What the African communities
eat can be viewed in the context of the diverse socio-cultural and economic environment.
Traditionally, Africans eat more grain foods, but most of them consume less than one serving of
fruits per day. West African populations, like Ghanaians’ communities, rely on one or two staple
crops generally maize, teff, cassava, yam, sweet potato, plantain, and enset. The crops provide
the bulk of energy intake of the household members. To balance their diet, consumers
complement staple food with legumes or foods from animal sources that are rich in proteins and
fat/oil. With a few exceptions, all sub-Saharan ethnic groups’ cuisine has the basic format that
consists of a starchy food eaten with a sauce or dip, which may or may not be spicy (Oniang,
2003). However, in Ghana like in most countries in Africa rapid urbanization amidst poorly
performing economies has resulted into a large proportion of urban residents being poor with
limited access to social amenities (UN, 2006; Cohen, 2004). In spite of rampant poverty in urban
areas, access to cheap foods with high content of fat and sugar among the urban poor is easier
26 responsible for increasing rates of adiposity in Ghana. Ghanaians view fatness as beauty and sign
of prosperity therefore, men generally prefer looking bigger and choose obese –like women to
thinner ones (Amoah, June 2003). On the National Lifestyle Day 2005 The Head of NCDs of
Ghana Health Service (GHS) said in an interview ‘’Younger and younger people are now
suffering from hypertension, stroke and certain cancers. Non-Communicable Diseases (NCDs)
are often costly to treat and require lifelong treatment as many are not curable and so ‘’the best
27 CHAPTER 3:
METHODS AND PROCEDURES
3.1 Data Source
The 2008 Ghana Demographic Health Survey (GDHS) was used for this study. The
GDHS was carried out by the Ghana Statistical Service and the Ghana Health Survey. The cost
of the Survey was shared by the Ghanaian Ministry of Health (MOH), the Ghanaian Statistical
Service and AIDS commission, UNICEF, and UNFPA. The survey provides current information
on the population and health situation in the country. Data collected include total Ghanaian
population, urban and rural populations, fertility, family planning, maternal and child health and
nutrition, childhood mortality, HIV/AIDS-related knowledge and behavior and domestic
violence. The GDHS used data from a Ghanaian representative sample including rural and urban
regions throughout the country. 11,778 households were interviewed with a 97% response rate in
4,916 women aged 15 to 49
3.2 Study variables
The setting for this study is restricted to women of child bearing ages ranging from 14 to
49 years. In the DHS data, up to 4551 women were interviewed among whom we excluded
n=315 pregnant women. The studied population was then divided in two categories. The first
category comprises 2023 women living in urban areas while the second category comprises 2528
women from rural areas. Independent variables as well as dependent variable are analyzed
accordingly.
Socio-demographic variables include age, level of education, ethnic group, marital status, wealth
index, job, religion, and residence place. Diet is assessed by daily fruit, vegetable and fluid
28 a. List of independent variables
Socio-demographic variables that were used in this study include age, type of residence, level of
education, ethnic groups, wealth index, marital status, physical activity and fruits and vegetables
consumption. For the variable age, women were grouped into 5 years age-category groups. Of
the 4236 women that were eligible for this study, their mean age ranged from 15 to 49 years. The
type of residence was classified as urban or rural. Education level is categorized into four
different groups including no education which is the lowest level to the highest level. Four
subjects had no values on education. The variable ethnic group was recoded in two different
groups. The first group comprises the most important ethnic group, the Akan, and the second
group was a combination of other smaller ethnic groups. Wealth index is consists of five
categories: poorest, poorer, middle, richer and then the richest. Marital status included was
composed of six different groups : never been married, married, living together, widowed,
divorced or not living together. The variable was recoded into four groups. The first groups
composed of unmarried women which was a combination of never married and not living
together. The second was a combination of widowed and divorced. The third group combining
married women and those living with a partner. For variables entitle number of days eating
fruits in a typical week, eating vegetables in a typical week and vigorous physical activity during
a typical week all respondents who answered ‘’do not know ‘’ were added to the groups ‘’none’’
which are the groups who do not consume any fruit or any vegetable or do not exercise at all.
Then variables were categorized into three categories: those who do not eat any fruit or
vegetables at all, those who eat fruit and vegetables less than five days a week and those who eat
more. The variable physical activity was recoded into two categories: women who had vigorous
29 b. Dependent variables
The two main dependent variables for this study were expressed as: overweight and
obesity defined as BMI of 18-24.99 kg.m2, 25.00-29.99 kg.m2and 30 kg.m2and greater,
respectively (CDC, 2008).
3.3 Statistical Analysis
All statistical analyses that were conducted for this study were done using SPSS 18.0.
Tables and figures were created also created using SPSS 18.0.
Characteristics of study population were evaluated using demographic variables (age, education
level, wealth index, marital status). Behavioral factors (physical activity, diet habit).
Anthropometric measurements such as BMI were also computed to determine normal,
overweight and obese women. Analysis was stratified according to ethnic group, and
socio-economic status. Differences between continuous variables were tested at p<.05 level. Group
ethnic stratification was computed (Akan and others).
Chi-square statistics were performed to describe the absolute values, the distribution of
categorical variables and to determine any significant relationship between the variables across
the two type of place of residence urban versus rural. P-values for Chi-square tests were reported
for each categorical variable in the data set.
Odds ratio from binary logistic regression analyses was used to determine the association
between independent and dependent variables. Appropriate 95% confidence intervals and p < .05
were used to determine statistical significance.
Finally, the stepwise multiple logistic regression forward LR was used to determine the
most important predictors of outcome variables. Some of the variables were recoded to fit the
model. They include fruit, vegetable, religion, marital status, and physical activity, ethnic. Other
30 age categories. The ultimate goal of this analysis is to create a parsimonious model with the best
predictors of adiposity (overweight or obese) by eliminating insignificant predictors for both
urban and rural areas. A significant association is assumed for a given p-value less than or equal
31 CHAPTER 4:
RESULTS
Basic Characteristics of Eligible Women: Table 1
Table 1 shows the distribution of the dependent and independent variables stratified by residence
(urban versus rural). Overall, the distribution of the population by age, ethnicity, working status,
marital status, education, wealth index, religion, physical activity and diet vary according to
urban- rural settings. Overall, 4551 women were eligible for this study; the majority of them
(55.5%) lived in rural areas. In both urban and rural areas women aged between 14 and 19
accounted for more eligible women. The mean age of women living in rural areas was slightly
higher (29.43 SD±10.07) than that of those in urban areas (28.64 SD±9.06). Akan was the most
dominant ethnic group in urban as well as rural areas. There was a positive statistically
significant difference between urban and rural women with respect to the distribution of
adiposity defined by overweight (p< .001) with women in urban areas having higher levels of
adiposity.
Age Distribution of Overweight and Obese Women by Residence: table 2
Table 2 shows age distribution of overweight and obese women stratified by residence (urban
versus rural). As shown, distribution overweight women increased with age, from 15 to 29 years
in both women living in urban and rural areas. However, more overweight women were
represented in urban setting compared with rural settings (p=.018). Obesity was more prevalent
in the 40-44 year old groups with values of 18.3% and 26.7% for urban and rural women,
respectively. However, unlike overweight, there is no statistically significant in the distribution
32 Distribution of Overweight and Obese Women by Educational Level: table 3
Table 3 compares the distribution of overweight and obese women with respect to education
level stratified by residence (urban versus rural). There was a statistically significant difference
between urban and rural residences with respect to the distribution of overweight (p<.001). As
shown, distribution of overweight increased with higher educational level in both urban and rural
areas. However, overweight was more common in women living in urban areas (80%) compared
to rural areas (48.7%). The distribution of obesity by education status was similar to overweight
distribution. The distribution of obesity was higher in women living in urban areas (63.4%)
compare to rural (49.4 %) in subjects with secondary education level. Overall, there is a
statistically significant difference between urban and rural residences with respect of the
distribution of obesity (p<.001).
Distribution of Overweight and Obese Women by Current Marital status: table 4
Table 4 shows the distribution of overweight and obesity by marital status stratified by place of
residence. As shown, the distribution of overweight and obesity varied by marital status. Among
overweight women, there were more married women in rural (70.6%) compared to urban (58.9)
settings. A similar pattern of distribution was also observed for obese women, with married
women accounting for 67.7% for rural women compared with 83.3% for rural women.
Distribution of Overweight and Obese women by Religion: table 5
Table 5 shows the distribution of overweight and obese subjects with respect to religion status as
stratified by place of residence. Overall, there were statistically significant differences in the
distribution of religious status of overweight and obese women with respect to residence. As
33 to other religious. Also, the distribution of overweight in Moslim subjects was higher in urban
(17.8%) compared to rural areas (10.5%). In general, the distribution of overweight with respect
to religion varies between urban and rural settings and the difference is statistically significant (p
< .001). Overall, there was a statistically significant difference between urban and rural settings
with respect to obesity (p =.002). The distribution of obese in Christian subjects was higher in
rural (86.7%) compare to urban (80.3%) settings.
Distribution of Overweight and Obese women by Ethnicity: table 6
Table 6 shows the distribution of overweight with respect to ethnicity stratified by the place of
residence. Overall, there was a statistically significant difference in the distribution of
overweight between women living in urban areas compare to those in rural (p=.014). Compared
to other ethnic groups, Akans presented with more overweight subjects in both rural and urban
settings. Although the distribution of obese subjects with respect to ethnicity tended to be
similar to overweight, the distribution by residence was not statistically significant.
Distribution of Overweight and Obese women by Work Status: table 7
The distribution of overweight and obese subjects with respect to working status stratified by the
place of residence is shown in Table 7. As shown in the table the distribution of overweight is
more important in the working force. However, the distribution of overweight was slightly
higher in women living in rural areas, about 90.6% of the population, compare to 80.4% of
women in urban areas. Overall, there is a statistically significant difference in the distribution of
34 distribution of obesity was slightly higher in women living in rural areas, about 92.2% of the
population, compare to urban 85.9%. However, there was no statistically significant difference in
the distribution of obesity between urban and rural areas with respect of working status (p=.097).
Distribution of Overweight and Obese women by Wealth index: table 8
Table 8 shows the distribution of overweight and obese subjects with respect to wealth index
stratified by the place of residence. As shown, overall, there is a positive statistically significant
difference in the distribution of overweight and obese subjects according to wealth index
between urban and rural areas (P<0.001). Wealthy women in urban areas are more likely to be
35 Distribution of Overweight and obese women by Number of days eating fruits during a typical
week: table 9
Table 9 shows the distribution of overweight and obese subjects with respect to the number of
days of eating fruit during a typical week stratified by the place of residence (urban versus rural).
Overall, the distribution of overweight and obesity did not differ with respect to the number of
days of eating fruits during a typical week (P >.05).
Distribution of Overweight and obese women by Number of days eating vegetables during a typical week: table 10
As shown in Table 10, the distribution of overweight and obesity with respect of the number of
days vegetables were consumed during a typical week stratified by the place of residence (urban
versus rural). Overall, the distribution of overweight and obesity did not vary by residence
(P >.05).
Distribution of Overweight and obese women by Vigorous physical activity Status: table 11
Table 11 shows the distribution of overweight and obese women with respect to vigorous
physical activity during a typical week stratified by the place of residence. In general, the
distribution of overweight was more common among women who exercise less than 5days per
week compare to the rest of the population. However, the distribution of overweight was higher
in women who exercise more than five days per week in rural areas (36.2 %) compare to urban
(32.8 %). Overall, there is a statistically significant difference in the distribution of overweight
with respect to vigorous physical activity (P< .001). A similar finding was observed in obese
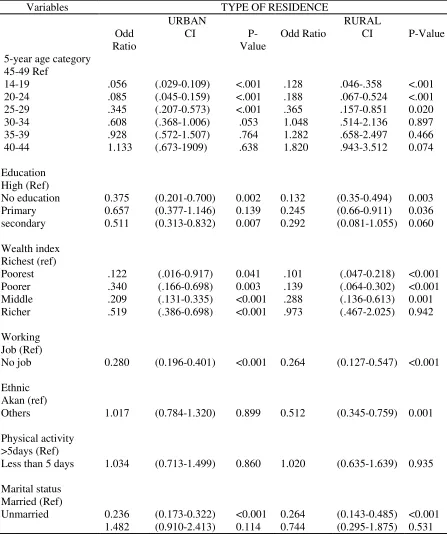
36 Association between Selected Independent Variables with Overweight
Univariate Models: tables 12&13
The results of residence-specific univariate logistic regression analyses of the association
between selected independent variables with overweight are shown in Table 12 and Table 13.
Among rural and urban resident women, increased age, higher education, higher wealth, lack of
job was each associated with decreased odds of overweight. Compared to Akan women, being of
other ethnic group was also associated with decreased odds of overweight in women of urban
and rural settings. As shown in Table 13, lack of fruits consumption and Muslim religion was
each associated with decreased odds of overweight in women who live in rural settings.
Consumption of less than 5 fruits in a day was also associated with decreased odds of overweight
in urban resident women.
Stepwise Models: table14
Stepwise logistic regression method was used to determine the best variables that are associated
with overweight (Table 14). For urban and rural resident women, wealth index and age were the
best predictors for overweight. As shown, and similar to the results from the univariate analyses,
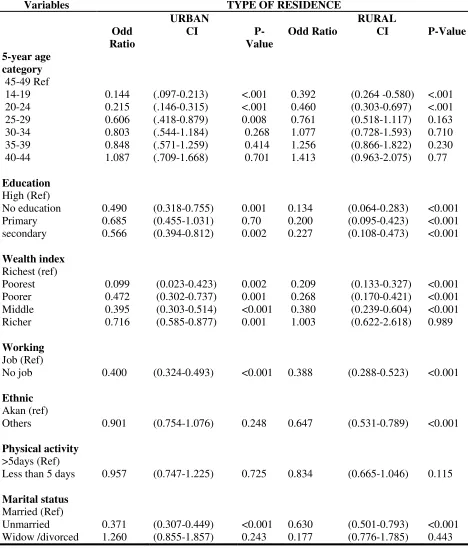
37 Association between Selected Independent Variables with Obesity
Univariate Models: tables 15&16
As shown in Table 15 and Table 16, older age, higher education, higher weight index, lack of
jobs and being other than Akan ethnicity was each associated with increased odds of obesity in
urban and rural settings. Similar to the result from overweight, engaging in less than 5 days a
week physical activity was not significantly associated with obesity in urban and rural settings.
Compared to married women, being unmarried was associated with decreased odds of obesity in
urban and rural women. Analyses of effect of religion, fruits and vegetable consumptions (Table
16) indicate that compared with Christians, being of Muslim religion was associated with
decreased odds of obesity, ‘’Consumption of less than 5 fruits a day’’ was also associated with
decreased odds of obesity in rural women. Consumption of vegetables was not significantly
associated with obesity in both urban and rural women.
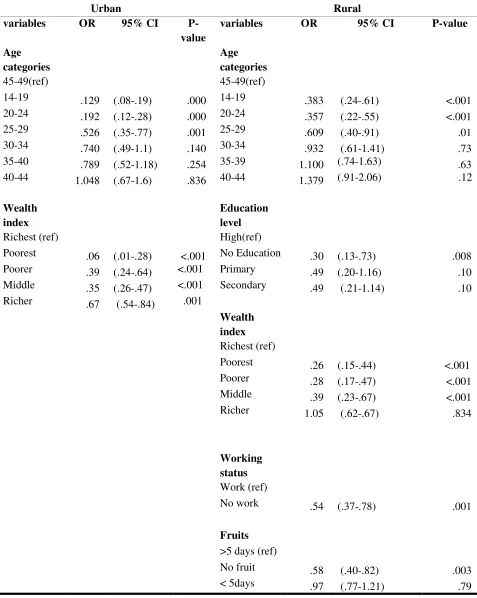
Stepwise Models: table 17
As shown in Table 17, age and weight index were the best predictors of obesity in urban women.
There was a trend of increasing odds of obesity with older age for urban women, increasing
from .129 for women in the 15-19 year old group to 1.048 for women who were 40-44 years of
age. A similar trend of increasing odds of obesity was also apparent for increasing wealth index
for urban women. For rural women, increased age, education wealth index, having a job and fruit
consumptions were the best predictors of obesity. As with urban women, a linear trend in age,
and wealth index were associated with decreased odds of obesity. A similar increased trend in
odds of obesity was also observed for increased education, ranging from odds ratio of .30 for no
education to .49 for having secondary education. Lack of job, and not consuming fruits were also
38 CHAPTER 5:
DISCUSSION AND CONCLUSION
5.1 Discussion
The main objective of this study was to use cross-sectional data from the DHS to
document factors associated with adiposity (overweight and obesity) in Ghanaian childbearing
women comparing urban to rural settings. The study explored adiposity’s association with
socio-demographic development, urbanization, socio-cultural beliefs.
The results of the study demonstrate that there is a difference in the prevalence of
overweight and obese between urban and rural areas (figure 3). Women in urban areas have a
higher prevalence of adiposity than those in rural areas. The study is consistent with previous
studies in developing countries especially in Morocco (Belahsen, 2003), sub-Sahara Africa
(Garett, 2005), Benin (Sodjinou, 2008) and also in Ghana (Amoah, spring 2003). Another study
on 430 women in the Capital City Accra indicates even a higher prevalence of obese: 34.8
percent and overweight 27.4 percent compare to this study. All those results suggest negative
effects of urbanization on populations especially women. A plausible explanation to all these
results would be possibly understood by higher energy expenditure in rural women compare to
urban. Ghanaian populations, unlike other populations in West Africa, are traditionally farmers
(Oniang, 2003). In rural areas, since they are generally households’ food providers, women tend
to work harder in their farms compared to women in urban areas. The study also suggests
environmental contributors to adiposity in urban areas as hypothesized by James Hill’s study
(1998) and also the study of Ziraba (2009). They labeled adiposity contributors advances in
technology and transportation that reduce the need for daily physical activity in urban settings.
The theory of obesogenic environment is defended by Hill, suggesting food availability and
39 opportunities for the consumption of large quantities of food (2008). These findings call for
educational programs at community and individual level as well as regulations on food markets.
The overall findings in this study that adiposity increases with age is consistent with the
work of Albert Amoah in urban and rural Accra (Jun 2003). Amoah demonstrated that obesity
increased with age up to 64 years. Other studies in China found that 4.3 % of women 20-45 had
BMIs ≥ 27.3 kg.m-2 and 13.1% had BMIs >25kg.m-2. The same studies conducted in 1992
Mauritius and in sub-Africa found an obesity prevalence of 15.1% in women aged 24-74years
(Marotell, 2000). A potential reason for that could be more sedentary life in adults compare to
young persons.
In this study also, high levels of adiposity are concentrated among urban and high
educated women. Results consistent with the study of Marotell (2000) on socio-demographic
factors associated with obesity in women in developing countries and also with a previous
epidemiologic study on obesity in Ghana (Birtwum, 2005).
Another finding is the association between adiposity and high socio economic status in
urban areas. The result is consistent with two other studies (Amoah, Jun 2003; Marotell, 2005 &
Ziriba, 2009). However, they point out an important difference between developing countries
and industrialized. While in developed countries low socioeconomic status and poor
neighborhoods have been associated with a higher prevalence of obesity and chronic diseases
(Lopez, 2007); in developing countries, namely in Africa, studies have demonstrated by contrast,
a strong positive relationship between obesity and high socio-economic status (Christensen,
2008; Fezeu, 2006; Kuga,2002; Ziriba, 2009).
Marital status in this study like in previous (Amoah, Jun 2003; Birtwum, 2005 & Duba,
2007) was also associated with high levels of adiposity and also with urban place of residence.
Albert Amoah in a study in Ghana explains the phenomenon by social pressures that associate
40 men are known to prefer overweight and obese women to thin ones and this may conceivably
contribute to the higher rates of overnutrition among females (Jun 2003). Amoah emphases that
‘’It is not surprising that some women are now going out of their way to put on weight in order
to appear beautiful and or prosperous’’ (p 755). This socio-cultural belief is also demonstrated in
the current study by the prevalence of adiposity that appear among populations from higher
socio-economic status.
On education level the current study is also consistent with Amoah. In the current study
urban women labeled as high educated had significantly higher prevalence of Obesity (9.3 %)
than no educated (9%). Amoah results were slightly higher than this study (less literate and
illiterate subject: 12.5-13.8 % compare to highest 18%). However, the prevalence of overweight
in this study was greater in no educated urban subjects (11.4%) than in high educated (7%).
These results strongly suggest a need for socio- educational programs, at a community level; on
adiposity as a risk factor for chronic diseases.
On physical activity, this study found a significantly higher prevalence of overweight
among women with less physical activity which is consistent with current scientific knowledge
on the side effects of a sedentary lifestyle (Dietz, 1996; WHO, 2003). However surprisingly, the
prevalence of overweight among rural women is significantly higher than rural in the current
study. These results could reveal a higher influence of peers’ pressure, related to beauty, in rural
women compare to urban. The same significantly higher prevalence in rural areas compare to
urban is showed with religion. This result suggests more studies in order to better understand the
impact of religion on women in rural areas and its influence on adiposity.
The multiple stepwise logistic regression after adjustment for other independent variables
has found a strong positive association between age, wealth index and adiposity (both
overweight and obesity) in urban as well as rural. However, in rural areas education, working
41 be conducted to address customs and cultural belief and also promote consumption of more fruits
42 5.2Study limitations
This study has several limitations: First, the survey questionnaire type may include bias
in the answer to several questions. As an example the question on physical activity is not really
clear mainly in rural areas. A lot of respondent answered no to the question. However, knowing
that they are farmers, an appropriate question would be on work done at the farm in order to
evaluate physical level or intensity. Physical inactivity in this study appears to be not
significantly related to adiposity.
Second, the questionnaire on daily diet does not reflect WHO recommendations making
it difficult to validate respondents’ answers. For the population to consider their diet as healthy
they must consume at least 5 servings of fruits and vegetables. The survey emphasized whether
or not women eat fruits or vegetables. A respondent may answer yes and still be overweight or
obese because of an insufficient number of servings of fruits and vegetables.
Another limitation is the use of secondary data, which has limited the investigators to the
variables collected by the survey. The variable ‘’television’’ or ‘’transportation ‘’might have
been of interest to evaluate sedentary lifestyle.
This study was limited to a comparison between in urban and rural non-pregnant women
populations. Some associations have not been analyzed such as relation between weight gain and
43 5.3 Recommendations
The results of this study showed that the prevalence of adiposity was higher among adults
women, educated and mainly those living in urban areas compare to rural. More research is
needed to better understand the discrepancies between rural and urban Ghanaian place of
residence. The Demographic Health Survey is one of the most studies used in developing
countries like Ghana; other organizations and researchers should test the reliability of such
survey by using wider range of items to create a more valid questionnaire on diet and physical
activity.
The increasing prevalence of overweight and obesity in developing countries like Ghana
also calls for policies and public health interventions promoting healthy lifestyle that may be
beneficial to populations already under the burden of infectious diseases.
5.4 Conclusion
Despite the limitations of the study, the results are significant enough to provide insight
into the increasing prevalence of obesity in Ghana. To control the spread of the epidemic, it is
crucial to address cultural believes and educate populations in the developing world on adiposity
as a risk factor for chronic disease. As a result populations like Africans’ namely Ghanaian
would be less likely to praise overnutrition and overweight as criteria for beauty and therefore be
44 REFERENCES
Armelagos. G. J., Brown, P. J., Turner, B. (2005). Evolutionary, historical and political
economic perspectives on health and disease. Social Science & Medicine 61 (2005) 755– 765.
Ashton, W.D., Nanchahal, K., and Wood, D.A.(2001). Body mass index and metabolic risk factors for coronary heart disease in women. European Heart Journal. 22, 46-55.
Australian Bureau of Statistics. http://www.aph.gov.au/library/intguide/sp/obesity.htm.
Comments to: [email protected]. Last reviewed 14 June, 2007 by the Parliamentary Library Web Manager © Commonwealth of Australia. Retrieved on 06/26/2010.
Amoah, A. GB. (Spring 2003). Obesity in Adult Residents of Accra, Ghana. Ethnicity &Disease. (13): S2-97
Amoah, A.GB. (Jun, 2003). Sociodemographic variations in obesity among Ghanian adults.Public Health Nutrition: 6(8), 751-757.
Belahsen, R., Mziwira, M., & Fertat, F. (2003). Anthropometry of women of childbearing age in Morocco: body composition and prevalence of overweight and obesity. Public Health Nutrition: 7(4), 523–530.
Birtwum, R.B., Gyaong, J., & Mensah, G. (2005). The epidemiology of Obesity in Ghana. Ghana Medical Journal(30)3: 82-85.
Bosetti, C., Malvezzi, M., Chatenoud, L., Levi, F., Negri, E., La Vecchia, C. (2005). Trends in cancer mortality in the Americas: 1970–2000. Annuals of Oncology. 16(3):489–511.
Boutayeb, A.(2006). The double burden of communicable and non-communicable diseases in developing Countries. Transactions of the Royal Society of Tropical Medicine and Hygiene 100, 191-199.
Bray, G.A. (1996). Health hazards of obesity. Endocrinology and metabolism clinics of North America :( 25) 4: 907-919.
Bray, G.A. and Popkin, B.M. (1998). Dietary fat does affect obesity! American Journal of Clinical Nutrition; 68:1157–1173.
45 CDC. U.S. Obesity Trends/Trends by State 1985–2008
http://www.cdc.gov/obesity/childhood/index.html http://www.cdc.gov/obesity/stateprograms/index.html retrieved on the 06/26/2010 at 10:15am
Cohen, B. (2004): Urban growth in developing countries: A review of current trends and a caution regarding existing forecast. World Development. 32:23-51.
Christensen, DL., Eis, J., Hansen, AW., Larson, MW., Mwaniki, DL., Kilonzo, B., Tetens, I., Boit, MK., & Al. (2008). Obesity and regional fat distribution in Kenya populations: impact of ethnicity and urbanization. Annual Human Biology 35(2): 232-249.
Dietz, W. H. (1996). The role of lifestyle in health: the epidemiology and consequences of inactivity. Proceedings of the Nutrition Society. ( 55) 829-840.
Duda, R. B., Darko, R., Seffah, J., Adanu, R. MK., Anarfi, J., & Hill, A. (2007). Prevalence of obesity in women of Accra, Ghana. African Journal of Health Sciences 14(3-4):154-149.
Fezeu, L., Minkoulou, E., Balkau, B., Kengne, AP., Awah, P., Unwin, N., Alberti, GK., Mbanya, JC. (2006). Association between socio-economic status and adiposity in urban Cameroun. International Journal of Epidemiology 35(1):105-111.
Foster, JL., Jeffery, RW., Schmid, TL., Kramer, FM. (1988). Preventing weight gain in adults: a pound of prevention. Health Psychology, 7(6):515-525.
Garrett, J. & Ruel, MT. (2005). The coexistence of child undernutrition and maternal
overweight: prevalence, hypotheses, and programme and policy implications. Maternal and child Nutrition, 1: 185-196.
Garrow, JS. Obesity and related diseases. (1988) London, Churchill Livingstone 1 -16
Hidalgo, LA., Chedraui, P.A., Morocho, N., Alvarado, M., Chavez, D., & Huc, A. (2006) The metabolic syndrome among postmenopausal women in Ecuador. Gynecol Endocrinol. 22(8):447–454.
Hill, J. O. & Peters, J.C. (1998). Environmental contributions to the Obesity Epidemic. Science (280):1371-1374.
Hill, J.O., Peters, J.C. Catenacci, V. A., & Wyatt, H.R. (2008). International Strategies to address obesity. The International Association for the Study of Obesity. Obesity reviews 9 (suppl.1), 41-47.
James WPT. (1992). Epidemiology of obesity. International Journal of Obesity; 16 (suppl. ):S23-6.
46 Kamadjeu, R. M., Edwards, R., Atanga, J.S., Kiawi, E.C., Unwin, N. & Mbanya, JC. (2006).
Anthropometry measures and prevalence of obesity in the urban adult population of Cameroon: an update from the Cameroon Burden of Diabetes Baseline Survey. Public Health. 6:228
Kromhout, D., Bloemberg, B., Seidell, JC., Nissinen, A. & Menotti, A.(2001).Physical activity and dietary fiber determine population body fat levels: the Seven Countries Study. International
Journal of Obesity; 25: 301-306.
Kuga, S., Njelekela, M., Noguchi, T., Kanda, T., Yamori, M., Sato, T., Miki, T., Ikeda, K. & Al. (2002). Prevalence of overweight and hypertension in Tanzania: special emphasis on resting energy expenditure and leptin. Clinical Experimental Pharmacology and Physiological Supplements,S23-26.
Lopez, R.P. (2007). Neighborhood risk factors for obesity. Obesity,15(8):2111-2119.
Mathe ,S., Matovu, HL., Mossop, RT. (1985): Nutritional status of an urban community in Zimbabwe. Central African Journal Medical. 31(3):59-62.
Martorell, R., Kettel Khan, L., Hughes M.L., & Grummer-Strawn, L.M. (2000) Obesity in
women from developing countries. European Journal of Clinical Nutrition ; 54: 247-252.
Menotti, A., Lanti, M., Puddu, P.E., Kromhout, D. (2000). Coronary heart disease incidence in northern and southern European populations: a reanalysis of the seven countries study for a European coronary risk chart. Heart 2000; 84: 238–244.
Moore, J. (2003). Healthy Active Oregon.
http://www.dhs.state.or.us/publichealth/hpcdp/about.cfm#why . Retrieved 06/26/2010 at 10:00 pm
Njelekela, M., Sato, T., Nara, Y., Miki, T., Kuga, S., Noguchi, T., Kanda, T.,Yamori, M., Ntogwisangu, J., Masesa, Z., & al (2003): Nutritional variation and cardiovascular risk factors in Tanzania--rural-urban difference. South African Medical Journal. 93(4):295-299.
Oniang, R.K., Mutuku, J. M., Malaba, S. J. (2003). Contemporary food habits and their nutritional and health implications. Asia Pacific Journal Clinical Nutrition 12(3): 231-236.
Popkin, B. M. (2001).Symposium: Obesity in developing countries: Biological and ecological factors. The Journal of Nutrition; 131, 3; Research Library. pg. S871.
Popkin, B. M. and Gordon-Larsen, P. (2004). The nutrition transition: worldwide obesity dynamics and their determinants. International Journal of Obesity 28, S2–S9.
Prentice, A. M. (2006). The emerging epidemic of obesity in developing countries. International Journal of Epidemiology; 35:93-99.