R E S E A R C H A R T I C L E
Open Access
Examination of the relationship between essential
genes in PPI network and hub proteins in reverse
nearest neighbor topology
Kang Ning
1, Hoong Kee Ng
3, Sriganesh Srihari
3, Hon Wai Leong
3, Alexey I Nesvizhskii
1,2*Abstract
Background:In many protein-protein interaction (PPI) networks, densely connected hub proteins are more likely to be essential proteins. This is referred to as the“centrality-lethality rule”, which indicates that the topological placement of a protein in PPI network is connected with its biological essentiality. Though such connections are observed in many PPI networks, the underlying topological properties for these connections are not yet clearly understood. Some suggested putative connections are the involvement of essential proteins in the maintenance of overall network connections, or that they play a role in essential protein clusters. In this work, we have attempted to examine the placement of essential proteins and the network topology from a different perspective by determining the correlation of protein essentiality and reverse nearest neighbor topology (RNN).
Results:The RNN topology is a weighted directed graph derived from PPI network, and it is a natural
representation of the topological dependences between proteins within the PPI network. Similar to the original PPI network, we have observed that essential proteins tend to be hub proteins in RNN topology. Additionally, essential genes are enriched in clusters containing many hub proteins in RNN topology (RNN protein clusters). Based on these two properties of essential genes in RNN topology, we have proposed a new measure; theRNN cluster centrality. Results from a variety of PPI networks demonstrate thatRNN cluster centralityoutperforms other centrality measures with regard to the proportion of selected proteins that are essential proteins. We also investigated the biological importance of RNN clusters.
Conclusions:This study reveals thatRNN cluster centralityprovides the best correlation of protein essentiality and placement of proteins in PPI network. Additionally, merged RNN clusters were found to be topologically important in that essential proteins are significantly enriched in RNN clusters, and biologically important because they play an important role in many Gene Ontology (GO) processes.
Background
Essential genes may cause the death of an organism if they are not properly expressed or malfunction due to events such as sequence mutation. Essential genes are vital for the growth of an organism under a variety of conditions and are frequently identified experimentally through deletion experiments (by the analysis of haploid deletion mutant strain growth rates)[1-3].
Recent high-throughput proteomic experiments, such as yeast-two hybrid [4] and affinity capture-MS [5,6],
have enabled the systematic mapping of protein-protein interaction (PPI) for organisms such asSaccharomyces cerevisiae[4-6] and Escherichia coli[7]. Though the PPI networks constructed from these experiments are not yet complete, they nonetheless have revealed interesting topological properties of PPI networks [8,9] with respect to gene essentiality.
Specifically, several studies have already investigated the connection of the topological properties of PPI net-works and essential genes [10-13]. The PPI network is represented as an unweighted, undirected graph, in which each node represents a protein and each edge (between two nodes) represents an interaction between these two proteins. In many PPI networks, essentiality is * Correspondence: nesvi@umich.edu
1
Department of Pathology, University of Michigan, 4237 Medical Science Building I, Ann Arbor, MI, 48109, USA
Full list of author information is available at the end of the article
correlated with topological placement of the proteins in the network. That is, hubs that are “highly connected” in a PPI network tend to correspond to essential genes [10-17]. This is called the“centrality-lethality rule”[10]. Though the centrality-lethality rule has been observed in many PPI networks, the underlying topological prop-erties of essential proteins are not yet fully understood. Jeong and colleagues argued that essential proteins are important in PPI network for maintaining the overall network connectivity, [10], while He and colleagues sug-gested that the majority of essential proteins are corre-lated with essential protein-protein interactions [11] in the PPI network. A recent study by Zotenko and collea-gues utilizing a yeast PPI network, however, rejected these two suggestions, and proposed that proteins are essential due to their involvement in densely connected clusters of proteins with same GO term annotation [12]. Other works have shown high correlations between pro-tein essentiality and their placement in propro-tein com-plexes [18-20].
RNN topology was a weighted directed graph that could be generated from PPI network. In RNN topology, each of the nodes represented a protein, and each edge pointed to a protein from its RNN (with that protein as it nearest neighbor) [21,22]. RNN topology is different from nearest neighbor (NN) topology, since for each protein, its NN proteins and RNN proteins comprised two different protein sets. Since edges in RNN topology are both weighted and directed, they are useful for the identification of hub proteins that are important to the entire network. As with other topology modeling appli-cations, the RNN topology can elucidate the topological, but not necessarily the true biological, dependencies between proteins. Nevertheless, there is an intricate cor-relation between topological dependencies and biological dependencies in PPI networks, as discussed in [10]. Therefore, the investigation of correlations between hub proteins in RNN topology and their essentiality could provide additional interesting insights such as whether these hub proteins play an important role in GO processes.
In this study, we explored the connection between topological properties of proteins and essential genes from a different perspective. Namely, we generated reverse nearest neighbor (RNN) topology [21,22] from the PPI network, and subsequently examined the con-nection of essential proteins and their placement in RNN topology, as well as the topological context in which essential proteins were enriched in RNN topology using different types of PPI networks. Our results show that essential proteins are more likely to be proteins with many RNNs. Additionally, essential proteins are enriched in clusters (RNN clusters) of proteins in RNN topology (referred to as the “clustering property” of
essential proteins). Based on these observations, we pro-pose theRNN cluster centrality measure, which is super-ior to other centrality measures in correlating hub proteins and essential proteins. Furthermore, we have observed that the RNN clusters play an important role in many GO processes.
Methods Experimental data
The computational analysis was performed using PPI networks from two organisms,E. ColiK12 and budding yeast. For E. Coli, “DIP core” protein-protein interac-tions were retrieved from the DIP database [23] (http:// dip.doe-mbi.ucla.edu/dip, accessed on 01/26/2009). The “DIP core” network was derived from “DIP full”, with evolutionary information used to filter out unreliable interactions. Essential genes used in this study were identified based on a genome-wide targeted mutagenesis project [1] (http://ecogene.org, accessed on 07/01/2009).
The“DIP core”network for yeast was also obtained as described above. Several additional yeast PPI networks from different experiments were retrieved from Bio-GRID [24] (http://www.thebiogrid.org, version 2.0.52). These networks included two PPI networks generated by affinity capture-MS experiments: Krogan et al. [5] and Gavin et al. networks [25]; Collins et al. network [26], generated by the application of a statistical scoring scheme and filtering of low confidence score interac-tions from Krogan and Gavin’s networks; and high con-fidence network (HC network) [27], which was generated by the intersection of small-scale datasets (including affinity capture-MS, yeast two-hybrid, etc.) with high throughput datasets [28]. The list of essential genes for yeast was obtained from Saccharomyces Gen-ome Deletion Project [2,3] (http://www-sequence.stan-ford.edu/group/yeast_deletion_project/deletions3.html, accessed on 07/01/2009).
Known protein complexes were also used for compari-son. The list of protein complexes was retrieved from a recent study of protein complexes in yeast [18] (http:// dags.stanford.edu/Complex/reference.txt, accessed on 09/14/2009.)
Methodologies of data analysis RNN topology generation
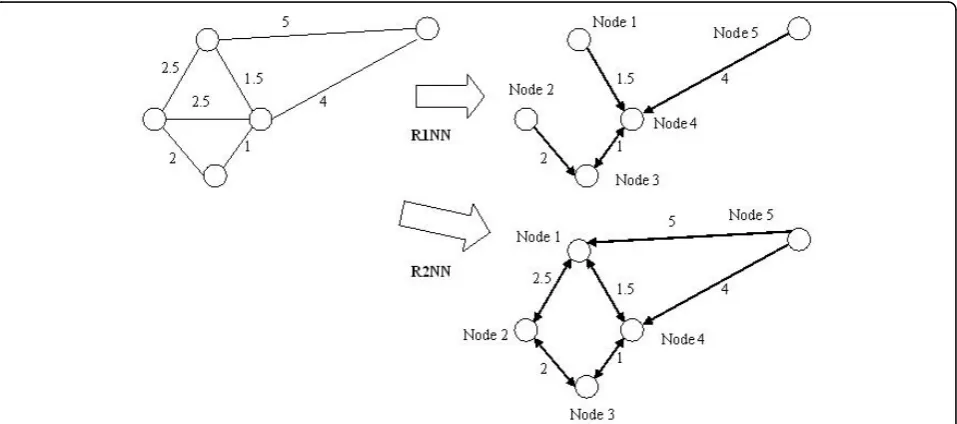
RNN topology was generated from the original PPI network as follows. As the first step, the CMC algorithm [29] was applied to compute edge weights in the PPI network based on the connectivity of proteins in the PPI network. We have then transformed every edge weight in this weighted graph so that the closer the two proteins in RNN topology, the lower edge weight in the RNN topology. By this means, the more reliable the interaction, the closer the interaction in the RNN topol-ogy. Therefore, low edge weight in RNN topology after transformation actually indicates reliable interaction. Then RNN topology was generated based on this weighted PPI network by an efficient metric space search scheme [22] that identified the RNNs for every protein in the weighted PPI network. For each protein in RNN topology, other proteins with this protein among their topknearest neighbors were referred to as the RkNN of this protein. The RkNN topology consisted of all proteins and the edges to every protein from their RkNNs. The generation of RNN topologies on a toy weighted PPI network is shown in Figure 1. For exam-ple, in Figure 1, Node 2 has no R1NN, and its R2NNs are Node 1 and Node 3. Note that some interactions in PPI network may not be present in RNN topology, since they represent weak dependencies of RNNs to the corre-sponding protein. It was found that there were special properties for RkNN with differentk: Given any protein
q, R1NN(q) is a subset of R2NN(q), R2NN(q) is a subset of R3NN(q), and so on. Ifk≥n-1(where n is the num-ber of all proteins in the PPI network), then RkNN includes every interaction in the original PPI network.
In real applications, it is of interest to analyze RkNN primarily for smallkvalues.
RNN cluster generation
Based on RNN topology, we analyzed two types of clus-ters; simple and merged clusters. To generate simple clusters, all proteins in RNN topology were ranked by the number of their RNNs. The clusters were then gen-erated by iteration. In each iteration, both the top-rank-ing protein and its RNNs (which were still present in the ranked list) formed a simple cluster, and all of these proteins were removed from the ranked list. This pro-cess was continued until there was no remaining protein in the ranked list.
For a clusterIin RNN topology, the RNN cluster con-nectivity(I), was defined as the ratio of the number of RNN edges from proteins outside of RNN cluster to proteins inside the cluster, divided by the total number of edges pointing to proteins in this RNN cluster. The
[image:3.595.60.539.480.692.2]RNN cluster connectivitymeasure indicated the topologi-cal importance of RNN clusters (see RESULTS for dis-cussion). Higher RNN cluster connectivity indicates higher connectivity of corresponding RNN cluster in the whole RNN topology. Therefore, theRNN cluster con-nectivity indicates connectivity of RNN clusters at the level of clusters of proteins rather than individual pro-teins. Using the RNN cluster connectivity measure, merged RNN clusters were then created by iteratively merging simple clusters and previously merged clusters. In each iteration, two simple (or merged) RNN clusters with the highestRNN cluster connectivitywere merged if the resulting merged RNN cluster had aRNN cluster
connectivity greater than a certain threshold. In this study, the threshold was set to be 0.5 for the balance between the quality and the number of merged clusters. This process was continued until there were no remain-ing proteins (clusters) that could be merged. All RNN clusters withRNN cluster connectivity smaller than 0.5 were subsequently filtered out.
Centrality measures for proteins
In this work, hub proteins were defined as proteins with high centrality values. Here, we introduce several cen-trality measures that are based either on RNN topology or the original PPI network. First, suppose the number of RNNs for each of the protein iis RNN(i). The RNN
centrality for a protein i is defined as the number of
RNNs for this protein.
RNN centrality (i)=RNN (i) (1)
RNN centrality may be important for distinguishing
essential and non-essential proteins. Note that thisRNN centralityis also dependent on the types of RkNN used. For the same protein, when kvalue increases, theRNN centralityvalue also increases.
Second, we defineRNN cluster centrality, which takes into consideration bothRNN centralityand the enrich-ment of essential proteins in RNN clusters (clustering property). The enrichment of essential proteins in RNN clusters is represented by the RNN cluster connectivity
measure described above. TheRNN cluster centralityfor each proteiniin RNN clusterIis defined as
RNN cluster centrality (i)=RNN (i) RNN cluster connectivit∗ yy(I)|(i∈I) (2)
For clustering methods other than RNN clustering, the clustering centralities are defined in a similar way. Suppose the number of interactions for protein i is degree(i) in the PPI network. Thecluster connectivity(I) for cluster I is thus defined as the ratio of the number of interactions between one protein inside and another outside of this cluster, divided by the total number of interactions connecting proteins in the cluster. The clus-tering centralityis defined as:
Clustering centrality (i)=degree(i) cluster connectivity(I∗ ))|(i∈I) (3)
Measures for comparison
To compare the performance of different centrality mea-sures in terms of their ability to identify essential pro-teins, two metrics are used. One metric is the “proportion of essential proteins in selected proteins” (Precision):
Precision=#essential proteins selected/ #proteins selected (4)
The proteins are selected by their centrality measures (formula (1)-(3)). “# Essential proteins selected” is the
number of proteins in the selected set of proteins. Note that the precisionvalue is directly related to the central-ity-lethality rule: the higher the proportion, the better the discrimination between essential and non-essential proteins provided by the centrality measure.
Another measure is the“proportion of essential pro-teins selected”,Recall, which is the number of essential proteins selected in proportion to the total number of essential proteins in the dataset.
Recall=#essential proteins selected/ #all essential proteinss (5)
Results and discussion
We have analyzed the connection between the place-ment of proteins in RNN topology and essential proteins based on different PPI networks. These include five net-works for yeast: HC, Krogan, Gavin, Collins and DIP core, as well as DIP core network forE. Coli (see Meth-ods). Among these PPI networks, the yeast HC network is presented here as a model network for most of the experimentation. Detailed statistics of these PPI net-works are shown in Table 1.
The RNN topology is a scale free network [30], in which the distribution of the number of RNN connec-tions follows a power law. In RNN topology, there are only a few proteins (hub proteins) that are the nearest neighbors for a large number of proteins (Additional file 1, Figure S1 and Additional file 1, Figure S2). These pro-teins are especially interesting since, having a large number (>6) of RNNs, there are more essential proteins than non-essential proteins (Additional file 1, Figure S2).
Generation of RNN topology and assessment of RNN centrality measures
The connection ofRNN centralityand essential proteins was first analyzed based on the yeast HC PPI network. In the RkNN topology network, each protein has weighted edges pointing to it from other proteins, which in turn consider this protein to be among their top k
nearest neighbors (see details in Methods). Based on RkNN topologies with differentkvalues, it was observed that for RkNN with k > 5, increasing precision is observed in protein categories with increasing RNN
cen-trality. However, this is not obvious for RkNN with
smallerkvalues (see Figure 2). This may be due to a fil-tering effect: RkNN topologies with small kvalues may have filtered out so many edges from original PPI net-work, that the correlation of essential proteins and hub proteins could not be established. On the other hand, higherprecision could be obtained from R5NN rather than from other RkNN (k>5) for protein categories with
weighted PPI network, therefore rendering RNN topol-ogy less advantageous to the original PPI network. To determine this, we have computed the RNN centrality
values based on RnNN (n = # of proteins), which would be exactly the same as degree centrality values (calcu-lated as the degrees of proteins in the PPI network) computed on the original PPI network for every protein. We also observed that RNN centralityvalues based on R10NN are not significantly different from those based on RnNN (Figure 2). Therefore, the bestRNN centrality
values were obtained based on RkNN withk value not too large (>10) or too small (<5). Based on this analysis, we selected R5NN to represent RNN topology, and used it to perform all analyses described in the remainder of this manuscript.
Comparing RNN centrality with other centrality measures
RNN centrality was compared with simple centrality
measures based on the original PPI network. These cen-trality measures included the following: degree cencen-trality (DC), which is calculated as the degree of the specific protein in the PPI network; closeness centrality (CC),
which is calculated as the sum of the lengths of shortest paths from all other proteins to the specific protein in the PPI network; and betweenness centrality (BC) [16], which is the number of all-to-all shortest paths that go through the specific protein in the PPI network. A ran-dom selection method, based on the average result from ten runs of random sampling of proteins in PPI net-work, was also used for comparison of these centrality measures. Results show that all of these centrality mea-sures were much better than random selection (Figure 3). Additionally,RNN centrality was superior to other centrality measures with regard toprecisionvalues.
Assessment of RNN cluster centrality
[image:5.595.55.541.110.189.2]Since PPI networks are incomplete and noisy, it is not sufficient to distinguish essential and non-essential pro-teins based solely on a single protein’s property, such as the RNN centrality. Alternatively, previous research has shown that essential proteins are more likely to be in densely connected clusters [31]. Here, we also analyzed the enrichment of essential proteins in RNN clusters Table 1 Statistics of the tested PPI networks.
Organism PPI network name Number of proteins Number of interactions Average degree Number (Proportion) of essential proteins
E Coli DIP Core 1,223 993 1.62 113 (0.09)
Yeast DIP Core 3,645 4,553 2.50 690 (0.19)
Krogan 2,674 7,079 5.29 712 (0.27)
Gavin 1,430 7,592 10.62 576 (0.40)
Collins 1,958 23,486 23.99 622 (0.31)
HC 2,998 9,258 6.18 871 (0.29)
Proportion of essential proteins was computed as the number of essential proteins, divided by the total number of proteins in the PPI network.
[image:5.595.56.540.483.690.2](clustering property). Proteins with a higher proportion of their RNNs as essential proteins were more likely to be essential proteins, indicating that essential proteins tend to cluster together in RNN topology (see example Figure 4, also Additional file 1, Figure S3),. More specifi-cally, in Figure 4, all of the 9 proteins in the RNN clus-ter were essential, and out of their 97 R1NNs, 63 (64.9%) were also essential proteins. This illustrates the importance of analyzing the connection of essential pro-teins and protein clusters (RNN clusters) in RNN topology.
First, we analyzed the enrichment of essential proteins in RNN clusters (see Methods for details of the cluster-ing procedure). We compared the “proportion of
essential proteins identified” (recall) values based on all merged RNN clusters (defined in Methods) with that based on random selection of the same number of pro-teins in PPI network. In the HC yeast PPI network, 87% of the essential proteins in the whole PPI network were within merged RNN clusters, as compared to 29% from random selection of proteins (Table 2). For other PPI networks, similar results were also observed: more than 70% of the essential proteins in the whole PPI network were within merged RNN clusters (recall= 70% ~ 90%), compared to onlyrecall= 20~40% from random selec-tion of proteins (Table 2).
[image:6.595.57.539.87.287.2] [image:6.595.56.539.540.679.2]The topological importance of RNN clusters was examined by analyzing the effect of removing merged Figure 3The proportion of essential proteins (precision) in proteins ranked by different centrality measures.RNN centralityis compared with DC (degree centrality), CC (closeness centrality), BC (betweenness centrality) and centrality based on random selection. Results were based on yeast HC PPI network. In each category, the top % of proteins with highest centrality values were computed by different methods and compared.
RNN clusters (including protein members and corre-sponding edges) on the change of topological properties of the PPI network. By comparing the average degree, betweenness, and closeness per protein in the original PPI network and those after removing all (100%) merged RNN clusters, we observed that these topological prop-erties decreased to nearly half of their original values (Table 3). Furthermore, the removal of merged RNN cluster significantly deteriorated the network properties as compared to removal of the same number of ran-domly selected proteins (Table 3).
Analysis of properties of RNN clusters
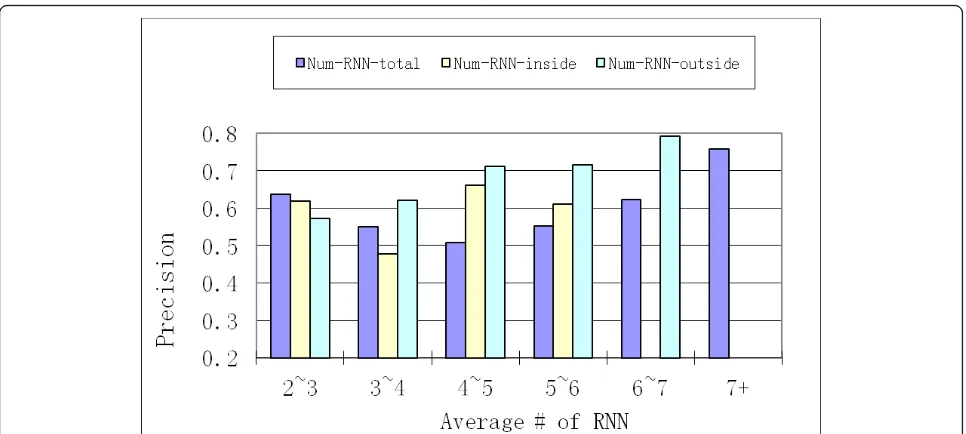
Next, we performed the analysis of various properties of simple and merged clusters. Out of 1,677 proteins, there were 565 simple clusters with average size of 2.87, out of which more than 70% were of size less than 4. There were 309 merged clusters with average size of 5.01, out of which less than 30% were of size less than 4. Then we have analyzed the properties that could accurately represent the enrichment of essential proteins in RNN clusters (clustering property). We have examined three properties: (1)Num-RNN-totalmeasured as the average number of edges pointing to a protein in RNN cluster;
(2) Num-RNN-inside measured as the average number
of edges pointing from one protein in RNN cluster to another protein in RNN cluster; and (3) Num-RNN-out-sidewhich was similarly defined. As shown in Figure 5, as the Num-RNN-outside increases, on merged RNN clusters, there is a corresponding linear increase of the
precision value. However, both Num-RNN-total and
Num-RNN-insidedo not have such a linear correlation
with precision. The same phenomenon was observed
when the basis was simple RNN clusters (details not shown). Therefore, among these three properties,
Num-RNN-outside reflects the enrichment of essential
pro-teins in RNN cluster. This is also the underlying princi-pal defining RNN cluster connectivity (refer to METHODS section).
Additionally, the cluster density on merged RNN clus-ters was also analyzed. The cluster density is defined as the number of edges in a cluster, divided by the number of all possible edges between proteins in the cluster. However, it was discovered that increasing the threshold of density of RNN clusters did not result in increased
precision in RNN clusters (see Additional file 1, Figure S4 (a)). This indicated that cluster density was not good at discriminating between essential and non-essential proteins.
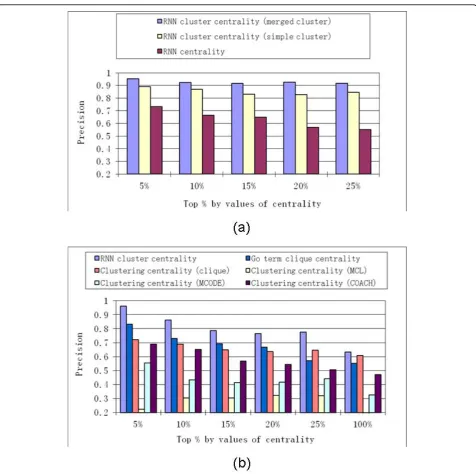
The simple RNN clusters and merged RNN clusters were compared by computing theRNN cluster centrality
based on single RNN clusters, with those that based on merged RNN clusters. The RNN cluster centralitybased on merged RNN clusters as consistently better than that based on simple RNN clusters, with regard toprecision
values (Figure 6 (a)s). For simplicity, hereafter, “RNN cluster centrality“ is referred to that computed for a merged RNN cluster.
Comparison of RNN cluster centrality with other centralities
By comparing RNN cluster centralitywithRNN central-ity,precision values were consistently much higher when based on RNN cluster centralityrather than RNN cen-trality (see Figure 6 (a)). This indicated that essential proteins were more likely to be hub proteins inside RNN clusters than hub proteins outside of the RNN cluster.
RNN cluster centralitywas then compared with
clus-tering centrality measures based on several clustering
[image:7.595.57.538.111.200.2]methods applied to PPI networks. The clustering Table 2 Comparison of“proportion of essential proteins identified”(recall) based on merged RNN cluster and that based on random selection of the same number of proteins in PPI network.
Organism PPI network Recall(merged RNN cluster) Recall(random selection) p-value
E Coli DIP Core 0.89 0.09 0.0002
Yeast DIP Core 0.73 0.19 0.0116
Krogan 0.81 0.27 0.0183
Gavin 0.85 0.40 0.0036
Collins 0.79 0.31 0.0110
HC 0.87 0.29 0.0014
Results were based on different PPI networks. p-value indicates the probability that therecallvalue is obtained based on random selection of proteins.
Table 3 The effect of removal of RNN clusters on the change of topological properties of yeast HC PPI network.
Remove top % RNN clusters 0% 10% 20% 50% 100% p-value
Average Degree per protein 6.18 5.61 (5.94) 4.94 (5.83) 4.15 (5.39) 3.55 (4.79) 0.021
Average Betweenness per protein 0.190 0.073 (0.210) 0.0069 (0.207) 0.063 (0.196) 0.057 (0.192) 0.002
Average Closeness per protein 0.103 0.084 (0.088) 0.080 (0.084) 0.065 (0.081) 0.059 (0.074) 0.023
[image:7.595.55.540.659.714.2]methods that we compared included the following: MCODE, which is based on network density [32]; the MCL method, based on random walk [33]; the COACH method, based on core-attachment structure [34]; and clustering by cliques [31]. A clique in PPI network is a subgraph in which each of the proteins is connected with all other proteins in the same subgraph. Recently, a research study was conducted on clustering proteins in PPI network based on GO function annotation [12], in which densely connected proteins with same GO term annotations were considered to be in the same cluster. Since essential proteins tend to be enriched in cliques [31] and in clusters with the same GO term annotations [12], we introduced the“GO term cliques” where essen-tial proteins were expected to be highly enriched. The “GO term cliques” were created as follows: proteins with the same GO function annotation [35] from the PPI network were clustered, and then cliques (with number of proteins > 2) from these clusters were extracted as GO term cliques. Note that“GO term cli-ques”was a stringent term, since all proteins in the cli-que should have the same GO function annotation and also connect to all other proteins in the same clique. Formula (3) was used to compute clustering centralities based on these clustering methods.
Results on the yeast HC PPI network show thatRNN cluster centrality had superiorprecisionvalues relative to other clustering centralities (Figure 6 (b)). Among all of these centrality measures, theRNN cluster centrality
was more effectively discriminated between essential
and non-essential proteins. It is worth noting that the superior results of RNN centralitywere obtained with-out utilizing functional annotation information as is the case for GO term clique. Additionally, though similarly
high precision values could be obtained from GO term
clique centrality (Figure 6 (b)), higherrecallvalues were obtained from all RNN clusters than from those obtained from GO term cliques. Based on the yeast HC PPI network, 754 essential proteins (out of all 871 essential proteins,recall= 0.87) were identified from all RNN clusters, while only 172 essential proteins (recall= 0.20) were identified from all GO term cliques. The main reason for lowrecallvalues based on GO term cli-ques is that GO term clicli-ques contained only a small fraction of proteins in the PPI network; out of all 2,998 proteins in yeast HC PPI network, only 311 were mem-bers of GO term cliques. On the other hand, 1,192 pro-teins in the yeast HC PPI network were members of merged RNN clusters.
We also compared different cluster centrality mea-sures on other yeast PPI networks, as well as anE.Coli
PPI network. Results from these PPI networks indicated thatRNN cluster centralityand GO term clique central-ity gave consistently higherprecisionvalues (Additional file 1, Figure S5). Additionally, in theE. Coli PPI net-work,RNN cluster centrality yielded superiorprecision
[image:8.595.57.540.87.304.2]this was independent of the organisms on which the PPI network was established.
Assessment of biological importance of RNN cluster centrality
Comparison of merged RNN clusters with known protein complexes
Previous studies [20] suggest that proteins were essential due to their involvement in densely connected and
biologically meaningful clusters of proteins, such as pro-tein clusters sharing the same GO term annotation [12] and protein complexes [20]. As we have related here, merged RNN clusters were comparable to GO term cli-ques with regard to the enrichment of essential proteins. Here, we compared merged RNN clusters with known protein complexes [18].
[image:9.595.60.537.85.559.2]and protein complexes: out of the 309 merged RNN clusters, 115 (37.2%) had higher than 20% protein over-laps (computed as the # of overlapping proteins/# pro-teins in complex) with 126 (29.8%) out of 423 reference protein complexes, and 81 (26.2%) with least 50% pro-tein overlaps with 81 (19.1%) reference propro-tein com-plexes. The amount of overlap was high, which is even comparable to the results of some of the most recent work on protein complex prediction [36].
An example of a merged RNN cluster in a yeast HC PPI network consisted of 8 proteins, all these 8 proteins belonged to a protein complex for rRNA processing that consisted of 12 proteins (complex SG_0000176 from SGD [37]) (Figure 7). All of these 8 proteins and their connections composed of a big clique, while adding the other 4 proteins outside of the merged RNN cluster would result in a non-clique. This indicated that pro-teins are very densely connected. From these 8 propro-teins, 6 were found to be essential proteins, as identified by gene deletion experiments [2]. The other two proteins (YDL111C for gene RRP42 and YGR195W for gene
[image:10.595.60.539.356.692.2]SKI6) were also essential (refer to http://www.yeastgen-ome.org), but they were not identified by the gene dele-tion experiments. Addidele-tionally, except for protein YGR095C, 7 out of 8 proteins in this RNN cluster are exosome complex exonuclease proteins. While in the other 4 proteins that are members of protein complex SG_0000176 but not members of this RNN cluster, only two proteins are exosome complex exonuclease proteins. Another example of merged RNN cluster in a yeast HC PPI network consisted of 8 proteins (Figure 8). All of these 8 proteins were in the 26S proteasome regula-tory particle chain. Out of these 8 proteins, only one was not an essential proteins, and its degree in R5NN topology was ranked 5th out of 8 proteins. Out of these 8 proteins, 5 belonged to a protein complex (SG_0008541). This protein complex contained 10 members, and the other 5 members of this protein com-plex were within the R5NN for proteins in this RNN cluster. The proportion of essential proteins within the R5NN was 59.0% (23/39), which was lower than the enrichment of essential proteins in RNN cluster 87.5%
(7/8) but higher than the PPI network average (29%). This indicated that (1) essential proteins tended to be enriched in R5NN topology and (2) essential proteins were more enriched in RNN clusters. Additionally, we have noticed that among all proteins in this RNN clus-ter and their R5NN, the members of the RNN clusclus-ter did not have high connectivity, indicating that density-based methods may not work well on clustering essen-tial proteins.
From “DIP core” E. ColiPPI network, a merged RNN cluster consisted of 5 proteins: 9704N (FtsL), DIP-9703N (FtsK), DIP-9706N (FtsQ), DIP-9702N (PBP-3) and DIP-12117N (YgbQ). Except for the last one, which was a hypothetical protein, 4 proteins in this merged RNN cluster were essential proteins. The protein DIP-9704N, DIP-9703N, DIP-9706N and DIP-12117N were all cell division protein, and DIP-12117N was also a Penicillin-binding protein. Together, 9704N, DIP-9703N and DIP-9706N could be members of different protein complexes, though sometimes 9704N, DIP-9706N could both be members of a complex without
DIP-9703N [38]. As respect to structure, the localization of 9704N was dependent on 9703N and DIP-9706N, and DIP-9702N’s localization required DIP-9704N and DIP-9703N [39].
Comparing RNN clusters with protein complexes, it was also observed that the enrichment of essential pro-teins is more significant in merged RNN clusters than in protein complexes; we have definedprotein complex centralityin the same way as clustering centrality, and discovered that RNN cluster centrality is superior to protein complex centrality with regard to precision
values (Additional file 1, Figure S6).
Analysis of the connection between merged RNN clusters and GO processes
[image:11.595.58.540.88.426.2]GO processes”in [12]), and generated GO sub-networks so that each of these sub-networks contains proteins of the same GO process. Following these operations, the proportion of essential proteins in these GO sub-net-works was computed. It was apparent that the enrich-ment of essential proteins in proteins that are in GO sub-network and merged RNN clusters was usually higher than the enrichment of essential proteins in GO sub-networks, which indicates that merged RNN clus-ters play an important role in these GO processes (Table 4). In GO processes that are highly enriched in essential proteins, such as RNA metabolic process (GO:0016070), the essential proteins were also distribu-ted unevenly (with regard to inside and outside of the RNN clusters): For RNA metabolic process, 69% of pro-teins in GO sub-network were essential propro-teins, while for proteins that are both in the GO sub-network and in the merged RNN cluster, 85% are essential proteins. This property of merged RNN clusters is similar to that of essential complex biological modules (ECOBIMs) that are introduced in [12], suggesting that there is a low tol-erance of merged RNN clusters to biological
perturbation. However, it is worth noting that biological annotation, such as GO, was not used in creating the RNN clusters, whereas ECOBIMs were generated based on such information. From the above results, it was sug-gested that both the placement of the protein in the RNN topology and the GO process annotation of the protein are very good predictors of protein essentiality.
Analysis of putative types of hubs
[image:12.595.57.537.391.714.2]Some debate has persisted in the literature regarding the possible distinction between “date” and “party” hubs ([40]) in the PPI network. In this work, we have also tried to analyze whether any significant difference is detectable between the two putative hub types using RNN cluster centrality measure. The date/party distinc-tion is a biologically meaningful property, and we have used the intersection of hub proteins derived from our work and those from [27]. Based on yeast HC PPI net-work, we deleted either putative date hubs or putative party hubs in descending order of RNN cluster central-ity from the PPI network, and computed the average closeness of the proteins of the remaining part in the PPI network. It was observed that there was not much
Table 4 The enrichment of essential proteins in merged RNN clusters for GO sub-networks in the yeast HC PPI network.
GO term Name Proportion of essential proteins in
GO sub-network
GO sub-network and merged RNN clusters
GO sub-network but not in merged RNN clusters
GO:0042254 ribosome biogenesis 0.69 0.85 0.63
GO:0016070 RNA metabolic process 0.48 0.66 0.41
GO:0006997 nucleus organization 0.47 0.60 0.44
GO:0007059 chromosome segregation 0.47 0.50 0.46
GO:0070271 protein complex biogenesis 0.44 0.67 0.39
GO:0007049 cell cycle 0.36 0.48 0.34
GO:0044257 cellular protein catabolic process 0.36 0.81 0.21
GO:0006350 transcription 0.35 0.50 0.30
GO:0006259 DNA metabolic process 0.33 0.44 0.30
GO:0006457 protein folding 0.33 0.13 0.36
GO:0051276 chromosome organization 0.30 0.37 0.28
GO:0006810 transport 0.29 0.52 0.26
GO:0016192 vesicle-mediated transport 0.27 0.55 0.22
GO:0006412 translation 0.25 0.47 0.21
GO:0016044 membrane organization 0.24 0.46 0.21
GO:0006464 protein modification process 0.20 0.38 0.16
GO:0006950 response to stress 0.20 0.39 0.16
GO:0000746 conjugation 0.19 0.20 0.18
GO:0007126 meiosis 0.17 0.35 0.14
GO:0044262 cellular carbohydrate metabolic process
0.17 0.57 0.14
GO:0007165 signal transduction 0.15 0.30 0.13
GO:0019725 cellular homeostasis 0.08 0.08 0.08
GO:0042221 response to chemical stimulus 0.07 0.17 0.06
difference between the deletion of putative date hubs and the deletion of putative party hubs: when 50% of putative date hubs were deleted, the average closeness was 0.076, while deletion of 50% of putative party hubs resulted in the average closeness of 0.073. Therefore, there was not much topological difference between date and party hubs in the PPI network as regard to hub deletion from PPI network based on RNN cluster centrality.
Conclusions
In this work, we have examined the placement of essen-tial proteins in RNN topology. The RNN topology is a weighted directed graph generated from PPI network, in which the topological dependencies of one protein to the others are elucidated. Based on different types of PPI networks, we found that proteins with many RNNs (highRNN centralityvalues) are more likely to be essen-tial proteins. Additionally, it was observed that essenessen-tial proteins tend to be enriched in RNN clusters (i.e., clus-tering property of essential proteins). This finding was consistent with recent reports, suggesting that essential proteins tend to be members of densely connected clus-ters [20]. Moreover, we have shown that RNN clusclus-ters have a higher proportion of essential proteins than other types of clusters. We have also introduced the
RNN cluster essentiality. And demonstrated that it was constantly superior toRNN centralityand other cluster-ing centrality measures, e.g., clustering centralitybased on cliques, with regard to the proportion of selected proteins that are essential proteins. Furthermore, we have analyzed the connection between merged RNN clusters and GO processes, and discovered that enrich-ment of essential proteins in the intersection of a GO sub-network and merged RNN clusters is generally higher than the enrichment of essential proteins in GO sub-networks alone. This indicated that the placement of the protein in the RNN topology and the GO process annotation of the protein are both important predictors of protein essentiality. Therefore, future work should include a meta centrality measurement, such as Uni-Score [13] based on several existing methods, that com-bines both theRNN cluster centralityand the GO term for increased power to discriminate between essential and non-essential proteins.
Appendix
KN’s current address: Qingdao Institute of BioEnergy and Bioprocess Technology, Chinese Academy of Sciences. Qingdao, Shandong, China. Email: ningkang@-qibebt.ac.cn.
Additional material
Additional file 1: Additional figures for the paper. Figure S1. The weighted yeast HC PPI network. Figure S2. The distribution of the frequency (number) of essential and non-essential proteins. Figure S3. Number of proteins and proportion of essential proteins in these proteins (y-axis) categorized by the proportion of essential proteins as their RNN (x-axis). Figure S4. The effect of cluster density on essential protein identification in RNN topology. Figure S5. The proportion of essential proteins in top proteins on different PPI networks. Figure S6. The proportion of essential proteins in top proteins ranked by different centrality measures.
Acknowledgements
We thank Hon Nian Chua from Harvard University for insightful discussions. This work was supported in part by NIH grants R01-CA-126239 and R01-GM-094231.
Author details
1Department of Pathology, University of Michigan, 4237 Medical Science
Building I, Ann Arbor, MI, 48109, USA.2Center for Computational Biology and Medicine, University of Michigan, Ann Arbor, MI, 48109, USA.
3Department of Computer Science, National University of Singapore, 117417,
Singapore.
Authors’contributions
KN conceived the study, proposed the methods, performed the experiments, wrote and revised the manuscript. HKN and SS performed the experiments. HWL and AIN revised the manuscript. All authors have read and approved this manuscript.
Received: 29 January 2010 Accepted: 12 October 2010 Published: 12 October 2010
References
1. Baba T, Ara T, Hasegawa M, Takai Y, Okumura Y, Baba M, Datsenko KA, Tomita M, Wanner BL, Mori H:Construction of Escherichia coli K-12 in-frame, single-gene knockout mutants: the Keio collection.Mol Syst Biol 2006,2, 2006.0008.
2. Winzeler EA, Shoemaker DD, Astromoff A, Liang H, Anderson K, André B, Bangham R, Benito R, Boeke JD, Bussey H,et al:Functional
Characterization of the S. cerevisiae Genome by Gene Deletion and Parallel Analysis.Science1999,285:901-906.
3. Giaever G, Chu AM, Ni L, Connelly C, Riles L, Veronneau S, Dow S, Lucau-Danila A, Anderson K, Andre B,et al:Functional profiling of the Saccharomyces cerevisiae genome.Nature2002,418:387-391. 4. Ito T, Tashiro K, Muta S, Ozawa R, Chiba T, Nishizawa M, Yamamoto K,
Kuhara S, Sakaki Y:Toward a protein-protein interaction map of the budding yeast: A comprehensive system to examine two-hybrid interactions in all possible combinations between the yeast proteins.
Proceedings of the National Academy of Sciences of the United States of America2000,97:1143-1147.
5. Krogan NJ, Cagney G, Yu H, Zhong G, Guo X, Ignatchenko A, Li J, Pu S, Datta N, Tikuisis AP,et al:Global landscape of protein complexes in the yeast Saccharomyces cerevisiae.Nature2006,440:637-643.
6. Gavin A, Bosche M, Krause R, Grandi P, Marzioch M, Bauer A, Schultz J, Rick JM, Michon A, Cruciat C,et al:Functional organization of the yeast proteome by systematic analysis of protein complexes.Nature2002, 415:141-147.
8. Han JJ, Bertin N, Hao T, Goldberg DS, Berriz GF, Zhang LV, Dupuy D, Walhout AJM, Cusick ME, Roth FP, Vidal M:Evidence for dynamically organized modularity in the yeast protein-protein interaction network.
Nature2004,430:88-93.
9. Fiedler D, Braberg H, Mehta M, Chechik G, Cagney G, Mukherjee P, Silva AC, Shales M, Collins SR, Wageningen SV,et al:Functional Organization of the S. cerevisiae Phosphorylation Network.Cell2009,136:952-963.
10. Jeong H, Mason SP, Barabasi A, Oltvai ZN:Lethality and centrality in protein networks.Nature2001,411:41-42.
11. He X, Zhang J:Why Do Hubs Tend to Be Essential in Protein Networks?
PLoS Genet2006,2:e88.
12. Zotenko E, Mestre J, O’Leary DP, Przytycka TM:Why Do Hubs in the Yeast Protein Interaction Network Tend To Be Essential: Reexamining the Connection between the Network Topology and Essentiality.PLoS Comput Biol2008,4:e1000140.
13. Chua Nian Hon, Tew Leong Kar, Xiao-Li Li, See-Kiong Ng:A Unified Scoring Scheme for Detecting Essential Proteins in Protein Interaction Networks.
Tools with Artificial Intelligence, 2008. ICTAI‘08. 20th IEEE International Conference on2008,2:66-73.
14. Batada NN, Hurst LD, Tyers M:Evolutionary and Physiological Importance of Hub Proteins.PLoS Comput Biol2006,2:e88.
15. Seo CH, Jeong-Rae K, Man-Sun K, Kwang-Hyun C:Hub genes with positive feedbacks function as master switches in developmental gene regulatory networks.Bioinformatics2009, btp316.
16. Estrada E:Virtual identification of essential proteins within the protein interaction network of yeast.PROTEOMICS2006,6:35-40.
17. Acencio M, Lemke N:Towards the prediction of essential genes by integration of network topology, cellular localization and biological process information.BMC Bioinformatics2009,10:290.
18. Wang H, Kakaradov B, Collins SR, Karotki L, Fiedler D, Shales M, Shokat KM, Walther TC, Krogan NJ, Koller D:A Complex-based Reconstruction of the Saccharomyces cerevisiae Interactome.Mol Cell Proteomics2009, 8:1361-1381.
19. Hart GT, Lee I, Marcotte E:A high-accuracy consensus map of yeast protein complexes reveals modular nature of gene essentiality.BMC Bioinformatics2007,8:236.
20. Pache R, Babu MM, Aloy P:Exploiting gene deletion fitness effects in yeast to understand the modular architecture of protein complexes under different growth conditions.BMC Systems Biology2009,3:74. 21. Korn F, Muthukrishnan S:Influence sets based on reverse nearest
neighbor queries.SIGMOD Rec2000,29:201-212.
22. Tao Yufei, Yiu Lung Man, Mamoulis N:Reverse Nearest Neighbor Search in Metric Spaces.IEEE Trans Knowl Data Eng2006,18:1239-1252. 23. Deane CM, Salwinski L, Xenarios I, Eisenberg D:Protein Interactions: Two
Methods for Assessment of the Reliability of High Throughput Observations.Mol Cell Proteomics2002,1:349-356.
24. Stark C, Breitkreutz B, Reguly T, Boucher L, Breitkreutz A, Tyers M:BioGRID: a general repository for interaction datasets.Nucl Acids Res2006,34: D535-539.
25. Gavin A, Aloy P, Grandi P, Krause R, Boesche M, Marzioch M, Rau C, Jensen LJ, Bastuck S, Dumpelfeld B,et al:Proteome survey reveals modularity of the yeast cell machinery.Nature2006,440:631-636. 26. Collins SR, Kemmeren P, Zhao X, Greenblatt JF, Spencer F, Holstege FCP,
Weissman JS, Krogan NJ:Toward a Comprehensive Atlas of the Physical Interactome of Saccharomyces cerevisiae.Mol Cell Proteomics2007, 6:439-450.
27. Batada NN, Reguly T, Breitkreutz A, Boucher L, Breitkreutz B, Hurst LD, Tyers M:Stratus Not Altocumulus: A New View of the Yeast Protein Interaction Network.PLoS Biol2006,4:e317.
28. Ho Y, Gruhler A, Heilbut A, Bader GD, Moore L, Adams S, Millar A, Taylor P, Bennett K, Boutilier K,et al:Systematic identification of protein complexes in Saccharomyces cerevisiae by mass spectrometry.Nature2002, 415:180-183.
29. Liu G, Wong L, Chua HN:Complex Discovery from Weighted PPI Networks.Bioinformatics2009, btp311.
30. Barabasi A:Scale-Free Networks: A Decade and Beyond.Science2009, 325:412-413.
31. Lin C, Juan H, Hsiang J, Hwang Y, Mori H, Huang H:Essential Core of Protein-Protein Interaction Network in Escherichia coli.Journal of Proteome Research2009,8:1925-1931.
32. Bader G, Hogue C:An automated method for finding molecular complexes in large protein interaction networks.BMC Bioinformatics2003, 4:2.
33. Enright AJ, Van Dongen S, Ouzounis CA:An efficient algorithm for large-scale detection of protein families.Nucl Acids Res2002,30:1575-1584. 34. Wu M, Li X, Kwoh C, Ng S:A core-attachment based method to detect
protein complexes in PPI networks.BMC Bioinformatics2009,10:169. 35. Myers C, Barrett D, Hibbs M, Huttenhower C, Troyanskaya O:Finding
function: evaluation methods for functional genomic data.BMC Genomics2006,7:187.
36. Chua HN, Ning K, Sung W, Leong HW, Wong L:Using indirect protein-protein interactions for protein-protein complex prediction.J Bioinform Comput Biol2008,6:435-466.
37. Hong EL, Balakrishnan R, Dong Q, Christie KR, Park J, Binkley G, Costanzo MC, Dwight SS, Engel SR, Fisk DG,et al:Gene Ontology annotations at SGD: new data sources and annotation methods.Nucleic Acids Res2008,36:D577-581.
38. Buddelmeijer N, Beckwith J:A complex of the Escherichia coli cell division proteins FtsL, FtsB and FtsQ forms independently of its localization to the septal region.Mol Microbiol2004,52:1315-1327.
39. Weiss DS, Pogliano K, Carson M, Guzman LM, Fraipont C, Nguyen-Distèche M, Losick R, Beckwith J:Localization of the Escherichia coli cell division protein Ftsl (PBP3) to the division site and cell pole.Mol Microbiol1997,25:671-681.
40. Batada NN, Reguly T, Breitkreutz A, Boucher L, Breitkreutz B, Hurst LD, Tyers M:Still Stratus Not Altocumulus: Further Evidence against the Date/Party Hub Distinction.PLoS Biol2007,5:e154.
doi:10.1186/1471-2105-11-505
Cite this article as:Ninget al.:Examination of the relationship between essential genes in PPI network and hub proteins in reverse nearest neighbor topology.BMC Bioinformatics201011:505.
Submit your next manuscript to BioMed Central and take full advantage of:
• Convenient online submission
• Thorough peer review
• No space constraints or color figure charges
• Immediate publication on acceptance
• Inclusion in PubMed, CAS, Scopus and Google Scholar • Research which is freely available for redistribution