Global Lithium Availability
A Constraint for Electric Vehicles?
Paul W. Gruber,Pablo A. Medina,Gregory A. Keoleian, Stephen E. Kesler,Mark P. Everson,and Timothy J. Wallington
Keywords:
electric vehicles (EVs) industrial ecology lithium demand
lithium-ion (Li-ion) battery mineral resources resource availability
Supporting information is available on theJIEWeb site
Address correspondence to
Gregory A. Keoleian Center for Sustainable Systems School of Natural Resources and
Environment 440 Church Street Ann Arbor, MI 48109-1041 USA
[email protected] http://css.snre.umich.edu/
c
2011 by Yale University
DOI: 10.1111/j.1530-9290.2011.00359.x
Volume 15, Number 5
Summary
There is disagreement on whether the supply of lithium is adequate to support a future global fleet of electric vehicles. We report a comprehensive analysis of the global lithium re-sources and compare it to an assessment of global lithium de-mand from 2010 to 2100 that assumes rapid and widespread adoption of electric vehicles.
Recent estimates of global lithium resources have reached very different conclusions. We compiled data on 103 deposits containing lithium, with an emphasis on the 32 deposits that have a lithium resource of more than 100,000 tonnes each. For each deposit, data were compiled on its location, geo-logic type, dimensions, and content of lithium as well as cur-rent status of production where appropriate. Lithium demand was estimated under the assumption of two different growth scenarios for electric vehicles and other current battery and nonbattery applications.
Introduction
Recognition of the adverse impacts of climate change and the importance of mitigating carbon dioxide (CO2) emissions has led to interest in vehicle electrification. Most major automobile companies are pursuing the development of elec-trified vehicles using lithium-ion (Li-ion) batter-ies. Lithium is the lightest solid element, the first member of the alkali metal group, and an excel-lent conductor of electricity and heat. Compared to nickel metal hydride batteries, the type of bat-tery currently powering most hybrid electric ve-hicles (HEVs), Li-ion batteries are lighter, less bulky, and more energy efficient. In addition, for production volumes greater than 300,000 units per year, Li-ion batteries are projected to be less expensive (Snyder et al. 2009).
Debate persists about whether the supply of lithium is adequate to meet lithium demand, par-ticularly for Li-ion batteries that will power the next generation of automobiles. Tahil (2007) has claimed that there is insufficient economically recoverable lithium to support a large-scale elec-tric vehicle fleet, whereas Evans (1978, 2008a, 2008b), Clarke and Harben (2009), and Yaksic and Tilton (2009) write that resources are ade-quate, although these reviews differ in their esti-mates of lithium resources.
This article attempts to resolve this contro-versy by reviewing information on important lithium deposits to estimate the global lithium resource and comparing this information to two scenarios for lithium demand between 2010 and 2100.
Lithium Supply
Previous Estimates of Lithium Reserves and Resources
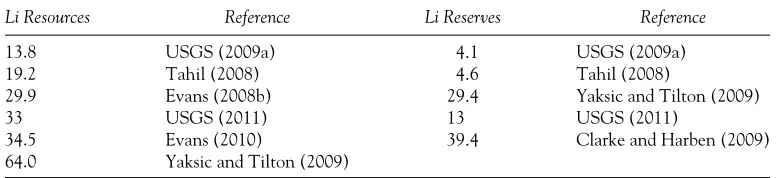
Recently published estimates of global lithium resources and reserves (table 1) vary significantly, and there is disagreement on how lithium re-sources and reserves should be quantified. As an example of the rapidly changing nature of these estimates, in just 1 year, from 2009 to 2010, the U.S. Geological Survey (USGS), one of the world’s most respected sources of information on mineral deposits, increased its estimate of lithium
resources from 13.8 to 25.5 Mt (1 Mt=1 million tonnes)1 and more than doubled its estimate of reserves, from 4.1 to 9.9 Mt, “based on new infor-mation from government and industry sources” (USGS 2009a; 2010, 93). In early 2011 the USGS further increased its estimates of lithium resources and reserves to 33 Mt and 13 Mt, re-spectively (USGS 2011). The USGS estimates global reserves and resources for many mineral commodities using data provided by mining com-panies, geological studies by government agen-cies, published research papers, presentations by company representatives, and trade journal arti-cles (USGS 2010).
Global lithium production comes from de-posits in which the lithium has been concen-trated above background crustal abundance by natural processes. The feasibility of recovering lithium economically from any deposit depends on the size of the deposit, its lithium content (referred to as “grade” for ores and “concentra-tion” for brines), the content of other elements, and the processes that are used to remove the lithium-bearing material from the deposit and extract lithium from it. For any specific deposit, the degree to which these parameters are known determines whether the deposit is classified as re-serve or resource. As new information becomes available and as prices change, the classification of a deposit as reserve or resource can change. It is generally assumed that mining and process-ing technologies will improve over time and that prices will rise, allowing poorer deposits to be exploited.
Table 1 World total lithium resource and reserve estimates
Li Resources Reference Li Reserves Reference
13.8 USGS (2009a) 4.1 USGS (2009a)
19.2 Tahil (2008) 4.6 Tahil (2008)
29.9 Evans (2008b) 29.4 Yaksic and Tilton (2009)
33 USGS (2011) 13 USGS (2011)
34.5 Evans (2010) 39.4 Clarke and Harben (2009) 64.0 Yaksic and Tilton (2009)
Note: Values are in million tonnes (Mt) of lithium (Li).
of naturally occurring solid, liquid, or gaseous ma-terial in or on the Earth’s crust in such form and amount that economic extraction of a commodity from the concentration is currently or potentially feasible” (USGS 2009b, 191). Reserve is defined by USGS as “That part of the reserve base that could be economically extracted or produced at the time of determination. (Reserve Base.—That part of an identified resource that meets specified minimum physical and chemical criteria related to current mining and production practices, in-cluding those for grade, quality, thickness, and depth)” (USGS 2009b, 191–2). Although re-serve estimates have been made for some deposits, they are not available for all deposits, and the long time interval for this study must emphasize lesser known deposits for which resource estimates are more appropriate.
Lithium Deposits
Lithium deposits are of three main types: brines and related evaporites, pegmatites, and sedimentary rocks. According to our analysis (see theDeposit-by-Deposit Estimatessection), brines containing lithium make up 66% of the world’s lithium resource, pegmatites make up 26%, and sedimentary rocks make up 8%.
Brines
Brines are saline waters with high contents of dissolved salts. They are found naturally in the pores of rocks where fresh (lake) or salt (ocean) water has undergone extreme evaporation. The most common such environment for lithium-bearing brines are lacustrine (lake) playas (salt flats), which consist of sand-size grains of rocks and minerals with brine filling the pores between
the grains. In some such playas, evaporation has deposited layers consisting almost entirely of salts, usually halite (NaCl). Lithium, which is a minor but locally important constituent of these brines, is thought to have been derived from ero-sion of rocks surrounding the playas and from hot springs that feed water into the playas (Ide and Kunasz 1989; Kesler 1994). The brine is extracted from wells that penetrate lithium-bearing zones of sediment (aquifers) and pumped into shallow evaporation ponds, where it is evaporated under controlled conditions that eliminate deleterious elements and compounds, principally magnesium and sulfate.
For the most part, brine salt flats contain-ing the highest concentrations of lithium are in Chile, Argentina, China, and Tibet. Brines in these deposits also contain large amounts of other useful elements, including potassium and boron, which offset some of the costs of pump-ing and processpump-ing brines. Potassium is mainly used as a fertilizer (potash) and, when produced from brines, usually takes the form of potassium chloride.
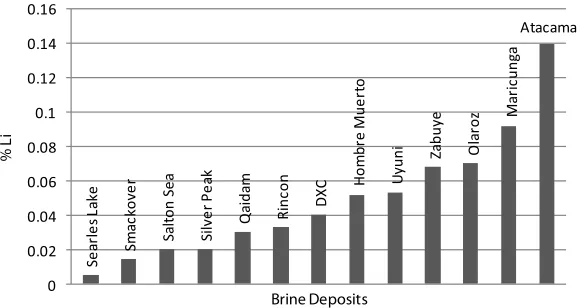
Figure 1 Average lithium (Li) concentrations of brines.
to over 12,000 tonnes of lithium metal tion, more than half of the world’s total produc-tion of 22,800 (O’Keefe 2009) to 25,400 tonnes of lithium in 2008 (USGS 2010). We have es-timated that Atacama has an in-situ (in the ground, before extraction and processing losses) lithium resource of at least 6.3 Mt. Zabuye, in China, is the next largest producing brine deposit. It has an area of 243 km2, an average lithium concentration of about 0.07%, an estimated lithium resource of 1.53 Mt, and a production capacity of 7,500 tonnes of Li2CO3 in 2004 (ZBY 2004). Silver Peak, in Nevada, has the lowest concentration of lithium of any currently producing brine deposit, around 0.02% after 40 years of operation (Kennedy 1990; Clarke and Harben 2009; Yaksic and Tilton 2009). It has an estimated lithium resource of 0.3 Mt (Tahil 2008).
Among deposits that have not yet gone into production, Bolivia’s Salar de Uyuni is of great-est intergreat-est. According to Comibol (2010), two drill holes indicate the presence of 11 lay-ers of lithium-bearing brine and salt with high porosity, totaling 170 meters in thickness. Al-though Uyuni brines have a relatively low av-erage lithium concentration, about 0.05%, the large volume of brine indicates a possible total resource of 10.2 Mt of lithium, or 27% of the world’s in-situ lithium resource. Whether this lithium can be produced economically will re-main uncertain until further drilling is conducted to define the lithium reserve and it is proven that
processing can deal with the high level of mag-nesium in the brine.
Brines are also found in deep oil reservoirs, and some of these are enriched in lithium. Best known of these are the brines in the Smack-over Formation in the Gulf Coast region of the United States. These brines are estimated to con-tain 0.75 Mt of lithium resource at an average lithium concentration of about 0.015%, which is the lowest concentration that we have included in our lithium resource compilation (and the sec-ond lowest concentration shown in figure 1). The Smackover brines are at depths of several thou-sand feet, which increases cost because of the need to pump the brine to the surface for process-ing (unless it is moved to the surface durprocess-ing oil production; Collins 1976).
Pegmatites
Pegmatite deposits are coarse-grained intru-sive igneous rocks that formed from the crys-tallization of magma at depth in the crust. Pegmatites can contain recoverable amounts of lithium, tin, tantalum, niobium, beryl-lium, and other elements. Lithium in peg-matites is usually present in the mineral spo-dumene (LiAlSi2O6), although it can also be present in petalite (LiAlSi4O10), lepi-dolite [(KLi2Al(Al,Si)3O10(F,OH)2], amblygo-nite [(Li,Na)AlPO4(F,OH)], and eucryptite (LiAlSiO4).
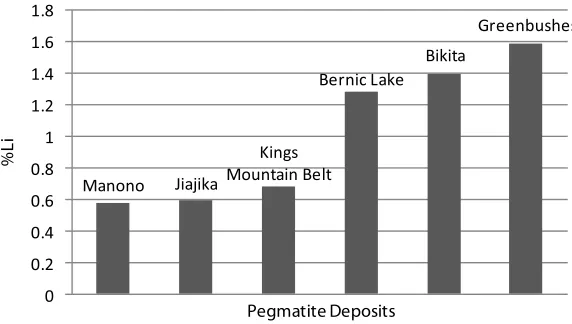
Figure 2 Average lithium (Li) concentrations of pegmatites.
lithium-bearing mineral is obtained from the peg-matite ore, usually by flotation. The mineral con-centrate is then pulverized and leached in hot so-lutions to release the lithium into solution, from which it is usually precipitated as lithium car-bonate (Tahil 2008). The grinding, heating, and dissolution steps in this process are expensive and are the reason that many pegmatites are at a disad-vantage compared to brines, which can be treated to release lithium much more easily. The concen-tration of lithium in pegmatites is considerably higher than in brines, however, and, where high enough, it offsets the additional costs. Pavlovic (1990) estimated the cost of lithium carbonate production from brine at USD $1.10 to $1.65 per kilogram (kg) Li2CO3at Atacama and Silver Peak, Nevada,3respectively, compared to $2.43 per kg Li2CO3 for production from spodumene at Bessemer City, North Carolina. In addition to lithium, some pegmatite operations produce tin and tantalum as well as feldspar and mica, which can help offset processing costs.
Lithium is currently being extracted from at least 13 pegmatite deposits (Clarke and Harben 2009), and more deposits are under development. The largest producing spodumene pegmatite op-eration, in Greenbushes, Australia, has an esti-mated resource of 560,000 tonnes of lithium in ore, with an average concentration of about 1.6% lithium (USGS 2007). The producing pegmatite deposit with the lowest lithium concentration of 0.59% lithium (Yaksic and Tilton 2009) is
Jia-jika, in China, which by our estimation has a resource of 204,000 tonnes of lithium in ore.
In the United States, Russia, and Australia, some pegmatite operations with low lithium concentrations ceased operations when South American brine deposits came on line in the 1980s and 1990s. For example, Kings Mountain and Cherryville spodumene pegmatite deposits in North Carolina, with average grades of 0.69% and 0.65% lithium, respectively, closed in 1991 (Garrett 2004) despite the fact that the region has an estimated resource of more than 5 Mt of lithium (Kesler 1978). The average concentra-tions of major pegmatite resources are presented in figure 2.
Sedimentary Rocks
“inferred” resources grading 0.27% lithium (WLC 2010b). The Jadar Valley, in Serbia, contains lacustrine evaporite deposits contain-ing jadarite [LiNaB3SiO7(OH)], a newly recog-nized mineral that contains lithium and boron (Obradovic et al. 1997; Stanley et al. 2007). An inferred resource of 114.6 Mt of jadarite-bearing rock containing 1.8% lithium oxide (Li2O) has been reported for this deposit (Rio Tinto, 2010). The feasibility of economically extracting the lithium from these deposits is not known at this time.
Costs and Production
Prices for potash, the most common by-product from brines, help lower the costs for production of lithium brine. According to the USGS, the average price for potash increased from $200 per tonne in 2004 to a record $717 per tonne in 2008, mainly due to increased demand for fertilizers (Jasinski 2008, 2009). Demand has dropped since 2008, due to the global economic recession, and potash companies reduced produc-tion by 28.5% from 2008 to 2009, which helped keep the price for potash above $700 per tonne through 2009 (Jasinski 2010).
The price of lithium carbonate (in 2008 dol-lars) steadily declined from around $6.50 per pound4in 1954 to about $1.50 per pound in 1998, as new South American production began at Ata-cama in 1984 and Hombre Muerto, Argentina, in 1997. Beginning in 2003, the price of lithium car-bonate (in 2008 dollars) began to increase, reach-ing around $2.80 per pound, or $6,173 per tonne, in 2008 (Yaksic and Tilton 2009). In 2009, how-ever, the price of lithium carbonate decreased by 25%, likely due to decreasing demand and pos-sibly due to SQM’s September announcement that it would reduce the price of lithium by 20% (Johnson 2009).
Lithium Resource Estimates
and Comparison to Other
Estimates
We compiled data on 103 deposits contain-ing lithium, with an emphasis on the 32 deposits containing more than 100,000 tonnes of lithium resources. In estimating the in-situ lithium
re-sources for the top 32 deposits, we obtained data from primary and secondary sources that were publically available. We estimated in-situ lithium resources from brine deposits using the relation
Lithium Resource=A×T×P×D×C
where A = area of aquifer, T = thickness of aquifer,P=porosity of aquifer,D=density of brine, andC=concentration of Li in brine. In most deposits, it was necessary to combine differ-ent aquifers into a single thickness estimate.
We estimated lithium resources from rock and mineral deposits using the relation
Lithium Resource=T×C
WhereT=tonnes of ore andC=concentration of Li in ore.
Deposits containing less than 100,000 tonnes of Li that are currently producing were also in-cluded in the estimate. These deposits, with a total lithium resource of 147,000 tonnes, are de-scribed in Supporting Information on the Jour-nal’s Web site. The Dead Sea, Great Salt Lake, and Searles Lake brines were not included in the total, because the concentrations of lithium in their brines are lower than even the poorest playa brines.
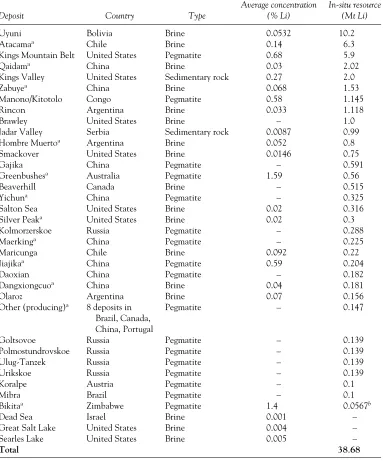
Table 2 presents the in-situ lithium resource estimate. (Descriptions of these deposits are available in the Supporting Information on the Web.)
Our review suggests that the total in-situ lithium resource in the world is 38.68 Mt. If we apply conservative 50% recovery rates for brines, pegmatites, and sedimentary rocks, which take into account extraction and processing losses as discussed further below, the minimum recover-able lithium resource is 19.34 Mt.
Table 2 World in-situ lithium resource
Average concentration In-situ resource
Deposit Country Type (% Li) (Mt Li)
Uyuni Bolivia Brine 0.0532 10.2
Atacamaa Chile Brine 0.14 6.3
Kings Mountain Belt United States Pegmatite 0.68 5.9
Qaidama China Brine 0.03 2.02
Kings Valley United States Sedimentary rock 0.27 2.0
Zabuyea China Brine 0.068 1.53
Manono/Kitotolo Congo Pegmatite 0.58 1.145
Rincon Argentina Brine 0.033 1.118
Brawley United States Brine – 1.0
Jadar Valley Serbia Sedimentary rock 0.0087 0.99 Hombre Muertoa Argentina Brine 0.052 0.8
Smackover United States Brine 0.0146 0.75
Gajika China Pegmatite – 0.591
Greenbushesa Australia Pegmatite 1.59 0.56
Beaverhill Canada Brine – 0.515
Yichuna China Pegmatite – 0.325
Salton Sea United States Brine 0.02 0.316 Silver Peaka United States Brine 0.02 0.3
Kolmorzerskoe Russia Pegmatite – 0.288
Maerkinga China Pegmatite – 0.225
Maricunga Chile Brine 0.092 0.22
Jiajikaa China Pegmatite 0.59 0.204
Daoxian China Pegmatite – 0.182
Dangxiongcuoa China Brine 0.04 0.181
Olaroz Argentina Brine 0.07 0.156
Other (producing)a 8 deposits in Pegmatite – 0.147
Brazil, Canada, China, Portugal
Goltsovoe Russia Pegmatite – 0.139
Polmostundrovskoe Russia Pegmatite – 0.139
Ulug-Tanzek Russia Pegmatite – 0.139
Urikskoe Russia Pegmatite – 0.139
Koralpe Austria Pegmatite – 0.1
Mibra Brazil Pegmatite – 0.1
Bikitaa Zimbabwe Pegmatite 1.4 0.0567b
Dead Sea Israel Brine 0.001 –
Great Salt Lake United States Brine 0.004 – Searles Lake United States Brine 0.005 –
Total 38.68
Note: Li=lithium; Mt=million tonnes.
aProducing.bWe used the lowest estimate in the literature, although some estimates for Bikita were over 100,000 tonnes
Li.
consistent with the recovery rates that Yaksic and Tilton (2009) and Tahil (2008) used.
The top ten lithium deposits make up 83% of the world’s total lithium resource and include six brine, two pegmatite, and two sedimentary
26%, and China accounts for 14%. Production of lithium is occurring at 19 deposits (eight of which are below 100,000 tonnes lithium), whose total in-situ resource is 12.6 Mt, or 33% of the world’s total. Of the ten largest deposits, only Atacama, Qaidam Basin, and Zabuye are cur-rently producing lithium. In the future, the de-posits with higher grades are likely to be mined before lower grade deposits. For brine deposits, Maricunga, Olaroz, and Uyuni are good candi-dates. For pegmatite deposits, Kings Mountain Belt may be next to come back on line, although other pegmatite deposits in Africa are also can-didates.
Our in-situ resource estimate of 39 Mt of lithium falls between Evans’s (2010) and Yak-sic and Tilton’s (2009) estimates of 34.5 and 64.0 Mt, respectively. Differences in estimates of lithium resources in these studies are partly attributable to different numbers of deposits in-cluded in each estimate. Tahil (2008), the USGS (2009a, 2010), and Evans (2008b, 2010) included fewer deposits. We evaluated 103 deposits and included 32 of the largest deposits and eight cur-rently producing, smaller deposits in our study. Yaksic and Tilton (2009) included the same num-ber of deposits in their study, although the specific deposits differed slightly.
The wide range of estimates is also attributable to differences in how resources and reserves were estimated for specific deposits. The quality of in-formation on the volume of lithium-bearing rock and its lithium content varied from deposit to deposit. Only one of the 40 deposits we studied reported information that was compliant with National Instrument 101 (NI 43-101; www.sfsc.gov.sk.ca/ssc/files/nat-noti/43-302amendedjan24-03.pdf), an internationally recognized standard for the quantification of mineral reserves and resources. This deposit, DXC (Dangxiongcuo), contains 181,000 tonnes of lithium and was NI 43-101 compliant (Tribe 2006). A portion of Western Lithium’s claim at Kings Valley contains an estimate that is compliant; it amounts to 233,000 tonnes out of an estimated 2.0 Mt of lithium resource at a cutoff grade of 0.20% lithium (WLC 2010a). In a recent article, Evans (2010) points out that few brine deposits can be compliant with NI 43-101 currently, because existing codes for
mineral resource and reserve reporting apply to solid-phase minerals rather than brines, which can change location during production. Assuming the standard is updated to reflect the fluidity of brines, we expect it to be applied more widely in the future, as companies seek to attract the investment necessary to develop their deposits for mining.
The lowest lithium resource estimate, 19.2 Mt by Tahil (2008), is lower than others primarily because it included fewer deposits and because Tahil used more conservative estimates for the size of deposits. For many large deposits, includ-ing Uyuni and Atacama, Tahil used the most conservative figures for surface area, porosity, and concentration. He used a 20 km2area of the At-acama deposit in his estimate but did not indi-cate how he estimated the resource for the much larger 1,424 km2nucleus. Also, Tahil did not in-clude pegmatite or sedimentary rock deposits in his estimate. In doing so, he neglected as much as one-third of the world’s lithium resource.
While twelve countries are mentioned, it is unclear how many countries in total the USGS included when compiling its most recent estimate of lithium resources (USGS 2011); we used data from deposits in 15 countries. The USGS does not state specifically how its lithium estimates were obtained, nor does it provide a comprehen-sive list of all deposits included. The main differ-ence between our analysis and that of the USGS is probably related to a larger estimate on our part for deposits in the United States and China.
In 2010, Evans (Vaccaro 2010) increased his estimate of lithium resources from 29.9 to 34.5 Mt. Evans (2008b) also increased the estimate of the Uyuni deposit from 5.5 Mt of lithium re-serves, as estimated by Ballivian and Risacher (1981), to 8.9 Mt, as estimated by Ballivian in 1989. Risacher and Fritz (1991) later revised the estimate to 9.0 Mt, on the basis of more detailed survey data and a higher lithium concentration, which is closer to our estimate of 10.2 Mt.
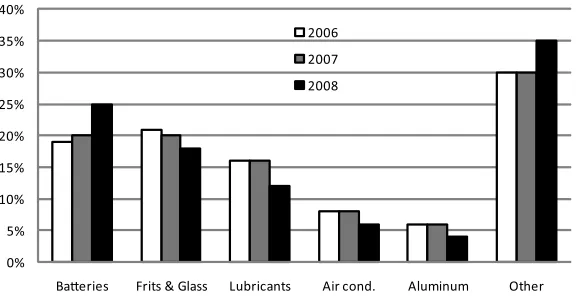
Figure 3 Global lithium consumption by category, 2006–2008, as a percent of total. Cond.=conditioning.
would be similar to our estimate and others in the literature. Unlike Yaksic and Tilton, we did not include the Dead Sea or the Great Salt Lake as re-sources. Clarke and Harben (2009) reported the highest reserve estimate (which they call “broad-based reserves”), including 61 deposits, but did not provide deposit-specific resource estimates.
Lithium Markets and Demand
The USGS and major lithium producers report lithium use by segment starting in 2006. Data for the last 3 years are shown in figure 3. Two categories (battery and others) show growth. The “other” category includes special al-loy production, chemical processing, continuous casting, and pharmaceuticals. The “battery” cat-egory includes portable electronics and, more re-cently, vehicles. Given the scale of the appli-cation, if use in vehicles increases, it is likely that the battery category will outpace all others. These categories were studied and their expected demand was projected through 2100.
Nonbattery Demand Forecast
Nonbattery lithium demand includes uses in frits and glass, lubricants, and air conditioning. We note that lithium could be substituted by other materials in these applications. In frits and glass, it could be substituted by sodic and potassic fluxes; in lubricants, by aluminum and calcium soaps; and lithium alloys could be substituted
by engineered resins that use boron, glass, and polymer fibers (USGS 2010).
In frits and glass, lithium carbonate is added to ceramics, enamels, and glass to reduce their melt-ing point, reduce viscosity, and increase surface tension, which makes lithium glasses suitable for ovenware (Ullmann 2000). Lithium hydroxide is used in the production of greases. The addi-tion of lithium stearates maintains the viscosity of greases at high temperatures and makes them insoluble in water. Both of these properties are important for lubricants in vehicles, aircrafts, and heavy machinery (Ullmann 2000).
Lithium bromide, lithium chromate, and lithium chloride are used in air condition-ers operating on the absorption principle. Lithium hydroxide is also used to absorb car-bon dioxide in submarines and spacecrafts (Ullmann 2000).
Other uses of lithium include production of organic compounds and alloys (Ullmann 2000). Lithium is used as a coolant and shielding ma-terial in nuclear reactors and for the production of tritium. Lithium metal is used in alloys with other metals; for example, it changes the hard-ness of aluminum and lead and the ductility of magnesium (Ullmann 2000).
High-purity lithium carbonate is used in phar-maceuticals to treat manic-depressive conditions (Ullmann 2000).
We estimated the accumulated lithium de-mand for the period 2010–2100, for applications other than batteries (i.e., lubricating grease, frits and glass, air conditioning, and other nonbattery uses), using growth estimates from Yaksic and Tilton (2009) and current demand levels; the re-sult was 3.16 million tonnes of lithium demand. Given the possibilities of substitution by other materials, we consider this value to be the up-per limit for the likely lithium demand in these applications.
Portable Electronics Battery Demand Forecast
Lithium metal and compounds are used as an-ode, cathan-ode, and electrolyte material in batteries (Frost & Sullivan 2008a). Lithium-based batter-ies are lighter, do not have a memory effect, and have a self-discharge rate lower than other types of batteries (Winter and Brodd 2004).
Global shipment data are available for pri-mary (i.e., nonrechargeable) batteries between 1994 and 2008 and for secondary (i.e., recharge-able) lithium batteries between 2003 and 2007. A linear regression analysis revealed that battery shipments were strongly correlated with global gross domestic product (GDP; correlation coef-ficients of 95% for primary batteries and 99% for secondary batteries.) We estimated global de-mand for batteries for the period 2010–2100 on the basis of the regression result and the Inter-governmental Panel on Climate Change (IPCC) 2010–2100 growth scenarios for future global GDP.
The IPCC identifies four world growth sce-narios (A1, A2, B1, and B2) with annual GDP in the ranges 2.5% to 3.0%, 2.0% to 2.3%, 2.5% to 2.6%, and 2.0% to 2.3%, respectively (IPCC 2000). On the basis of these values, two growth scenarios were explored: 2% and 3%.
Once we calculated the annual number of battery shipments, we determined the volume of lithium required, assuming that all batteries are disposed of after 1 year of useful life. Global recycling rates were not available; however, in the United Kingdom and Canada, disposable and rechargeable battery recycling rates are estimated to be near 5% (RBRC 2008; Electropaedia 2009). We used this value to represent global recycling of portable batteries.
Lithium recovery from recycling was assumed to be 90%, a rate that is currently being achieved (Tedjar 2009). Although recovery is expected to increase as recycling technologies improve, we kept it constant throughout the evaluation period.
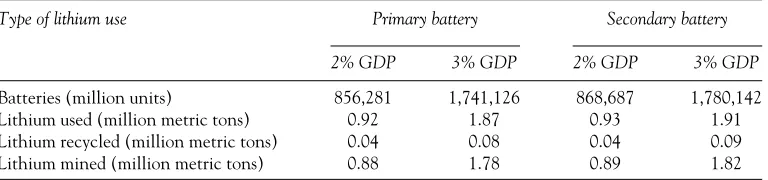
[image:10.504.73.457.552.642.2]Finally, we calculated the mass of lithium used per battery, assuming that all battery-related lithium use in 2008 was for primary and secondary portable batteries. SQM estimated that, in 2008, global lithium consumption was approximately 17,400 tonnes, 27% of which was used in bat-teries (SQM 2008). For the same year, Frost & Sullivan (2008b) reported that the world total count of primary and secondary lithium batteries was 4,386 million units. Hence, the average mass is 1.07 tonnes of lithium per million batteries. We assumed that this ratio remained constant for the period 2010–2100. Table 3 shows our estimate of the accumulated lithium demand for portable batteries, using two GDP growth scenarios (2% and 3%).
Table 3 Accumulated lithium demand for portable electronics, 2010–2100
Type of lithium use Primary battery Secondary battery
2% GDP 3% GDP 2% GDP 3% GDP
Batteries (million units) 856,281 1,741,126 868,687 1,780,142 Lithium used (million metric tons) 0.92 1.87 0.93 1.91 Lithium recycled (million metric tons) 0.04 0.08 0.04 0.09 Lithium mined (million metric tons) 0.88 1.78 0.89 1.82
Vehicle Battery Demand Forecast
As global penetration of electric vehicles (i.e., hybrid electric vehicles [HEVs], plug-in hybrid electric vehicles [PHEVs], and battery electric ve-hicles [BEVs]) increases, so will the demand for the batteries that power them. Currently, most HEVs use nickel-metal hydride (NiMH) batter-ies, but a transition to Li-ion batteries has be-gun, and researchers have predicted that Li-ion batteries will be used in the next generation of vehicles (Frost & Sullivan 2009). We note that other vehicle technologies, such as fuel cells and ultra-capacitor batteries, are being explored, and these may compete with Li-ion batteries. Hence, we view the demand values calculated below as upper limits.
The lithium demand for vehicle batteries was estimated as follows. First, we conducted a linear regression analysis using light-duty global vehi-cle production for the period 1995–2008 from the Ward’s 2009 Automotive Yearbook (Blinder 2009) and global GDP data; a 97% linear cor-relation was found. Second, we estimated vehi-cle manufacturing for 2010–2100 using two GDP growth scenarios (2% and 3%). In the 3% GDP growth scenario the annual production of light-duty vehicles increases to approximately 630 mil-lion units in 2100; this equates to the production
of 42 new vehicles per 1,000 persons per year in 2100. This level of global vehicle production and consumption is comparable in magnitude to the current level in the United States and prob-ably is an upper limit for future global produc-tion. Third, we used Credit Suisse’s projection of electric vehicle penetration from 2010 to 2030 (Jobin et al. 2009). Beyond 2030 we assumed that year-over-year electric vehicle growth remained constant in the 2% GDP scenario and increased 0.5% every 10 years in the 3% GDP scenario. The projected global annual light-duty vehicle production is shown in figure 4. These growth projections result in 100% electric vehicle (EV) penetration in 2083 and 2087 for the 2% and 3% GDP scenarios, respectively. Fourth, battery life, vehicle life, and battery recycling were ac-counted for, and the accumulated lithium use for the period 2010–2100 was estimated.
[image:11.504.96.383.441.590.2]To calculate the number of batteries needed, we assumed that all vehicle batteries have 10 years of useful life. The amount of lithium re-quired per battery was calculated according to the electric range of each type of vehicle. Con-sistent with estimates from a recent global en-ergy modeling study (Grahn et al. 2009), we as-sumed that HEVs have 2 km of electric range; PHEVs, 65 km; and BEVs, 200 km. Following the recent estimate by Notter and colleagues
Table 4 2010–2100 maximum expected lithium demand for electric vehicles batteries for 2% and 3% gross domestic product (GDP) growth scenarios and recycling participation at 90%, 96%, and 100%
Lithium 90% 96% 100%
Growth demandand
scenario source HEV PHEV BEV Total HEV PHEV BEV Total HEV PHEV BEV Total
2% Demanded 0.22 3.59 11.64 15.45 0.22 3.59 11.64 15.45 0.22 3.59 11.64 15.45
Recycled 0.12 1.94 6.76 8.82 0.13 2.06 7.22 9.41 0.14 2.15 7.52 9.80
Mined 0.10 1.66 4.88 6.63 0.09 1.53 4.43 6.05 0.08 1.44 4.13 5.66
3% Demanded 0.35 6.14 18.89 25.40 0.35 6.14 18.89 25.40 0.35 6.14 18.89 25.40
Recycled 0.17 2.87 9.61 12.65 0.19 3.05 10.25 13.49 0.20 3.18 10.68 14.05
Mined 0.18 3.28 9.29 12.75 0.17 3.09 8.64 11.90 0.16 2.96 8.21 11.35
Note: Values are in million tonnes (Mt). A recovery efficiency of 90% during the recycling process was assumed. HEV =
hybrid electric vehicle; PHEV=plug-in hybrid electric vehicle; BEV=battery electric vehicle.
(2010), we assumed that electric vehicles con-sume approximately 0.17 kilowatt-hours per kilometer (kWh/km)5. We consider a ±20% range around this value to give 0.14 to 0.20 kWh/km. Hence, to provide the needed range, the batteries for HEVs, PHEVs, and BEVs need to store 0.3 to 0.4, 9 to 13, and 28 to 40 kWh, respectively.
Recognizing the need to avoid deep discharge and seeking to be conservative in our estimations, we added a 100% buffer for HEV and a 50% buffer for PHEV and BEV batteries to provide adequate cycle life (Miller 2010). The resulting capacity requirements for HEVs, PHEVs, and BEVs bat-teries in our model are 0.6 to 0.8, 13 to 20, and 42 to 60 kWh, respectively. Li-ion batteries have approximately 0.114 kg Li per kWh (average for lithium-cobalt oxide [LiCoO2], lithium-nickel oxide [LiNiO2], and lithium-manganese oxide [LiMn2O4] cathode materials from Table 3.1 in Gaines and Cuenca 2000), so the lithium con-tent of batteries in HEVs, PHEVs, and BEVs would be 0.068 to 0.091, 1.48 to 2.28, and 5.13 to 7.70 kg.
To account for future improvements in ve-hicle efficiency (e.g., weight reduction, aerody-namic and rolling resistance improvements), we adopted the assumption of Grahn and colleagues (2009) that the vehicle energy demand will de-crease by a factor of 2 over the century (i.e., the energy efficiency increases at a compound rate of 0.77% per year over the period 2010– 2100). Hence, by 2100, HEVs, PHEVs, and BEVs would contain between 0.034 and 0.046, between 0.74 and 1.14, and between 2.57 and 3.85 kg of
lithium, respectively. Seeking to calculate maxi-mum expected lithium demand, we used the up-per bound of these ranges (i.e., 0.046, 1.14, and 3.85 kg) in our calculations.
Recycling of lithium from Li-ion batteries may be a critical factor in balancing the supply of lithium with future demand. To cover this fac-tor, we drew on estimates from several sources. The U.S. EPA reports that “nearly 90% of all lead-acid batteries are recycled” (EPA 2008). The International Lead Management Center re-ports that “recycling rates for used batteries is as high as 96% in many countries” (Wilson 2009). With regard to lead-acid batteries, the Interna-tional Lead Association states that “some coun-tries boast 100% recycling and most others share the possibility of 100% recyclability” (ILA 2010). We calculated total lithium demand and recy-cling volumes for three recyrecy-cling participation rates (90%, 96%, and 100%), with 90% recovery of lithium during the recycling process (Paulino et al. 2008; Tedjar 2009). The results are shown in table 4.
Total Demand Forecast
period to be 19.6 Mt (3.2 Mt from nonbattery use, 3.6 Mt from portable battery use, and 12.8 Mt from vehicle battery use), and hence we quote an upper limit of 20 Mt.
Conclusion
The lithium demand model shows that accu-mulated demand for lithium from 2010 to 2100 could be between 12 and 20 Mt, for the 2% and 3% GDP scenarios, when recycling participation is at its lowest (90%). The upper limit for lithium demand is significantly lower than the estimated 39 Mt of in-situ lithium resource but slightly higher than the estimated minimum 19 Mt of recoverable lithium. Because some large deposits will likely have higher recovery rates, the actual recoverable lithium will likely be higher than 19 Mt. The biggest hurdles to a long-term lithium supply will be establishing lithium production fa-cilities at the rate demanded by the automotive industry, advancing the technology to remove magnesium from lithium-bearing brines, and de-veloping the Uyuni deposit. Taking these obsta-cles into consideration, we conclude that lithium availability will not constrain the electrification of the automobile during the present century.
The in-situ resource estimate of 39 Mt will change as new information becomes available. Although the same data were not available for all deposits, the three largest deposits made up most of the world’s resource and were estimated on the basis of substantial data (seeCase Studies of Lithium Deposits in the Supporting Informa-tion on the Web). Seven of the top ten deposits are not in production, and two new types of de-posits, Kings Valley (hectorite) and Jadar Valley (jadarite), have not been operated economically. With demand for lithium batteries, we are en-tering a new lithium exploration era; new brine, spodumene, and other types of deposits will be discovered. Some deposits might not currently be economically exploitable, and others might pro-duce larger than expected amounts of lithium be-fore 2100. Further exploration of current and po-tential lithium deposits, especially if these studies are NI 43-101 compliant, will help produce im-proved estimates of the world’s lithium resources.
Growth ratios used to calculate lithium use in frits, lubricants, air conditioning, and other applications could be lower or higher than the real growth rates observed in the future. Annual global GDP growth for the period 2010–2100 could be less than 2% or more than 3%, thus af-fecting our estimates for the number of portable batteries and vehicle batteries manufactured. Our demand for battery use would also be affected if recycling participation and recovery factors were different than what we assumed in this work.
Despite these limitations, this study provides a comprehensive repository of data and estimates on lithium supply and a transparent set of pa-rameters used for projecting demand. It also pro-vides a context for interpreting and comparing results from previous investigations. Further-more, we hope this research facilitates future studies examining the adequacy of this unique resource.
Notes
1. One megatonne (Mt)=106tonnes (t)=one
tera-gram (Tg, SI)≈1.102×10⁶short tons.
2. One square kilometer (km2, SI)=100 hectares (ha) ≈0.386 square miles≈247 acres.
3. One kilogram (kg, SI)≈2.204 pounds (lb). 4. One pound (lb)≈0.4536 kilograms (kg, SI). 5. One kilowatt-hour (kWh)≈3.6×10⁶ joules (J,
SI)≈3.412×10³British Thermal Units (BTU).
References
Ballivian, O. and F. Risacher. 1981.Los Salares del Al-tiplano Boliviano. [The salt flats of the Bolivian Altiplano]. Paris: Office de la Recherche Scien-tifique et Technique Outre-Mer.
Blinder, A. K. 2009.Ward’s automotive yearbook 2009. Southfield, MI, USA: Ward’s Automotive Group. Clarke, G. M. and P. W. Harben. 2009.Lithium
avail-ability wall map LAWM.
Collins, A. 1976.Lithium abundances in oilfield waters. Report P 1005. Reston, VA, USA: U.S. Geolog-ical Survey.
Electropaedia. 2009. Battery and energy technologies. www.mpoweruk.com/recycling.htm. Accessed 18 June 2009.
EPA (U.S. Environmental Protection Agency). 2008. U.S. Environmental Protection Agency: Battery recycling. www.epa.gov/osw/conserve/materials/ battery.htm. Accessed 5 October 2009. Evans, R. K. 1978. Lithium reserves and resources.
En-ergy3(3): 379–385.
Evans, R. K. 2008a. An abundance of lithium.
http://lithiumabundance.blogspot.com/.
Ac-cessed 21 May 2009.
Evans, R. K. 2008b. An abundance of lithium:
Part. two. www.evworld.com/library/KEvans_
LithiumAbunance_pt2.pdf. Accessed 21 May 2009.
Evans, R. K. 2010. The lithium-brine reserve conun-drum.Northern Miner. 96(35): 2–6.
Frost & Sullivan. 2008a.Technical insights report: Energy storage and generation for portable power. London: Frost & Sullivan.
Frost & Sullivan. 2008b.World primary lithium battery markets. London: Frost & Sullivan.
Frost & Sullivan. 2009.World hybrid electric and electric vehicle lithium-ion battery market. London: Frost & Sullivan.
Gaines, L. and R. Cuenca. 2000.Costs of lithium-ion bat-teries for vehicles. Report ANL/ESD-42. Argonne, IL, USA: Argonne National Laboratory. Garrett, D. 2004.Handbook of lithium and natural
cal-cium chloride: Their deposits, processing, uses and properties. Amsterdam: Elsevier Academic Press. Grahn, M., C. Azar, M. I. Williander, J. E. Anderson,
S. A. Mueller, and T. J. Wallington. 2009. Fuel and vehicle technology choices for passenger ve-hicles in achieving stringent CO2 targets: Con-nections between transportation and other sec-tors.Environmental Science & Technology43(9): 3365–3371.
Ide, Y. F. and I. A. Kunasz. 1989.Origin of lithium in Salar de Atacama, Northern Chile. In Geology of the Andes and its relation to hydrocarbon and mineral resources, edited by G. E. Erickson, M. T. Ca ˜nas Pinochet, and J. A. Reinemund.Houston, TX: Circum-Pacific Council for Energy and Mineral Resources.
ILA (International Lead Association). 2010. Lead re-cycling. www.ila-lead.org/lead-information/lead-recycling. Accessed 16 February 2010.
IPCC. 2000.Emissions Scenarios. Ch. 4.3. Nakicenovic, N. and Rob Swart (Eds.) Intergovernmental Panel on Climate Change. Cambridge University Press, UK. pp. 570.
Jasinski, S. M. 2008. Mineral commodity summaries.
Potash. Reston, VA, USA: U.S. Geological Survey.
Jasinski, S. M. 2009. Mineral commodity summaries. Potash. Reston, VA, USA: U.S. Geological Survey.
Jasinski, S. M. 2010. Mineral commodity summaries. Potash. Reston, VA, USA: U.S. Geological Survey.
Jobin, L. et al. 2009.HEV and EV projections. Zurich, Switzerland: Credit Suisse.
Jobin, P., J. Yamaguchi, G. Balter, C. J. Ceraso, A. Chan, D. Eggers, D. Ellinghorst, M. Flanery, J. P. McNulty, S. Pearson, and J. Pitzer. 2009. Elec-tric Vehicles. Zurich, Switzerland: Credit Suisse, Global Equity Research, Energy Technology / Auto Parts & Equipment, 1 October 2009. Johnson, B. 2009. SQM slashes lithium prices.
http://www.morningstar.com/1/3/58042-sqm-slashes-lithium.html. Accessed 20 October 2010. Kennedy, B. 1990. Surface mining. Englewood, CO, USA: Society for Mining, Metallurgy, and Exploration.
Kesler, T. L. 1978. Raw lithium supplies.Mining Engi-neeringMarch: 283–284.
Kesler, S. E. 1994.Mineral resources, economics and the environment. Upper Saddle River, NJ, USA: Pren-tice Hall.
Miller, T. J. 2010. Personal communication with T. J. Miller, Manager, Energy Storage Research, Ford Motor Company, Dearborn, Michigan, January 2010.
Notter, D. A., R. Widmer, P. W¨ager, A. Stamp, R. Zah, and H.-J. Althaus. 2010. Contribution of Li-ion batteries to the environmental impact of electric vehicles.Environmental Science and Tech-nology44(17): 6550–6556.
Obradovic, J., J. Djurdjevic-Colson, and N. Vasic. 1997. Phytogenic lacustrine sedimentation oil shales in Neogene from Serbia, Yugoslavia. Jour-nal of Paleolimnology18(4): 351–364.
O’Keefe, M. 2009. Lithium opportunities update.
Toronto, Canada: Cormark Securities, Inc. Pavlovic, P. 1990. Desarrollo de la Industria del Litio en
Chile. Qu´ımica & Industria,Journal of the Chilean Society of Chemistry3: 4–19.
Paulino, J. F., N. G. Busnardo, and J. C. Afonso 2008. Recovery of valuable elements from spent Li-batteries.Journal of Hazardous Materials150(3): 843–849.
Rio Tinto. 2010. Inferred resource at Jadar lithium
project. www.riotinto.com/whatweproduce/
17056_inferred_resource_at_jadar_lithium_ project.asp. Accessed 29 March 2010.
Risacher, F. and B. Fritz. 1991. Quaternary geochemical evolution of the salars of Uyuni and Coipasa, Cen-tral Altiplano, Bolivia.Chemical Geology90(3–4): 269–282.
Snyder, K. A., X. Yang, and T. Miller. 2009. Hybrid vehicle battery technology: The transition from NiMH to Li-ion. Paper presented at the SAE World Congress & Exhibition, Detroit, Michi-gan, USA, 20–24 April.
SQM (Sociedad Quimica y Minera). 2008.Annual
Re-port 2008. Santiago, Chile.
Stanley, C. , G. C. Jones, M. S. Rumsey, C. Blake, A. C. Roberts, J. A. R. Stirling, G. J. C. Carpen-ter, P. S. Whitfield, J. D. Grice, and Y. Lepage. 2007. Jadarite, LiNaSiB3O7(OH), a new min-eral species from the Jadar Basin, Serbia.European Journal of Mineralogy19(4): 575–580.
Tahil, W. 2007.The trouble with lithium: Implications of future PHEV production or lithium demand. Martainville, France: Meridian International Research.
Tahil, W. 2008.The trouble with lithium 2: Under the microscope. Martainville, France: Meridian Inter-national Research.
Tedjar, F. 2009. Personal communication with F. Ted-jar, Founder and President, Recupyl SAS, Long Beach, CA, USA, June 2009.
Tribe, N. 2006. Qualifying report for Dangxiongcuo salt lake deposit for Sterling Group Ventures, Inc. www.sterlinggroupventures.com/dxcreport/ dxcreport.htm. Accessed 21 March 2010. U.S. Geological Survey. 2007.Minerals Yearbook, 2007,
Vol. III, International: Asia and the Pacific. U.S. Department of the Interior.
U.S. Geological Survey. 2009a.Mineral commodity sum-maries 2009: Lithium. Reston, VA, USA: U.S. Ge-ological Survey.
U.S. Geological Survey. 2009b. Appendix C: A
re-source/reserve classification of minerals. Reston, VA, USA: U.S. Geological Survey.
U.S. Geological Survey. 2010.Mineral commodity sum-maries 2010. Reston, VA, USA: U.S. Geological Survey.
U.S. Geological Survey. 2011.Mineral commodity sum-maries 2011: Lithium.Reston, VA, USA: U.S. Geological Survey.
Ullmann’s Encyclopedia of Industrial
Chem-istry. 2000. Lithium and lithium
com-pounds. http://mrw.interscience.wiley.com/
emrw/9783527306732/home/. Accessed 7
January 2010.
Vaccaro, A. 2010. Lithium expert Keith Evans’ take on lithium.Northern Miner23–29 August 96(27). Wilson, B. 2009. Recycling used lead acid batteries:
A model life cycle approach. Paper presented at the 13th Asian Battery Conference, International Secondary Lead Conference, 31 August, Macau, China.
Winter, M. and R. Brodd. 2004. What are batteries, fuel cells, and supercapacitors?Chemical Reviews
104(10): 4245–4269.
WLC (Western Lithium Corporation). 2010a. Project: Kings Valley, Nevada. www.westernlithium. com/project/. Accessed 29 March 2010. WLC. 2010b. Western Lithium Corp: Kings Valley
Project NI 43-101. Technical report: Preliminary assessment and economic evaluation Humboldt
County, Nevada. www.westernlithium.com/
static/userfiles/kvreports/Western_Lithium_ PAEE_Final-full_report.pdf. Accessed 25 March 2010.
Yaksic, A. and J. Tilton. 2009. Using the cumulative availability curve to assess the threat of mineral depletion: The case of lithium.Resources Policy
34(4): 185–194.
ZBY (Shenzhen ZBY Lithium Trading Co.). 2004. www.zabuye.com.cn/com/zby/main.php?sLAN= en. Accessed 21 March 2010.
About the Authors
Supporting Information
Additional supporting information may be found in the online version of this article:
Supporting Information S1:This supporting information provides detailed data and informa-tion regarding both the characterizainforma-tion of global lithium resources and lithium demand.