R E S E A R C H A R T I C L E
Open Access
Identifying lower limb specific and
generalised joint hypermobility in adults:
validation of the Lower Limb Assessment
Score
Kaitlin J. Meyer
1, Cliffton Chan
2*, Luke Hopper
3and Leslie L. Nicholson
2Abstract
Background:The Lower Limb Assessment Score (LLAS) has only been validated in a paediatric population. The aim of this study was to validate the use of the LLAS in an adult population by: i) evaluating its ability to discriminate between different extents of lower limb hypermobility, ii) establishing a cut-off score to identify lower limb hypermobility, and iii) determining if the LLAS is able to identify Generalised Joint Hypermobility (GJH).
Methods:Participants were recruited across three groups representing varying degrees of hypermobility. They were assessed using the LLAS, Beighton score and clinical opinion. Pearson’s correlation coefficient and MANOVA were used to assess between-group differences in the LLAS. The cut-off score was determined using median and inter-quartile ranges and the Receiver Operator Characteristic Curve. The ability of the LLAS to identify GJH was assessed using percent agreement with clinical opinion.
Results:One hundred twelve participants aged 18–40 years were recruited. The LLAS distinguished the control from the likely hypermobile and known hypermobile cohorts (bothp< 0.001), as well as the likely hypermobile from the known hypermobile cohort (p= 0.003). The LLAS cut-off score for identifying lower limb hypermobility was≥7/12 with a specificity of 86% and sensitivity of 68%. The LLAS accurately identified those with GJH with high percentage agreement compared to clinical opinion across all cohorts (69–98%).
Conclusions:The LLAS is a valid tool for identifying lower limb specific hypermobility and GJH in adults at a cut-off score of≥7/12. It demonstrates excellent specificity and moderate sensitivity, and discriminates well between extents of hypermobility.
Keywords:Joint hypermobility, Joint instability, Joint laxity, Lower extremity, Screening tool, Manual tests, Orthopaedic tests
Background
Hypermobility is present when a joint’s active or passive range exceeds that expected for an individual’s age, gen-der and ethnicity [1]. To be truly hypermobile, the range should, by definition, be in the uppermost 5% of the population [2]. Hypermobility may be localised to select joints or present in multiple body areas (typically greater than five sites) as Generalised Joint Hypermobility (GJH)
[1]. In addition to the influence of age, gender and ethni-city, joint specific hypermobility can be acquired through regular training or environmental factors such as trauma or surgery, and can also be inherited [1, 3].
The presence of GJH can be asymptomatic, or conversely be associated with local or widespread mus-culoskeletal problems [4, 5]. Hypermobile joints may be more prone to macrotrauma (such as dislocations or soft tissue injuries) resulting in acute pain and reduced func-tion, as well as microtrauma, which may predispose the individual to recurrent musculoskeletal pain and early joint degeneration [1]. Further, joint hypermobility can * Correspondence:[email protected]
2Discipline of Biomedical Science, Sydney Medical School, The University of
Sydney, Sydney, New South Wales, Australia
Full list of author information is available at the end of the article
be a marker of various heritable connective tissue disorders including but not limited to hypermobile Ehlers-Danlos Syndrome (hEDS), previously known as both Joint Hypermobility Syndrome (JHS) and Ehlers-Danlos Syndrome Hypermobility Type (EDS-HT) [1, 6]. However the assessments for joint hypermobility have largely focussed on paediatric populations and a paucity of evidence is available to direct clinical evaluation of such hypermobility in adult populations.
There is a wide variation in the reported prevalence of GJH and hEDS. The population prevalence of GJH is es-timated to be 10–30%, with significantly higher rates amongst children, females, and Asian and African racial groups [7, 8]. A reduction in joint mobility is also dem-onstrated with age [3]. A minimum estimate of 1 in 5000 has previously been proposed for EDS, of which hEDS is likely to account for 80–90% of cases [9, 10]. However, epidemiologic studies determining an accurate figure for population prevalence of the condition have yet to be performed [11].
The Beighton score is the most widely used tool for identifying GJH and plays a significant role in the diagnosis of hEDS [6, 12]. Despite its utility as a simple epidemiological clinical tool, the Beighton score is domi-nated by tests of the upper extremity, with knee exten-sion being the only lower limb specific incluexten-sion [13]. In addition it does not include several body sites that are commonly and symptomatically hypermobile, such as the hips, ankles, and first metatarsophalangeal joints [5]. Consequently, the Beighton score may not validly iden-tify generalised hypermobility when it presents predom-inantly in the lower limbs [13, 14].
The Lower Limb Assessment Score (LLAS) was de-signed to provide greater levels of detail on lower limb hy-permobility by assessing both accessory and physiological range of motion of the hip, knee, ankle and rear, mid and forefoot [13]. It has demonstrated excellent intra-rater and inter-rater reliability [13, 15], and a validated cut-off score of≥7/12 to identify lower limb hypermobility in children [13]. Ferrari and colleagues’concluding recommendations were to reproduce the study in older ages and different ethnicities to account for the wide variation in sensitivity and specificity across groups [13].
The primary aim of this study was to determine the validity of the LLAS in identifying lower limb hypermo-bility in an adult population. This was achieved by: i) evaluating the ability of the LLAS to discriminate be-tween normal mobile individuals, those with likely hy-permobility, and those with symptomatic hypermobility and ii) determining a cut-off score for the identification of lower limb hypermobility in adults when using the LLAS. The secondary aim of the study was to assess if the LLAS could be used to identify GJH, or only hyper-mobility of the lower limbs.
Methods
The method for this study was based on the protocol employed by Ferrari and colleagues (2005) who validated the LLAS clinical tool in a school-aged population (5– 16 years).
Participants
A total of 112 participants were recruited across three groups that were selected to represent varying levels of joint hypermobility. They comprised people with: i) nor-mal mobility (controls), ii) likely hypermobility and iii) known symptomatic hypermobility. The control group were healthy individuals who had not undertaken long-term training likely to affect joint mobility such as dance, gymnastics and acrobatics. These participants were re-cruited from the University of Sydney Cumberland Campus using flyers on noticeboards. The likely hypermo-bile group were comprised of elite dancers who were either studying dance at tertiary level with a majority of their training in ballet or who were currently dancing pro-fessionally (working as a dancer full-time). They were re-cruited via flyers, emails, and verbal invitations by a liaison officer from the Western Australian Academy of Performing Arts (Edith Cowan University) and the West Australian Ballet (Perth). The known hypermobile group were people with a prior medical diagnosis of JHS/EDS-HT under the previous nosology, and were recruited from Australian JHS/EDS-HT patient support groups on Facebook. For all groups, participants between the ages of 18–40 years of either gender were included. Volunteers older than 40 years were excluded due to the possibility that joint range could be affected by degenerative disease [3]. Participants across all groups were also excluded if diagnosed with another hereditary disorder of connective tissue (e.g. Marfan syndrome, osteogenesis imperfecta or other subtypes of EDS), or if they had a current ortho-paedic condition that might restrict normal range of motion.
All involvement was voluntary and participants provided written informed consent prior to data collection. Ethical approval was gained from the Sydney University [Protocol No. 2015/465] and Edith Cowan University [Protocol No. 13174] Human Research Ethics Committees.
Procedure
conducted by experienced physiotherapists (CC and LN) with over 30 years of combined clinical expertise in the domains of sports and musculoskeletal physiotherapy. Each participant was also categorised as hypermobile, borderline hypermobile or normal according to the clin-ical opinion of these physiotherapists. Given there re-mains some subjectivity in the sole use of the Beighton score for determining GJH, expert clinical opinion was used [1]. This clinical judgment was based on a compre-hensive history, the validated five-part historical hyper-mobility questionnaire [16], Beighton score, and the physical assessment of peripheral joints, not using the LLAS. Cut-off scores of≥4/9 and ≥5/9 on the Beighton score were used for men and women respectively in the control and known hypermobile cohorts [2]. A higher score of≥6/9 was considered GJH in the likely hypermo-bile cohort to account for the debated palms to floor measure in dancers [17, 18].
In addition, to determine the inter-rater reliability of the LLAS assessments the data from the first 20 control and known hypermobile participants assessed by both examiners were analysed. Given that the objective was to determine whether the LLAS is a robust measure for clinical practice, intra-rater reliability was not of major concern for this study. Furthermore, logistically it was not possible for many of the EDS-HT/JHS participants to return for a second testing session. The inter-rater re-liability was assessed using a two-way random absolute agreement, single measures intraclass correlation coeffi-cient. This revealed good to excellent inter-rater reliabil-ity (ICC2,1= 0.85, 95% CI = 0.67 to 0.94, p< 0.001) [19].
Given the small sample size, a Bland and Altman plot was also used similarly demonstrating no significant dif-ference between the results of the two examiners (limits of agreement =−2.94 and 2.44, 95% C.I. =−0.89 to 0.39, p= 0.43). Therefore, a single examiner was used to as-sess the remaining participants.
Statistical analysis
Statistical analysis of collected data was performed using SPSS Version 21 (IBM, NY, USA). The data were inspected for outliers and tested for normality using cal-culations of skewness. Descriptive statistical analysis was performed on age, gender and ethnicity. Pearson’s correlation coefficient was used to test the association between the LLAS and age. Pearson’s (r) correlations of
≤0.35 were considered to be weak, 0.36–0.67 moderate, and ≥0.68 strong [20]. A paired samples t-test was used to compare the LLAS scores obtained from the left and right limbs.
To test the null hypothesis of no significant difference being detectable between the three groups when using the LLAS, a multivariate analysis of variance (MAN-OVA) was performed, followed by post-hoc analyses
(Tukey HSD) to reveal where the significant differences occurred between the three groups. Effect sizes (partial η2
) greater than 0.01 were considered small differences, greater than 0.06 were considered medium differences, and values greater than 0.14 were representative of a large difference between groups [21].
The cut-off score to represent hypermobility when using the LLAS was estimated using median and inter-quartile ranges for each group. The sensitivity and speci-ficity for each level of the LLAS was tested using Receiver Operator Characteristic (ROC) curve analysis. A cut-off point that maximised specificity whilst opti-mising sensitivity was selected in order to minimise false positive errors [22]. The positive and negative likelihood ratios were calculated for the determined cut-off point, combining the utility of sensitivity and specificity [22]. Clinical opinion was used as the gold standard for this analysis, and the adults who were initially categorised as “borderline hypermobile,” were reclassified as normal [13]. This was based on the decision that if the clinician was uncertain of the classification, then the participant was less likely to be clinically hypermobile. Finally, the percent agreement between the LLAS (using the newly established cut-off point) and clinical opinion was calcu-lated to determine if it could be used to accurately pre-dict GJH. Clinical opinion was used as the gold standard for the identification of GJH.
For this study, a p-value <0.05 was considered signifi-cant. It was powered at 90% to minimise the possibility of type 2 errors, with α at 2.5% (type 1 error rate). The probability of GJH in the general population ranges from 15 to 30% [7, 8] so an average would be 15% (i.e. 0.15 pA), whilst the probability of hypermobility in the ex-perimental cohort (likely hypermobile and diagnosed JHS/EDS-HS groups combined) is high, with a conserva-tive estimate of 60% (i.e. 0.6 pB). Therefore, a minimum of 31 controls and 62 hypermobile participants (31 in likely and 31 in known) were needed to be able to reject the null hypothesis that the LLAS is equivocal in both groups at this level of power (PS Power and Sample Size Calculations Version 3.0, 2009).
Results
General participant demographics are summarised in Table 1. The participants across each cohort were pre-dominantly Caucasian, female and between 20 and 30 years of age. The known hypermobile group was sig-nificantly older than both the controls (p< 0.001) and the likely hypermobile group (p< 0.001). Weak associa-tions were found between the LLAS total score with age across the three groups (controls:r=−0.20; likely hyper-mobiles:r= 0.23; known hypermobiles:r=−0.05).
sided scores in the controls (L: 3.48 ± 1.95, R: 3.55 ± 1.91, p= 0.67) and the known hypermobile cohort (L: 6.91 ± 1.44, R: 6.91 ± 1.87, p= 1.0). A statistically signifi-cant difference in side-to-side LLAS was found in the likely hypermobile cohort (L: 5.43 ± 2.01, R: 6.15 ± 2.26, p= 0.01). Whilst there was a higher average score on the right compared to the left side in the side in this group, there was also a high correlation between the two scores (r= 0.73). Therefore, the LLAS was recorded as a score out of 12 for a randomly chosen limb, rather than the total of 24 for both limbs of all participants.
Using the LLAS to discriminate between extents of hypermobility
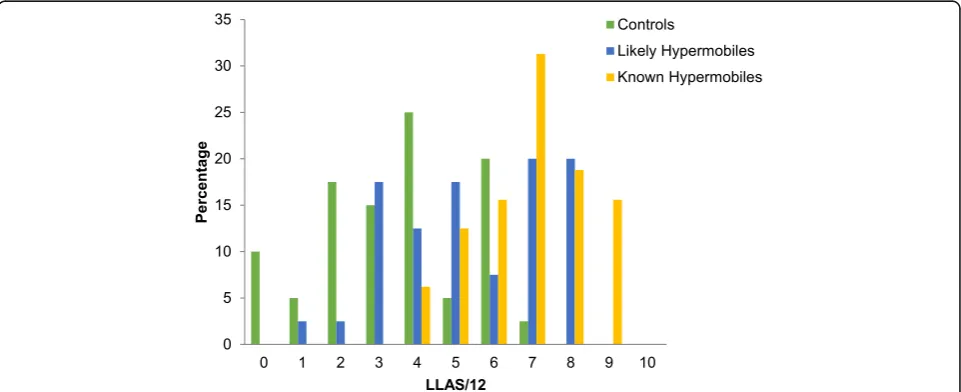
The percentage of adults at each level of the LLAS (total score/12) was examined (Fig. 1).
Observation of the distribution of scores in Fig. 1 suggests that the LLAS was able to discriminate clearly between all groups, with overlap mostly at scores of four and six out of 12. The MANOVA confirmed a sta-tistically significant difference between the three groups when assessed using the LLAS (Pillai’s Trace = 0.45, F(4.0, 218.0) = 15.8, p< 0.001). There was a large differ-ence between the groups with an effect size (partial η2) of 0.23. The post-hoc Tukey analysis revealed statisti-cally significant mean differences in LLAS scores between all three groups: comparing the controls to the likely hypermobile cohort (MD =−1.95, 95% CI =−2.93 to−0.97, p< 0.001) and to the known hypermobile co-hort (MD =−3.43, 95% CI =−4.47 to −2.39, p< 0.001), and comparing the likely hypermobile cohort to the known hypermobile cohort (MD =−1.48, 95% CI =
[image:4.595.56.543.99.266.2]−2.52 to−0.44,p= 0.003).
Table 1Demographic data of the entire cohort and the three subgroups
Total Controls Likely Hypermobiles Known Hypermobiles
n = 112 n = 40 n = 40 n = 32
Gender n (%)
Males 28 (25%) 11 (28%) 16 (40%) 1 (3%)
Females 84 (75%) 29 (72%) 24 (60%) 31 (97%)
Age (years)
Mean ± SD 24.3 ± 5.5 22.6 ± 2.8 22.6 ± 4.4 28.4 ± 6.9
Range 18–40 19–32 18–33 18–40
Ethnicity n (%)
Caucasian 88 (79%) 24 (60%) 34 (85%) 30 (94%)
Asian 16 (14%) 12 (30%) 4 (10%) 0 (0%)
Other 8 (7%) 4 (10%) 2 (5%) 2 (6%)
[image:4.595.58.539.518.714.2]Establishing a cut-off score for the identification of lower limb hypermobility
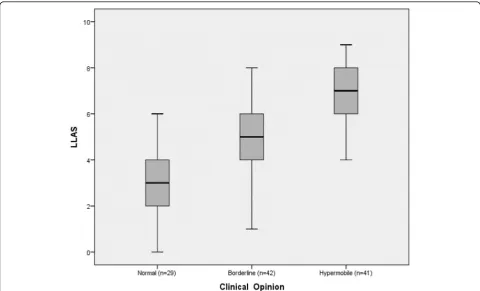
The median and interquartile ranges for the LLAS across the three clinically defined groups are repre-sented in Fig. 2. This figure suggests that a cut-off score of seven would clearly differentiate the controls from the known hypermobiles, with minimal overlap with the borderline individuals. This observation was confirmed by the ROC Curve presented in Fig. 3. The most suitable cut-off score was seven, where sensitiv-ity was 0.68 and specificsensitiv-ity was 0.86 (Table 2). This produced a positive likelihood ratio of 4.84 and a negative likelihood ratio of 0.37.
Given the predominance of Caucasian individuals in the study’s cohort, the same analysis was repeated for the 88 Caucasian participants. The most suitable cut-off score for this group was seven, with a sensitivity of 0.68 and specificity of 0.84.
Comparing the lower limb assessment score with clinical opinion: Can the LLAS and be used to accurately identify GJH?
Having identified a cut-off score of≥7/12 for the identifi-cation of lower limb hypermobility, the LLAS identified lower limb hypermobility in one out of the 40 (3%) con-trol, 16/40 (40%) likely hypermobile and 21/32 (66%)
known hypermobile participants. High levels of agreement were found between the LLAS and clinical opinion across each cohort, especially in the control group at 98% agree-ment, followed by the likely hypermobile group at 70% and the known hypermobile group at 69% (Table 3).
Discussion
The Lower Limb Assessment Score was found to be a valid and clinically useful screening and assessment tool, with excellent inter-rater reliability, for the identification of lower limb hypermobility and GJH. A cut-off point of
≥7/12 was determined to be the optimal classification point for the whole cohort, with a high specificity (86%), moderate sensitivity (68%) and positive and negative likelihood ratios of 4.84 and 0.37 respectively. The posi-tive likelihood ratio as it is greater than three, and the negative likelihood ratio as it is close to one-third, are likely to be useful in determining an accurate post-test probability of hypermobility when using the LLAS in a clinical setting [23].
With a predominance of Caucasian participants in the study and the potentially confounding effect of different ethnicities, the analysis was repeated with the 88 Caucasian participants. This revealed an identical cut-off score of≥7/ 12, with a high specificity (84%) and moderate sensitivity (68%). It is expected that a higher cut-off point may be
[image:5.595.57.538.421.712.2]found in a wholly non-Caucasian population due to the in-crease in hypermobility demonstrated in Asian and African racial groups [8]. However, these results remain applicable to an Australian population.
It was hypothesised that the cut-off score for adults would be lower than the≥7/12 proposed by Ferrari and colleagues (2005) for children due to the reduction of
[image:6.595.58.539.86.390.2]hypermobility seen with age [3, 13]. Whilst this study found an equal score to that of the pre-pubescent paedi-atric cohort, this may have been a reflection of the indi-viduals included in this study, with 75% female participants, over half being 22 years of age or younger. Given these factors are known to increase the prevalence of hypermobility [8, 24], this may have contributed to Fig. 3Receiver Operator Characteristic Curve for the Lower Limb Assessment Score
Table 2Sensitivity and 1-specificity for items of the Lower Limb Assessment Score
Cut-Off Sensitivity 1-Specificity
0 1.000 1.000
1 1.000 0.944
2 1.000 0.901
3 1.000 0.789
4 1.000 0.606
5 0.927 0.408
6 0.805 0.296
7a 0.683 0.141
8 0.390 0.042
9 0.122 0.000
10 0.000 0.000
a
The sensitivity and 1-specificity for the decided cut-off point of 7/12 are in bold for distinction
Table 3Cross tabulations of the agreement between the Lower Limb Assessment Score (LLAS) and clinical opinion across the three cohorts
Clinical Opinion
Cohort LLAS Not HMb HM Total
Controls Not HM 38 1 39
HM 0 1 1
Total 38 2 40
Likely HMPsa Not HM 22 2 24
HM 10 6 16
Total 32 8 40
Known HMPs Not HM 1 10 11
HM 0 21 21
Total 1 31 32
a
HMPs = hypermobile participants b
[image:6.595.57.290.546.714.2] [image:6.595.304.539.564.714.2]the higher cut-off score than expected in this younger female-dominant adult population. Although the partici-pants in this study were predominantly young adults with a mean age of 24.3 years, the cohort was intentionally restricted to participants younger than 40 to exclude greater hypomobility as a result of joint degeneration.
The LLAS, as a continuous measure, was able to dis-criminate between varying extents of hypermobility. No studies have investigated this in adults, but the findings in this study are consistent with the results found when using the LLAS in a paediatric population [13]. Al-though only weak associations were found between the LLAS and age, the control cohort demonstrated the expected reduction in hypermobility seen with older ages whilst the likely hypermobile cohort demonstrated an increase in hypermobility. This is possibly a result of acquired lower limb hypermobility from classical dance training amongst this cohort [17, 25, 26]. The known hypermobile cohort, despite being significantly older than both the controls and the likely hypermobiles, dem-onstrated almost no association between the LLAS and age. This suggests less “stiffening” with age when com-pared to the controls, however currently there is limited prospective research into the natural history of hyper-mobility in individuals for comparison [1].
The final comparison of the LLAS as a dichotomous screening tool with clinical opinion demonstrated its usefulness in identifying GJH, and not solely hypermo-bility of the lower limb. A positive LLAS appeared to re-flect correct identification of GJH, which was supported by the high level of agreement demonstrated in the con-trol cohort (98%), and the good level of agreement in the likely hypermobile cohort (70%) and in the known hypermobile cohort (69%). In the likely hypermobile group, 10 participants had a positive LLAS which was not reflected by the clinical opinion. This was unsurpris-ing given the potential impact of classical dance trainunsurpris-ing on hypermobility of the lower limb, which was confirmed by high LLAS scores amongst this cohort [17, 25, 26]. In the known hypermobile group, 10 cases of GJH identified by clinical opinion were not identified by the LLAS. It is possible that these individuals presented with hypermobil-ity predominantly of the upper limbs which would go un-detected using the LLAS. This supports the importance of incorporating clinical judgement into the identification of GJH, particularly in the hEDS cohort, rather than using the results of a single assessment tool [6].
This study supports the use of the LLAS as a clinical screening and assessment tool in aiding the identifica-tion of lower limb hypermobility and GJH at a cut-off point ≥7/12. The clinical utility of this tool over the Beighton score is evident when patients present with predominantly lower limb instability symptoms or are
participating in activities that are likely to involve physiological or non-physiological movements to the ends of joint range. It allows identification of hypermo-bility in lower limb joints commonly predisposed to in-jury and in directions unassessed by the Beighton score. [5]. An example of the clinical utility of the LLAS in tar-geting prevention and management is where a ballet dancer might demonstrate limited external rotation at the hip, executing turn-out primarily from knees hyper-mobile in the transverse plane. The clinical cognisant of this will consider management directed at dissipating ro-tational forces throughout the limb to reduce injury risk at the knee. The comprehensive nature of the LLAS scores can then be utilised to identify GJH, prompting further assessment of other joints of the body if re-quired. Although the 12 tests take longer to complete than the more commonly used Beighton score, the sig-nificant correlation between the left and right sided scores in the control and known hypermobile cohorts indicate that the LLAS could be administered on a single limb to maximise time efficiency. However, the side-to-side differences in our dancer cohort suggest the LLAS should still be performed on both sides for this population.
Limitations and directions for future research
Difficulties arise when validating the LLAS due to the lack of a gold standard for GJH classification. While the Beighton score has gained international acceptance for the identification of GJH, the variation in cut-off scores used and the lack of a standardised protocol limits the comparability across reliability studies [27, 28]. Clinical opinion was therefore used in this study as the most ap-propriate alternative for comparison, however future research into a standardised investigative procedure for GJH is warranted.
The generalisability of the cut-off score in this study is limited to a predominantly young female and Caucasian adult population. A higher proportion of male partici-pants and a higher mean age would also be useful to more accurately reflect the older adult population. Additionally, this study was not designed to investigate the LLAS cut-off scores in differing ethnicities. There-fore investigation into the use of the LLAS across vary-ing racial groups would be beneficial. Further, whilst the recruitment across three groups in this study was not equal as intended, the sample size allowed the study to remain sufficiently powered to detect between group differences.
musculoskeletal physiotherapists, the inter-rater reliabil-ity of the LLAS when implemented by less experienced assessors should be investigated.
Conclusions
In an adult population, the LLAS is a valid tool for iden-tifying lower limb specific hypermobility and GJH at a cut-off point of ≥7/12. It demonstrates excellent specifi-city, moderate sensitivity, and discriminates well be-tween extents of hypermobility. The increased level of detail on lower limb specific hypermobility provided by the LLAS can assist in the development of targeted pre-vention and management strategies for at-risk popula-tions such as dancers or gymnasts, as well as for those with symptomatic hypermobility, by highlighting the problematic areas for the individual and allowing those to be addressed accordingly. This identification may as-sist in both the prevention as well as appropriate treat-ment of hypermobility related injuries in the lower limb. However, it is recommended that clinical judgment is also incorporated into the identification of GJH, particu-larly within the hEDS cohorts.
Additional files
Additional file 1:The Lower Limb Assessment Score. This file contains the name, patient and therapist instructions and criteria for each of the 12 tests of the Lower Limb Assessment score as described by the original authors that developed this tool. (DOCX 17 kb)
Additional file 2:The Beighton Score. This file contains the standardised criteria of the five tests involved in scoring of the Beighton in this study. (DOCX 19 kb)
Abbreviations
EDS-HT:Ehlers-Danlos Syndrome Hypermobility Type; GJH: Generalised Joint Hypermobility; hEDS: hypermobile Ehlers-Danlos Synrome; JHS: Joint Hypermobility Syndrome; JHS/EDS-HT: Joint Hypermobility Syndrome/Ehlers-Danlos Syndrome Hypermobility Type; LLAS: Lower Limb Assessment Score; MANOVA: Multivariate analysis of variances; ROC: Receiver operator characteristic
Acknowledgments
The authors would like to thank all the volunteers for their participation, in particular all the JHS/EDS-HT participants and the dancers from the Western Australia Academy of Performing Arts and the West Australia Ballet. Special thanks to Ms. Jenny Woods, Physiotherapist for the West Australian Ballet, and Dr. Verity Pacey from the Macquarie University for their assistance in recruitment and support.
Funding
This work was supported by funding from the Discipline of Biomedical Science, Sydney Medical School, The University of Sydney [grant number 2015].
Availability of data and materials
The datasets generated during and/or analysed during the current study are available from the corresponding author on reasonable request.
Authors’contributions
CC and LN conceived the study concept and contributed to the design of the study, the collection of data, and statistical analysis. LH was involved in the collection of data. KM was involved with the data collection and statistical analysis. All authors participated in data interpretation, and writing and revisions of the manuscript. All authors read and approved the final manuscript.
Ethics approval and consent to participate
All involvement was voluntary and participants provided written informed consent prior to data collection. Ethical approval was gained from the Sydney University [Protocol No. 2015/465] and Edith Cowan University [Protocol No. 13174] Human Research Ethics Committees.
Consent for publication Not applicable
Competing interests
The authors declare that they have no competing interests.
Publisher’s Note
Springer Nature remains neutral with regard to jurisdictional claims in published maps and institutional affiliations.
Author details
1
Discipline of Physiotherapy, Faculty of Health Sciences, The University of Sydney, Sydney, New South Wales, Australia.2Discipline of Biomedical
Science, Sydney Medical School, The University of Sydney, Sydney, New South Wales, Australia.3Western Australian Academy of Performing Arts,
Edith Cowan University, Perth, Western Australia, Australia.
Received: 15 June 2017 Accepted: 24 November 2017
References
1. Castori M, et al. A framework for the classification of joint hypermobility and related conditions. Am J Med Genet C Semin Med Genet. 2017;175(1):148–57. 2. Singh H, Baldwin J, Nicholson L, Chan C, Burns J, Hiller C. Beighton scores
and cut-offs across the lifespan: A cross-sectional study in an Australian population. Rheumatology (Oxford). 2017 Nov 1;56(11):1857–64. doi: 10.1093/rheumatology/kex043.
3. Beighton P, Solomon L, Soskolne CL. Articular mobility in an African population. Ann Rheum Dis. 1973;32(5):413–8.
4. Grahame R. What is the joint hypermobility syndrome? JHS from cradle to grave. In: Hakim AJ, Keer R, Grahame R, editors. In: Hypermobility, fibromyalgia and chronic pain: Elsevier; 2010. p. 19–35.
5. Hakim AJ, Keer R, Grahame R. The heritable disorders of connective tissue: epidemiology, nosology and clinical features. Hypermobility, fibromyalgia, and chronic pain. In: Hakim AJ, Keer R, Grahame R, editors. In:
Hypermobility, fibromyalgia and chronic pain: Elsevier; 2010. p. 3–15. 6. Malfait F, et al. The 2017 international classification of the Ehlers-Danlos
syndromes. Am J Med Genet C Semin Med Genet. 2017;175(1):8–26. 7. Beighton P, Grahame R, Bird HA. Hypermobility of joints. Vol 4th. London:
Springer; 2012.
8. Hakim AJ, Sahota A. Joint hypermobility and skin elasticity: the hereditary disorders of connective tissue. Clin Dermatol. 2006;24(6):521–33. 9. Tinkle B, et al. Hypermobile Ehlers-Danlos syndrome (a.K.A. Ehlers-Danlos
syndrome type III and Ehlers-Danlos syndrome hypermobility type): clinical description and natural history. Am J Med Genet C Semin Med Genet. 2017; 175(1):48–69.
10. Steinmann B, Royce PM, Superti-Furga A. The Ehlers-Danlos syndrome. In: connective tissue and its heritable disorders. New York: Wiley-Liss; 2002. 11. Castori M. Joint hypermobility syndrome (a.K.A. Ehlers-Danlos syndrome, hypermobility type): an updated critique. G Ital Dermatol Venereol. 2013; 148(1):13–36.
12. Juul-Kristensen B, et al. Measurement properties of clinical assessment methods for classifying generalized joint hypermobility—a systematic review. Am J med gen C Semin. Med Genet. 2017;175(1):116–47. 13. Ferrari J, et al. Joint hypermobility: the use of a new assessment tool to
measure lower limb hypermobility. Clin Exp Rheumatol. 2005;23(3):413. 14. Smits-Engelsman B, Klerks M, Kirby A. Beighton score: a valid measure for
generalized hypermobility in children. J Pediatr. 2011;158(1):119–23. 15. Evans AM, Rome K, Peet L. The foot posture index, ankle lunge test,
Beighton scale and the lower limb assessment score in healthy children: a reliability study. J Foot Ankle Res. 2012;5(1):1.
17. Gannon LM, Bird HA. The quantification of joint laxity in dancers and gymnasts. J Sports Sci. 1999;17(9):743–50.
18. Klemp P, Learmonth ID. Hypermobility and injuries in a professional ballet company. Br J Sports Med. 1984;18(3):143–8.
19. Cicchetti DV. Guidelines, criteria, and rules of thumb for evaluating normed and standardized assessment instruments in psychology. Psychol assessment. 1994;6(4):284.
20. Taylor R. Interpretation of the correlation coefficient: a basic review. J Diagn Med Sonogr. 1990;6(1):35–9.
21. Cohen J. Statistical power analysis for the behavioral sciences. Vol. 2nd. Hillsdale, NJ: L. Erlbaum Associates; 1988.
22. Peat J, Barton B. Medical statistics: a guide to SPSS, data analysis and critical appraisal. Vol. 2nd. Hoboken: Wiley; 2014.
23. Sackett DL. Evidence based medicine: how to practice and teach EBM. Vol. 2nd. Edinburgh:Churchill Livingstone; 2000.
24. Castori M. Ehlers-Danlos syndrome, hypermobility type: an underdiagnosed hereditary connective tissue disorder with Mucocutaneous, articular, and systemic manifestations. ISRN Dermatol. 2012;
25. Grahame R, Jenkins JM. Joint hypermobility–asset or liability? A study of joint mobility in ballet dancers. Ann Rheum Dis. 1972;31(2):109–11. 26. Hamilton WG, Hamilton LH, Marshall P, Molnar M. A profile of the
musculoskeletal characteristics of elite professional ballet dancers. Am J Sports Med. 1992;20(3):267–73.
27. Remvig L, Jensen DV, Ward RC. Are diagnostic criteria for general joint hypermobility and benign joint hypermobility syndrome based on reproducible and valid tests? A review of the literature. J Rheumatol. 2007; 34(4):798–803.
28. Junge T, et al. Inter-tester reproducibility and inter-method agreement of two variations of the Beighton test for determining generalised joint hypermobility in primary school children. BMC Pediatr. 2013;13:214.
• We accept pre-submission inquiries
• Our selector tool helps you to find the most relevant journal
• We provide round the clock customer support
• Convenient online submission
• Thorough peer review
• Inclusion in PubMed and all major indexing services
• Maximum visibility for your research
Submit your manuscript at www.biomedcentral.com/submit