PREDICTIVE ABILITY OF RELATIVE SOLVENCY RATIO FOR
ASSESSING THE PROBABILITY OF DEFAULT IN INDIAN TEXTILE
FIRMS
Ms. Gayatri Sanjay Pai
PhD Research Scholar – Dr. D.Y. Patil Vidyapeeth,Pimpri, Pune Visiting faculty, Sri Balaji Society, Tathawade, Pune, Maharashtra, India
&
Dr. Leena Dam
Associate Professor, Research Guide, - Dr. D. Y. Patil Vidyapeeth,Global Business School & Research Centre, Mumbai – Bangalore Highway, Pune, Maharashtra, India
ABSTRACT
Indian textile industry is one of the biggest in the world with a huge raw material and textiles
manufacturing base. It contributes to 14% of India’smanufacturing value-addition.
But it is also burdened with many problems like outstanding credit and high level of bank
loans. It is facing tough competition from countries like Bangladesh and Vietnam, resulting
in lowering the demand along with inconsistent profitability and below average returns. This
paper attempts to assess the financial distress among Indian textile firms. Enyi’s RSR
model,a solvency management model,provides the framework for gauging the financial
performance of firms using parameters like operational breakeven point, working capital
required at operational breakeven point and possibility of insolvency in terms of production
cycles.The paper applies the model on select 11 textile firms which were given a default
rating by CRISIL in 2016. The results clearly indicate that Enyi’s RSR model works
effectively and performs well in identifying default and also in predicting prior period
distress leading to default state.
Keywords: Textile Industry, Enyi‟s RSR model, Current Ratio, Distress.
International Research Journal of Management and Commerce
ISSN: (2348-9766) Impact Factor- 5.564, Volume 4, Issue 12, December 2017 Website- www.aarf.asia, Email : [email protected] , [email protected]
1. Introduction
Solvency is the ability of the firm to stay afloat (i.e. the ability to stay liquid) meeting every financial obligation as they fall due without hindrance and the need to borrow further. Being solvent in the short term would need the firm to have enough liquid assets to meet its short term obligations i.e. enough current assets to meet its current liabilities whenever they are due.
Working capital management becomes an important element of corporate finance as it influences a firm‟s profitability as well as liquidity. Therefore to remain solvent or to avoid
defaulting there must be sufficient working capital to run the day today operations.
However Enyi (2005) opines that there is more to working capital management than just meeting the short term transactional objectives because business solvency revolves primarily around the working capital base of the organization. Liquidity is the main concept & purpose of any working capital management strategy. For survival in the long run, efficient working capital management is an important factor. A profitable business may fail if it does not have adequate cashflow to meet its liabilities.
Assessing the solvency position of a company is of prime importance for all the stakeholders in the company right from the management to the investors and lenders of finance. The management has to constantly work towards maintaining sufficient funds to pay the obligations as they fall due at the same time also ensuring that no finance availed remains idle thereby ensuring that work towards achieving the goal of wealth maximization. The lenders definitely would want to ensure that they not only be getting sufficient returns on their investment but also ensure that the company is liquid enough to pay them their dues. A need is there for an appropriate solvency testing model which would rightly indicate any distress signals. This would help the stakeholders protect their investment and also take some remedial measures to avoid a situation of eventual liquidation or bankruptcy.
2. Indian textile scenario
The textile sector ranks next to agriculture and is one of the oldest industries.Textile plays a major role in Indian economy.It contributed 14% of industrial production, 9% of excise collections, 18% of employment in industrial sector, nearly 15% to the country„s total export earnings and 4% to the gross domestic product.
The Indian textile industry is currently estimated at around US hundred and $20 billion is expected to reach US $230 billion by 2020.
The size of India‟s textile market in 2016 was around US$ 137 billion, which is expected to
touch US$ 226 billion market by 2023, growing at a CAGR of 8.7 per cent between 2009-2023
As of June 2017, the central government had planned to finalize and launch the new textile policy in the next three months. The policy aimed to achieve US$ 300 billion worth of textile exports by 2024-25 and create an additional 35 million jobs.
The apparel market in India is estimated to grow at a Compound Annual Growth Rate
(CAGR) of 11.8 per cent to reach US$ 180 billion by 2025.1
Along with its significant presence, Indian textile industry is also facing some hurdles too.
In recent years, countries such as Bangladesh and Vietnam have been attracting the export
consignments away from India, giving stiff competition to the Indian textile industry.
The financial stability report released by RBI biannually points out that 6.9% of the total
stressed loans were contributed by textile sector.2
As per RBI bulletin dated October 10 2017, Industry-wise Deployment of Gross Bank Credit report showed that there is a negative 0.7% year on year growth and the outstanding credit for the sector as on August 18th 2017was Rs.1932 billion.
Textile sector carries Rs.203900 crore of bank loans is currently reeling under high stress
due to lowering of demand along with inconsistent profitability and below average returns.3
Among the textile entrepreneurs operating spinning mills are in the process of debt
restructuring package, as this segment is highly capital intensive and have more exposure to term loans.
3. Literature Review
In the last 50 years much academic and professional research on this subject has been done in the west especially in industrially developed countries. These do provide various models to identify failing firms but very few studies have been conducted in developing countries. There are also a number of careful research studies using data from United States firms that provide various methods to identify failing firms.
1 Ministry of Textiles, Indian Textile Journal, Department of Industrial Policy and Promotion, Press Information Bureau, Union Budget 2017-18)
Enyi, Patrick Enyi (2005) studied the relative solvency levels of 25 sample firms. The findings of the study revealed that the gap created by the inability of traditional liquidity measurement of solvency level like current ratio, quick ratio and other solvency ratios to effectively determine the proper size or volume of working capital is fulfilled by the relative solvency ratio model. In addition the study revealed that firms with adequate working capital related to their operational size performed better than firms which have less working capital relative to their operational size.
Enyi, Patrick Enyi(2006) analyzed financial data extracted from the annual reports of 7 quoted companies, using the three models and the results compared to showing the strengths and weaknesses of each.
Adeleh et al (2014) examined the relationship between firm‟s profitability and its working capital solvency level on 120 manufacturing firms listed on Tehran Stock Exchange market for the period of 8 years from 2003 to 2010. The working capital adequacy was measured by calculating the Relative Solvency Ratio and the measure of profitability was return on assets. The study concluded that firms with adequate working capital achieved significant better performance than those firms which have, less working capital in relation to their operational sizes
Hassan Ghodrati and Jaber Ghanbari (2014) studied the financial data of 68 firms listed in Tehran stock exchange. They suggested that better Working Capital Management in terms of decreasing the period of debt payment, period of circulation of inventory and the period of cash conversion may increase the period of profitability.
Huijuan Lin(2015) provided empirical evidence to support his hypothesis that the use of Altman‟s Z-score in UK is out of date and need to be renewed to improve its accuracy from a sample of 50 samples within the UK. The study showed that Altman‟s Z-score had a poor
predictive ability when applied to consumer goods in UK. The renewed Z-score model excluding Sales to total asset ratio out-performed the original Z-score model by increased 24% accuracy in bankruptcy prediction of consumer goods.
Massimiliano Celli(2015) examined a sample of 102 industrial companies, quoted on the Italian Stock Exchange in the period 1995-2013 and 51 companies had their shares permanently suspended or delisted because of a default. The study found that the Z-score worked effectively and performed well in predicting failures of Italian firms, although with a slightly lower degree of reliability when applied to Anglo-Saxon companies.
ratios. Thestudy examined the combined effect of various financial ratios with the help of Multiple Discriminate Analysis (MDA)
Gururaj and Sandanand (2014)in their paper attempted at measuring and predicting the financial health of Indian textile firms by applying Altman‟s Z score model on a select sample of five firms for a period of ten years. The paper found that Altman‟s Z score could
correctly assess and segregate financially distressed companies from the healthy ones.
Ayyappan et al(2014)in their paper evaluated the financial performance of three Indian textile firms for a period of twelve years. They calculated the share of debtors in total current assets and compared the actual values to the trend values of sundry debtors.
Sathya and Umarani(2015)analyzed the overall financial health of five selected spinning mills in Coimbatore city for five years in their paper.The study used different ratios as parameters for evaluating the liquidity position ( current ratio, quick ratio), long term solvency( debt equity ratio), profitability position ( gross profit ratio, net profit, operating profit ratio, return on equity ratio) and efficiency of the management in managing the current assets( inventory ratio and debtors turnover ratio). The findings showed that the textile mills needed to follow a fixed policy for their debtors and also reduce their operating costs.
4. Need for the study
The research in India have used different bankruptcy prediction models to assess financial distress in Indian firms. It‟s observed that most of the papers have used multiple discriminant analysis and neural networks.These models do not specifically help the management to assess the distress in terms of operating cycles required to survive, but just give the default status after the occurrence of default.
There is need for research for testing solvency prediction models that can give prior indication of distress in such terms that the management can use the indicators to better their liquidity position. This would definitely help the management avert the direction of financial distress leading towards liquidation to a better profitable position.
There is also a dearth of research in using different solvency prediction models for assessing the financial distress in Indian textile industry which play an important role in providing employment and contributing to GDP.
5. Objectives of the study
1. To analyse the efficacy of Enyi‟s RSR model vis a vis Current Ratio to identify financial distress
2. To validate the predictive ability of Enyi‟s RSR to accurately project prior period financial distress before actual default state.
6. Research Design
This study considers the list of Indian textiles companies given „Default” rating by CRISIL. CRISIL gives the rating the rating „D‟ that is default for companies which have not serviced a
rated debt obligation in full by the due date. The total number of defaulters were 96 companies
A thorough scanning of CMIE Prowess Database reveals that financial data are available only for 11 companies for the year of default 2016 and for a period of two years prior to default i.e. 2014 & 2015. Further the study specifically studied these 11 textile companies to investigate the practical application of the Enyi‟s RSR to predict distress and required
liquidity to survive.
The study applies twosolvency management models on select textile firms to assess which model gives a better indication and prediction of distress in these firms. Thus attempting to show the strengths and weakness of each of the measures.
The two measures for solvency used in the study are Current Ratio, popularly measure of liquidity and Enyi‟sRelative Solvency Ratio.
i. Measure description-Current Ratio
Current ratio is the ratio of the current assets and current liabilities of a firm. It is one of the most commonly used measure of testing the liquidity of a firm.
A current ratio of 2:1 is an ideal ratio which is aimed by all finance managers. It indicates that current assets are twice that of the current liabilities i.e. short term obligations of the firm. Thus even if the current assets reduce over a period of time it will still be sufficient to meet the current liabilities.
A minimum current ratio of 1:1 is recommended; if not the ideal 2:1 as that would result in holding at least that quantum of current assets which would cover the current liabilities.
Current ratio is also an indicator of the working capital required by the firm, as working capital is the excess of current assets over the current liabilities.
ii. Model Description - Enyi’s Relative Solvency Ratio
Elements of an Enyi’s Relative solvency ratio model
The calculation of Enyi‟s Relative Solvency Ratio (RSR) is based entirely on numbers from the company's financial reports. For calculation of RSR another cardinal tool of operational breakeven point needs to be calculated.
Operational breakeven point(OBEP) is defined as the point or stage of activities where cumulative contribution margin on recovered production output equals the total cumulative production costs and losses of the learning periods.(Enyi 2005) In short it is the point where the firm has made enough profits to cover all attributable costs. Operation breakeven point is measured in number of production or activity cycles.
OBEP = (1 + m) / 2m
Where m = markup ratio
OBEP = Operation breakeven point
Mark up ratio (m) is measured by dividing the profit before tax (PBT) with the total operating cost (TOC)
m = PBT
TOC
Total operating cost (TOC) is measured by deducting the profit before tax from the total sales.
TOC = Total Sales - PBT
Working capital required at operational breakeven point (WCR). It is the working capital estimate relative to the competence and size of the organization‟s operations.
WCR = TOC X OBEP
52 weeks
Relative solvency ratio (RSR). It compares the available working capital with the required working capital it can be used to predict to the likelihood of insolvency and the possible stage that insolvency is expected to occur.
RSR = Available Working Capital
WCR at OBEP
Chance of insolvency(COI)
COI = 1 - RSR
Any value below zero indicates a highly solvent company.
Values between 0 and 1 indicate the degree of insolvency of the firm.
Value of 1 indicates a bankrupt company while value of zero indicates a healthy company.
Possible stage of insolvency (POI)
Possible stage of insolvency (POI) expresses the number of production cycles to which the present stock of working capital can be used by the firm before it is completely exhausted assuming no other fund comes by way of revenue or loan during the period.
7. Result and Discussion
Applying the Enyi‟s RSR model and comparing the results with the commonly used Current
ratioto test the liquidity and solvency positionbrought up the following observations:
Arvind Ltd
The current ratio clearly shows a decreasing trend from 1.115 to 1.033 which indicates that the company does not have just enough current assets to meet its current liabilities. The current ratio does not show any possibility of default happening as a current ratio of 1:1 is also acceptable.
Enyi‟s RSR give us a better indication of default in the year of default i.e.2016 as rated by
CRISIL. Also it shows signs of distress even two years prior to the same.With its markup policy of 10% it needs the working capital of Rs.5808.8 million to achieve breakeven and also needs the same to cover six operation cycles or six weeks of production but it has a working capital of only Rs.881.7 million which when compared shows that there is a possible stage of insolvency after one production cycle if no further working capital is infused in terms of external finance where as in 2014 it shows better position of three production cycles but it is consistently deteriorating in 2015 and 2016.These indicators would have helped banks and management to take a preventive measures to avoid a default status.
KG Denim Limited
The financial position of K G Denim shows marginal improvement over the years from being insolvent with a chance of insolvency at 1.06 in 2014 to a better 0.98 in 2016.Although it is not a good solvent position but the Enyi‟s RSR model does show the default or distress position but showed an insolvency status for 2014 and 2015.
The management has done considerable efforts to turnaround the financial position from insolvent as per Enyi‟s RSR to an distress position in 2016.The current ratio has also improved marginally showing better liquidity position in 2016 then 2014.
Lakshmi Mills Company Limited
The chance of insolvency is clearly showing a downward trend in the liquidity position from -0.852 opposite of 0.687 which is alarming. The same is also reflected in its OBEP increasing from 11 cycles to 68 cycles.This is in tune with the CRISIL rating of default. The current ratio shows a very contrary image of an increase from a ratio of 1.988 in 2014 to 2.015 in 2016.This analysis brings out the inherent drawback of using current ratio; popularly used as an indicator of liquidity position of the firm. Current ratio can be manipulated to give a better indication of the solvency position. Enyi‟s RSR model overcomes these drawbacks.
Mohit Industries Limited
An analysis of the financials of Mohit Industries using Enyi‟s RSR model shows that the firm is in distress zone agreeing with CRISIL rating of „D‟. Enyi‟s RSRis showing improvement
in the liquidity of the company but indicates that the company is still in the distress zone and could default on its obligation as even OBEP requirement reducing from 14.5 cycles in 2014 to 12 cycles in 2016. The current ratio also indicates an improvement in its liquidity position.
Pasupati Spinning & Wvg. Mills Ltd
The chance of insolvency (COI) of Pasupati Spinning is consistently decreasing and had indicated an insolvent position for the company right from 2014 to 2016.The OBEP is an enormous number of 179 to 430 operating cycles.The RSR shows clearly that the available working capital is largely insufficient need to meet these OBEP cycles requirement.The current ratio also shows a very weak liquidity position of less than one.But it does not give a prior indication as it remains the same for all the three years showing distress.
Pioneer embroideries Ltd.
Salona Cotspin Ltd.
The company is shown in distress position by Enyi‟s RSR model.Rather progressively heading to default status from 2014 to 2016.Its financial position does show a marginal improvement in 2015 but again falling down in 2016.The current ratio shows rather a comfortable liquidity ratio of 1.47 to 1.71 to 1.53 showing a similar trend of improvement in 2015.But it does not indicate any distress in its solvency position.
Sri Lakshmi Saraswathi Textiles (Arni) Ltd
Sri Lakshmi Saraswathi is heading steadily from a distress position to insolvent position as depicted by the chance of insolvency of Enyi‟s RSR model.The model showed early warnings of distress right from 2014 with a chance of insolvency of 0.886 which deteriorated to 1.75 in 2015.Its markup rate is going down from a positive 3% to a negative 3% indicating that its sales are falling down not able to cover its operating cost. The same analysis is also depicted by the current ratio falling from 1.2 to 1.03
Suryavanshi Spinning Mills Ltd
For Suryavanshi spinning Mills Ltd its current ratio is showing distress position at 0.72 in 2016.It is seen that the Enyi‟s RSR model showed that the company was in an insolvency crisis in 2014 and 2015 with and chance of insolvency of 1.011 and 1.003 which is marginally improved to 0.758 in 2016.
But the RSR has improved from a negative 0.01 in 2014 to positive 0.24 in 2016 showing that the management has managed to raise working capital to meet its working capital requirement at OBEP.
Tamilnadu Jai Bharath Mills Ltd
Welspun India Ltd
Applying Enyi‟s RSR model to Welspun India Ltd.‟s financial analysis shows that an improvement in its liquidity position as itschance of insolvency is brought down from 1.04 in 2014 to a hopeful 0.214.The markup rate has also increased from 1.2% to 2%. The OPEB has also reduced from a massive 40.94 cycles to 2.984 cycles. This clearly shows that the management is working towards improving its liquidity position.The same is evident with current ratio improving from 0.92 in 2014 to 1.123 in 2016.
8. Conclusion
After applying Enyi‟s RSR model along with Current ratio on the sample of 11 textile firms, it clearly showed that Enyi‟s RSR was more relevant and effective than Current Ratio in
identifying distress firms and also predicting the upcoming insolvency status one and two years prior to default.
Enyi‟s RSR model gives in quantitative terms as to how many operating cycles the firm can
survive with its available working capital, given the current profit mark up on cost.
It propagates thatcompanies with adequate working capital when compared to the available working capital as per their operational size can give better indication of distress even 2 years prior to default status as is evident by the Enyi‟s RSR results.
Current ratio has an inherent drawback of giving only an overall view of the liquidity position. Further investigation is warranted to understand the actual components of the current assets to give a clearer picture of the solvency position of the firms.This is highlighted through the analysis ofLakshmi Mills Co. Ltd. &Pioneer Embroideries Ltd.In these companies the current ratio showed a contradictory picture of solvency whereas both CRISIL and Enyi‟s RSR indicated default.
As per Enyi‟s RSR model, all the companies under the study showed distress signals prior to
actual default in 2016.
The financial managers with use Enyi‟s RSR model may turnaround any financial distress to a solvent position with the help of the different liquidity parameters like the Operational Breakeven point and Working capital required to maintain the same for achieving target markup.
using Enyi‟s RSR model before advancing loans and also use the same to keep a track of the
liquidity position.
Indian textile firms can be revived if they put in efforts to increase their liquidity by trying to get the adequate working capital required to achieve the operational break even at the given markup rate adopted by them. Ensuring their survival in the long run.
Enyi‟s RSR has proved to be a precious tool in the detection of company operating
andfinancial difficulties up to 2 years before the default. The model can to be considered as a “warning”toolthat is fairly accurate (and easy to use) whenapplied to Indian textile firms.
References
Adeleh, A., Hamidreza Vakilifard, & Enyi, P. E. (2014). Working Caital Solvency
Level and Profitability - Evidence from Iran. SCIJOUR, Iranian Journal of Business and Economics, 1, Issue 4. Retrieved from http://www.scijour.com/ijbe
Altman, E. (1968). Financial Ratios, Discriminant Analysis and Prediction of Corporate
Bankruptcy. Journal of Finance, 23, 189-209.
Barki, G., & Halageri, S. (Jan 2015). Analysis of Financial Strength of select firms from
Indian Textiles Industry using Altman's "Z" Score Analysis. Acme Intellects Journal of Research in Management, Social Sciences & Technology, 5(ISSN 2320 - 2793).
Enyi , P. E. (2006). A Comparitive Analysis Of the Effectiveness Of three Solvency Management Models. Retrieved from http://ssrn.com/abstract=1138357
Gururraj, B., & Sadanand, H. (2014). Analysis of Financial Strenght of select firms
from Indian Textiles Industry using Altman's ' Z Score Analysis'. Acme Intellects Journal of Research in Management, Social Sciences & Technology, 5(5).
Harsh, Vineet, & Kaur. (n.d.). Efficient Management Of Working Capital:A Study Of Healthcare Sector In India. JEL Classification: G31.
Huijuan, L. (2015). Default Prediction Model for SME's: Evidence from UK Market
Using Financial Ratios. International Journal of Business and Management, 10(2). doi:10.5539/ijbm.v10n2p81
M.S.Ramaratnam, & R.Jayaraman. (n.d.). A Study On Measuring The Financial
Massimiliano, C. (2015). Can Z-Score Model Predict Listed Companies‟ Failures in Italy? An empirical test. International Journal of Business and Management, 10(3). doi:10.5539/ijbm.v10n3p57
S.Ayyappan, D., Sultana, S. M., & Sakthivadivel, M. (June-2014). Financial
Performance Analysis of Selected Textile Industries inIndia. International Journal of Engineering and Management Research, 314-318.
S.Satya, & Dr.R.Umarani. (2015). A study on financail performance analysis of spinning mills of Coimbatore City. International Journal of Scientific research and mangement (IJSRM), 3543-3548. Retrieved from www.ijsrm.in ISSN(e):2321-3418
Sarbapriya, R. (2011). Assessing Corporate Financial Distress in Automobile Industry
Annexures
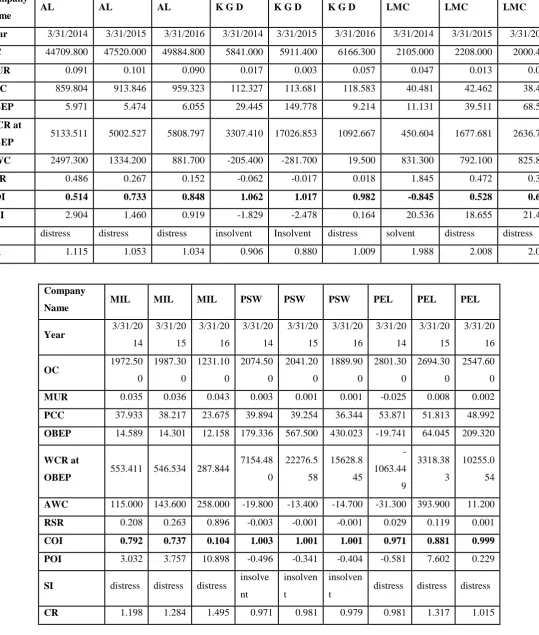
[image:14.595.28.568.86.722.2]Table 1:
Company
Name AL AL AL K G D K G D K G D LMC LMC LMC
Year 3/31/2014 3/31/2015 3/31/2016 3/31/2014 3/31/2015 3/31/2016 3/31/2014 3/31/2015 3/31/2016
OC 44709.800 47520.000 49884.800 5841.000 5911.400 6166.300 2105.000 2208.000 2000.400
MUR 0.091 0.101 0.090 0.017 0.003 0.057 0.047 0.013 0.007
PCC 859.804 913.846 959.323 112.327 113.681 118.583 40.481 42.462 38.469
OBEP 5.971 5.474 6.055 29.445 149.778 9.214 11.131 39.511 68.541
WCR at
OBEP 5133.511 5002.527 5808.797 3307.410 17026.853 1092.667 450.604 1677.681 2636.713 AWC 2497.300 1334.200 881.700 -205.400 -281.700 19.500 831.300 792.100 825.800
RSR 0.486 0.267 0.152 -0.062 -0.017 0.018 1.845 0.472 0.313
COI 0.514 0.733 0.848 1.062 1.017 0.982 -0.845 0.528 0.687
POI 2.904 1.460 0.919 -1.829 -2.478 0.164 20.536 18.655 21.467
SI distress distress distress insolvent Insolvent distress solvent distress distress
CR 1.115 1.053 1.034 0.906 0.880 1.009 1.988 2.008 2.016
Company
Name MIL MIL MIL PSW PSW PSW PEL PEL PEL
Year 3/31/20 14 3/31/20 15 3/31/20 16 3/31/20 14 3/31/20 15 3/31/20 16 3/31/20 14 3/31/20 15 3/31/20 16 OC 1972.50 0 1987.30 0 1231.10 0 2074.50 0 2041.20 0 1889.90 0 2801.30 0 2694.30 0 2547.60 0
MUR 0.035 0.036 0.043 0.003 0.001 0.001 -0.025 0.008 0.002
PCC 37.933 38.217 23.675 39.894 39.254 36.344 53.871 51.813 48.992
OBEP 14.589 14.301 12.158 179.336 567.500 430.023 -19.741 64.045 209.320
WCR at
OBEP 553.411 546.534 287.844
7154.48 0 22276.5 58 15628.8 45 -1063.44 9 3318.38 3 10255.0 54
AWC 115.000 143.600 258.000 -19.800 -13.400 -14.700 -31.300 393.900 11.200
RSR 0.208 0.263 0.896 -0.003 -0.001 -0.001 0.029 0.119 0.001
COI 0.792 0.737 0.104 1.003 1.001 1.001 0.971 0.881 0.999 POI 3.032 3.757 10.898 -0.496 -0.341 -0.404 -0.581 7.602 0.229
SI distress distress distress insolve nt
insolven t
insolven
t distress distress distress
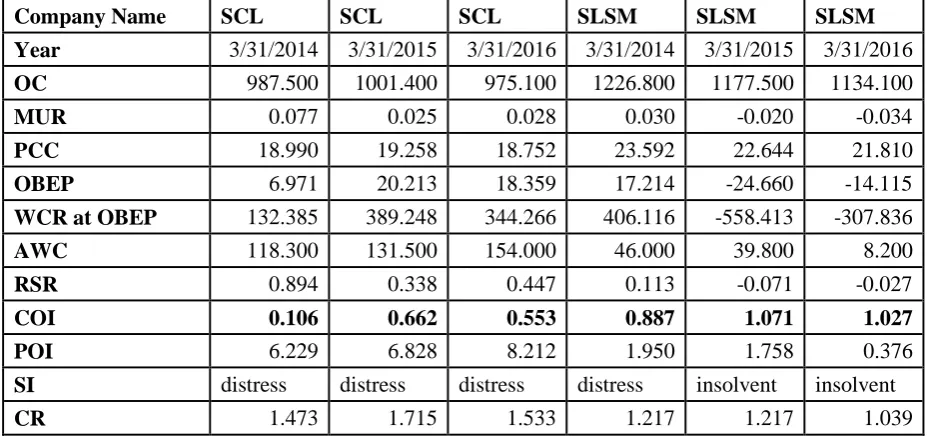
Company Name SCL SCL SCL SLSM SLSM SLSM
Year 3/31/2014 3/31/2015 3/31/2016 3/31/2014 3/31/2015 3/31/2016
OC 987.500 1001.400 975.100 1226.800 1177.500 1134.100
MUR 0.077 0.025 0.028 0.030 -0.020 -0.034
PCC 18.990 19.258 18.752 23.592 22.644 21.810
OBEP 6.971 20.213 18.359 17.214 -24.660 -14.115
WCR at OBEP 132.385 389.248 344.266 406.116 -558.413 -307.836
AWC 118.300 131.500 154.000 46.000 39.800 8.200
RSR 0.894 0.338 0.447 0.113 -0.071 -0.027
COI 0.106 0.662 0.553 0.887 1.071 1.027
POI 6.229 6.828 8.212 1.950 1.758 0.376
SI distress distress distress distress insolvent insolvent
CR 1.473 1.715 1.533 1.217 1.217 1.039
Company Name SSM SSM SSM TJBM TJBM TJBM
Year 3/31/2014 3/31/2015 3/31/2016 3/31/2014 3/31/2015 3/31/2016
OC 1134.900 1067.800 1061.500 825.400 877.000 951.100
MUR 0.001 0.003 -0.031 0.097 0.049 0.047
PCC 21.825 20.535 20.413 15.873 16.865 18.290
OBEP 567.950 184.603 -15.391 5.633 10.627 11.115
WCR at OBEP 12395.509 3790.761 -314.178 89.414 179.229 203.297
AvailableWC -139.200 -11.700 -75.800 0.097 0.049 0.047
RSR -0.011 -0.003 0.241 0.668 0.449 0.207
COI 1.011 1.003 0.759 0.332 0.551 0.793
POI -6.378 -0.570 -3.713 3.761 4.773 2.302
SI insolvent insolvent distress distress distress distress
[image:15.595.42.506.37.257.2]CR 0.618 0.952 0.721 1.119 1.146 1.074
Table 2: List of Companies and Terms used.
1. Arvind Ltd. - AL 2. K G Denim Ltd -KGD
3. Lakshmi Mills Co. Ltd.- LMC 4. Mohite Industries Ltd -MIL
5. Pasupati Spinning & Wvg. Mills Ltd.- PSW 6. Pioneer Embroideries Ltd -PEL
7. SalonaCotspin Ltd - SCL
Operating Cost Mark up rate Pro cycle cost
Operational Break Even Point Working capital required at OBEP
Available Working Capital
8. Sri Lakshmi Saraswathi Textiles (Arni) Ltd - SLST
9. Suryavanshi Spinning Mills Ltd - SSM 10. Tamilnadu Jai Bharath Mills Ltd.- TJBM 11. Welspun India Ltd. – WIL
Relative Solvency Ratio Chance of Insolvency
Possible Stage of Insolvency Solvency indicator
Current Ratio