Citation:
Kolotourou, M and Radley, D and Chadwick, P and Smith, L and Orfanos, S and Kapetanakis, V and Singhal, A and Cole, TJ and Sacher, PM (2013) Is BMI alone a sufficient outcome to evaluate interventions for child obesity? Childhood obesity (Print), 9 (4). 350 - 356. ISSN 2153-2168 DOI: https://doi.org/10.1089/chi.2013.0019
Link to Leeds Beckett Repository record:
http://eprints.leedsbeckett.ac.uk/66/
Document Version: Article
The aim of the Leeds Beckett Repository is to provide open access to our research, as required by funder policies and permitted by publishers and copyright law.
The Leeds Beckett repository holds a wide range of publications, each of which has been checked for copyright and the relevant embargo period has been applied by the Research Services team.
We operate on a standard take-down policy. If you are the author or publisher of an output and you would like it removed from the repository, please contact us and we will investigate on a case-by-case basis.
Is BMI Alone a Sufficient Outcome
To Evaluate Interventions for Child Obesity?
Maria Kolotourou, MSc,
1Duncan Radley, PhD,
1Paul Chadwick, DClinPsy,
1Lindsey Smith, PhD,
1Stavros Orfanos, BSc,
1Venediktos Kapetanakis, PhD,
2Atul Singhal, MD, PhD,
3Tim J. Cole, PhD,
4and Paul M. Sacher, PhD
1,3Abstract
Background:BMI is often used to evaluate the effectiveness of childhood obesity interventions, but such interventions may have additional benefits independent of effects on adiposity. We investigated whether benefits to health outcomes following the Mind, Exercise, Nutrition.Do It! (MEND) childhood obesity intervention were independent of or associated with changes in zBMI.
Methods:A total of 79 obese children were measured at baseline; 71 and 42 participants were followed-up at 6 and 12 months respectively, and split into four groups depending on magnitude of change in zBMI. Differences between groups for waist cir-cumference, cardiovascular fitness, physical and sedentary activities, and self-esteem were investigated.
Results:Apart from waist circumference and its z-score, there were no differences or trends across zBMI subgroups for any outcome. Independent of the degree of zBMI change, benefits in several parameters were observed in children participating in this obesity intervention.
Conclusion: We concluded that isolating a single parameter like zBMI change and neglecting other important outcomes is restrictive and may undermine the evaluation of childhood obesity intervention effectiveness.
Introduction
C
hildhood obesity is a serious public health problem adversely affecting children’s health.1Even thoughthere is convergence on the core elements of suc-cessful childhood obesity interventions,2–4 there is less
consensus about the parameters by which such interven-tions should be judged as clinically effective. Because childhood obesity affects several body functions and sys-tems, evaluations of interventions should use markers which reflect this diverse range.
Associations between the degree of BMI z-score (zBMI) change and markers of metabolic and cardiovascular health have been used in an attempt to establish thresholds by which an intervention can be claimed as clinically effec-tive.5–8 For example, Ford et al. defined a -0.25 zBMI change as the lowest threshold for achieving clinically significant changes in metabolic health.5
These measures are undoubtedly valuable; however, reliance on a zBMI threshold as a sole measure of an in-tervention’s effectiveness may be too restrictive. The threshold of -0.25 was primarily defined by associations with metabolic health parameters, which although impor-tant, represent only one of many body systems affected by obesity. Our aim was to investigate additional benefits associated with different levels of zBMI change in obese children who attended a multicomponent, community-based, childhood obesity intervention.9
Methods
The data presented in this article originated from the Mind, Exercise, Nutrition.Do It! (MEND) randomized
controlled trial (RCT) and was approved by the Me-tropolitan Multi-Centre Research Ethics Committee (Cur-rent Controlled Trials ISRCTN 30238779). Consent and
1Mytime MEND, Bromley, Kent, United Kingdom.
2Division of Population Health Sciences and Education, St George’s, University of London, London, United Kingdom. 3Childhood Nutrition Research Centre, University College London, Institute of Child Health, London, United Kingdom. 4MRC Centre of Epidemiology for Child Health, University College London, Institute of Child Health, London, United Kingdom.
ªMary Ann Liebert, Inc. DOI: 10.1089/chi.2013.0019
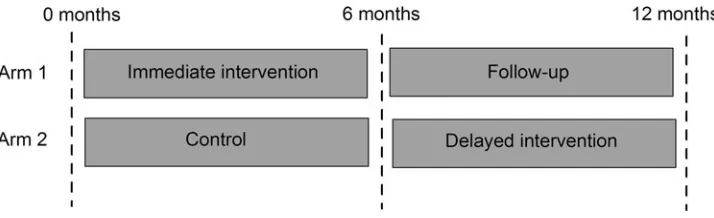
assent forms (for parents and children respectively) were signed by researchers and families to confirm trial entry. This family-based intervention consisted of the 9-week MEND program followed by provision of a 12-week free family swim pass. The program consisted of twice-weekly group sessions, including nutrition education, behavior modification, and fun-based physical activity. The inter-vention took place at five different sites (four urban, one rural) and was delivered to children and their parents by separate teams of health and exercise professionals. The methods and results of the original RCT have been pub-lished elsewhere.9In this study, we only present data from
groups when they both served as intervention (i.e., no control data). Therefore, 12-month data were only avail-able for half the sample (Fig. 1).
Participants
For this study, analyses were carried out on two sub-samples of children. The first subsample consisted of a group of 71 participants from both arms of the original RCT who completed the 6-month intervention (Fig. 1). The second subsample was a group of 42 participants from arm 1 only, who were assessed at 12 months (6 months following the intervention). The delayed-intervention de-sign of the original RCT meant that only participants who initially received the intervention (arm 1 or immediate intervention group) were assessed at 12 months (Fig. 1). The analyses were performed using available data, dis-carding records with missing measurements.
Data from 79 obese MEND participants [BMI ‡98th
percentile,10 mean zBMI 2.75 standard deviation (SD)
0.56] from both groups were used in the analysis. Mean age at baseline was 10.3 years (SD 1.3 years) and 49 participants (62%) were female. Thirty-eight participants (48%) were from minority ethnic groups, 13 (16%) were from low socioeconomic status families, and 20 (25%) were from households where the primary earner was un-employed.
Outcome Measures
Anthropometry (weight, height, BMI, waist circumfer-ence), cardiovascular fitness (blood pressure, recovery heart rate following a step test), physical activity, seden-tary behaviors, and self-esteem were measured at baseline,
6 and 12 months. Detailed information on the methodology used has been published elsewhere.9
Statistical Analysis
Differences in outcomes after 6 and 12 months from baseline were investigated using at-test.
Participants were split into four subgroups on the basis of their change in zBMI:
Group A: Participants with an increase in zBMI of >0; Group B: Participants with a decrease in zBMI of ‡0 to
<0.25;
Group C: Participants with a decrease in zBMI of ‡0.25 to <0.5;
Group D: Participants with a decrease in zBMI of ‡0.5.
For all zBMI subgroups and for each outcome variable, preintervention levels and changes between ‘initial’ and ‘final’ measurements were summarized as means and standard errors (Tables 1 and 2).
Differences in outcomes across the four zBMI sub-groups were investigated at two time points—at 6 and 12 months from baseline. For each of the two time points, analysis of variance (ANOVA) was performed to investi-gate whether there were significant differences in the ‘initial’ means and the mean change in outcomes, across the four zBMI subgroups.
A test of linear trend in the change of outcome variables after baseline using linear regression was performed at 6 and at 12 months postintervention to assess whether zBMI change as a continuous variable predicted outcome change. The assumptions of normality and homogeneity were as-sessedpost hoclooking at QQ plots of the residuals of the fitted models. Statistical significance was set at p<0.05 two-tailed. All analyses were conducted using SPSS 18.0 for Windows (SPSS, Chicago, IL).
Results
[image:3.603.123.480.620.729.2]The initial mean and mean changes 6 and 12 months after baseline for these subgroups are shown in Tables 1 and 2, respectively. Waist circumference and its z-score over 6 and 12 months showed significant differences be-tween the four zBMI subgroups and positive linear trends between reduction and zBMI loss (Tables 1 and 2). How-ever, for the remaining variables, there were no statistically
Figure 1. Randomized controlled trial (RCT) study design.
Table 1. Change in BMI, Waist Circumference, Blood Pressure, Fitness, Activity, and Self-Esteem with zBMI Change over 6 Months
Change in BMI z-score over 6 months
zBMI decrease zBMI decrease zBMI decrease Increased >0 to <0.25 ‡0.25 to <0.5 ‡0.5
(n59) (n529) (n517) (n516)
na Mean (SE) Mean (SE) Mean (SE) Mean (SE)
Group comparisonb
Test of linear trendc BMI (kg/m2)
Initial mean 28.6 (2.6) 27.2 (0.7) 26.3 (0.6) 25.9 (0.9) 0.5
Mean change 1.4 (0.3) -0.3 (0.1) -1.6 (0.1) -3.0 (0.2) <0.001 by design
<0.001 by design
BMI z-score
Initial mean 2.81 (0.28) 2.76 (0.11) 2.60 (0.11) 2.65 (0.13) 0.7
Mean change 0.08 (0.02) -0.14 (0.02) -0.37 (0.02) -0.71 (0.05) <0.001 by design
<0.001 by design
Waist circumference (cm)
Initial mean 80.4 (3.6) 82.0 (1.4) 80.3 (1.5) 79.4 (1.9) 0.7
Mean change -2.4 (0.8) -2.5 (0.5) -4.9 (0.7) -7.8 (0.7) <0.001 <0.001
Waist circumference z-score
Initial mean 2.79 (0.24) 2.93 (0.09) 2.70 (0.12) 2.75 (0.13) 0.7
Mean change -0.29 (0.07) -0.31 (0.04) -0.55 (0.08) -0.82 (0.06) <0.001 <0.001
Systolic blood pressure (mmHg)
Initial mean 117.2 (4.3) 116.6 (2.7) 116.9 (2.6) 116.5 (3.2) 0.7
Mean change -4.6 (2.7) -5.7 (2.5) -3.2 (2.7) -6.0 (3.0) 0.9 0.4
Diastolic blood pressure (mmHg)
Initial mean 66.9 (3.0) 66.1 (1.8) 65.3 (1.9) 62.9 (1.8) 0.6
Mean change -5.3 (3.8) -3.9 (2.1) -2.2 (1.7) -6.7 (1.9) 0.6 0.7
Recovery heart rate (beats/minute)
Initial mean 125 (12) 111 (4) 115 (6) 107 (6) 0.99
Mean change -28 (13) -13 (5) -19 (5) -21 (7) 0.5 >0.9
Physical activity (hours/week)
Initial mean 8.8 (1.8) 7.8 (1.0) 11.4 (1.6) 8.1 (0.9) 0.2
Mean change 1.3 (2.1) 5.1 (1.5) 2.4 (2.3) 6.2 (1.8) 0.4 0.12
Sedentary activity (hours/week)
Initial mean 20.6 (2.4) 22.9 (1.5) 17.1 (1.8) 20.3 (2.2) 0.9
Mean change -8.7 (2.2) -4.9 (1.8) -2.7 (1.8) -4.8 (1.7) 0.4 0.3
Global self-esteem score (range 0–4)
Initial mean 2.8 (0.3) 2.8 (0.2) 3.2 (0.1) 3.0 (0.1) 0.7
Mean change 0.1 (0.3) 0.3 (0.1) 0.2 (0.2) 0.3 (0.2) 0.8 >0.9
an=maximum number of participants per subgroup. bpvalue obtained from analysis of variance (ANOVA.).
cpvalue obtained from linear regression model fitting zBMI change as continuous explanatory variable and adjusting for randomization group.
Table 2. Change in BMI, Waist Circumference, Blood Pressure, Fitness, Activity, and Self-Esteem with zBMI Change over 12 Months
Change in BMI z-score over 12 months
zBMI decrease zBMI decrease zBMI decrease Increased >0 to <0.25 ‡0.25 to <0.5 ‡0.5
(n59) (n518) (n58) (n57)
na Mean (SE) Mean (SE) Mean (SE) Mean (SE)
Group comparisonb
Test of linear trendc BMI (kg/m2)
Initial mean 27.5 (1.4) 27.4 (0.8) 27.4 (0.9) 26.4 (0.6) 0.9
Mean change 1.9 (0.2) 0.4 (0.1) -0.9 (0.2) -3.1 (0.4) <0.001 by design
<0.001 by design
BMI z-score
Initial mean 2.71 (0.18) 2.82 (0.11) 3.01 (0.17) 2.75 (0.07) 0.6
Mean change 0.11 (0.03) -0.11 (0.01) -0.37 (0.02) -0.81 (0.08) <0.001 by design
<0.001 by design
Waist circumference (cm)
Initial mean 81.4 (2.0) 83.8 (2.2) 80.6 (2.0) 80.1 (2.5) 0.6
Mean change -1.6 (1.1) -2.2 (1.1) -2.7 (1.7) -7.9 (1.3) 0.02 <0.001
Waist circumference z-score
Initial mean 2.89 (0.12) 2.99 (0.12) 3.08 (0.14) 2.86 (0.16) 0.7
Mean change -0.29 (0.08) -0.36 (0.07) -0.56 (0.11) -0.92 (0.15) 0.001 <0.001
Systolic blood pressure (mmHg)
Initial mean 117.7 (4.5) 120.9 (3.3) 126.3 (6.5) 121.5 (5.8) 0.7
Mean change -9.3 (3.4) -2.7 (3.5) -5.7 (3.9) -12.9 (6.2) 0.3 0.2
Diastolic blood pressure (mmHg)
Initial mean 63.7 (3.9) 66.3 (1.9) 69.3 (3.2) 63.8 (2.5) 0.6
Mean change -6.6 (4.9) 0.3 (1.9) -3.8 (2.7) -2.6 (3.2) 0.4 >0.9
Recovery heart rate (beats/minute)
Initial mean 111 (8) 115 (8) 115 (6) 115 (12) 0.9
Mean change -12 (10) -14 (8) 1 (5) -22 (11) 0.5 0.5
Physical activity (hours/week)
Initial mean 5.2 (0.8) 8.6 (1.1) 7.8 (1.6) 6.3 (1.2) 0.2
Mean change 3.2 (1.6) 3.7 (2.0) 3.9 (1.3) 6.1 (1.6) 0.9 0.5
Sedentary activity (hours/week)
Initial mean 21.1 (3.1) 21.2 (1.8) 18.8 (2.6) 21.0 (4.2) 0.9
Mean change -1.4 (4.1) -1.5 (1.2) -1.6 (1.1) -4.3 (3.4) 0.9 0.8
Global self-esteem score (range 0–4)
Initial mean 2.9 (0.3) 2.7 (0.2) 2.7 (0.3) 3.1 (0.2) 0.7
Mean change 0.3 (0.3) 0.4 (0.2) -0.1 (0.3) 0.5 (0.2) 0.5 0.6
an=maximum number of participants per subgroup. bpvalue obtained from analysis of variance (ANOVA) test.
cpvalue obtained from linear regression model fitting zBMI change as continuous explanatory variable.
SE, standard error.
significant differences or trends across the zBMI subgroups at 6 or 12 months from baseline (Tables 1 and 2).
Discussion
In this study, the benefits of a childhood obesity inter-vention on cardiovascular fitness, physical activity, sed-entary activities, and self-esteem over 6 and 12 months did not differ according to the degree of zBMI reduction. Notably, even children who increased their zBMI showed improvement in the majority of outcomes (Tables 1 and 2). The only parameters associated with the degree of zBMI reduction were waist circumference and its z-score. This was an expected finding because BMI and waist circum-ference are correlated,11 both being measures of body
composition. Overall, the results suggest that regardless of the magnitude and direction of change in zBMI, the intervention had beneficial effects on important health outcomes.
These results are supported by previous studies. More precisely, a 3-month physical activity intervention in obese prepubertal children has been shown to improve blood pressure at 6 months, regardless of body weight or fat reduction.12 Another intervention targeting obese
children did not have a significant effect on zBMI, but resulted in significant improvements in objectively mea-sured physical activity and sedentary behaviours.13
Nowicka et al.14 found positive effects on self-esteem of
6- to 17-year-old obese children who attended a low-intensity family therapy intervention and achieved a mean zBMI change of -0.12. The authors stated that the ben-eficial effect on self-esteem was not correlated with the degree of zBMI reduction. Hence, in line with findings from this study, Nowicka et al. found that psychological status was positively affected by the intervention, re-gardless of the degree in zBMI change.
Undoubtedly, there is evidence supporting the notion that zBMI reduction is associated with metabolic benefits that have important positive effects on children’s health.5–8
A few studies have tried to quantify the magnitude of zBMI reduction required to positively influence obese children’s metabolic health.5,6,8Reinehr et al.7 published
results suggesting that a 0.5 reduction in zBMI was re-quired for improved metabolic health 1 year after an obesity intervention. Ford et al.5 subsequently examined
the effects of different levels of zBMI reduction in obese children on several cardiovascular disease risk factors. They showed that metabolic benefits were seen with a zBMI reduction of 0.25 units, therefore suggesting this as the minimum for metabolic benefits.5
Despite these interesting findings, research in this area is still inconclusive. Other studies have shown similar metabolic benefits, with smaller reductions in zBMI. The Kolsgaard et al. family intervention study15 reported
improvements in lipid profile and insulin resistance, even though the average zBMI reduction was only
-0.13. In a similar study by Kirk et al.,16 a significant
percentage of children with abnormal values for lipid and glucose metabolism indicators moved to normal while experiencing only a modest reduction in zBMI (-0.15). Pedrosa et al.17 showed that a 1-year
inter-vention for overweight and obese prepubertal children reduced zBMI modestly (-0.18), yet improved meta-bolic syndrome indicators. Similar benefits in lipid pro-file and insulin resistance indicators such as glucose and insulin levels and homeostasis model assessment (HOMA) have also been reported with only moderate or no decrease in zBMI.15,18,19
Therefore, it seems premature to recommend zBMI thresholds to define intervention effectiveness, especially in the light of several studies suggesting that improvements in glucose and lipid profile and positive metabolic effects can be achieved with smaller reductions or even mainte-nance of zBMI.12–18
A strength of the current study was the variety of out-comes used to assess intervention effectiveness. Moreover, the intervention design fulfilled the prerequisites of a successful childhood obesity program.2–4 One limitation
was that the study was not originally powered to detect differences in outcomes according to different levels of zBMI change. However, there was sufficient power to show the trend for waist circumference and its z-score. A related limitation was that, due to loss of follow-up data, the number of participants per group was in some cases small. Lastly, the lack of dietary data in the present study was also a limitation, while blood sample collection was not part of the study design and physical activity level was assessed using a nonvalidated tool.
It should also be acknowledged that another important reason behind the variation in zBMI between studies and its association with outcomes is the use of different growth charts; for example, in the current study the British growth charts were used,10whereas in US studies
CDC growth charts are implemented.20When available,
country-specific growth charts are used in national studies because they provide better comparisons of the study population with the country’s general population. As growth charts differ in construction methodology, sample size, and sample characteristics, direct compari-sons of zBMI changes between studies using different charts is inherently problematic. Equivalent changes in absolute BMI do not equate to equivalent changes in zBMI between charts. Additionally, the age and severity of obesity of the sample affects interpretation of the magnitude of zBMI change. Within charts, zBMI scales attenuate absolute BMI change,21 such that children
with higher baseline zBMI require greater changes in absolute BMI to produce equivalent changes in zBMI. This issue is particularly pronounced in the CDC growth charts due to the Box–Cox transformation used to ac-count for skewness.22,23 These limitations further
Conclusion
In conclusion, our findings indicate that benefits in several important parameters of health occurred in children participating in this obesity intervention, regardless of the degree of zBMI change. On the basis of these results, it is apparent that setting a zBMI reduction cutoff to assess the effectiveness of childhood obesity interventions can be misleading, considering the value of other outcomes that may improve in the absence of zBMI change. We cannot yet be certain of the best outcomes to assess such inter-ventions’ effectiveness,24,25 and focusing on a single out-come such as zBMI is premature.
Acknowledgments
The MEND research team would like to thank all the children and parents who participated in this trial.
Author Disclosure Statement
Maria Kolotourou is employed part-time at Mytime MEND. Dr. Duncan Radley is employed full-time at Mytime MEND. Dr. Lindsey Smith was employed full-time at MEND at the full-time of preparation of this publica-tion. Dr. Paul Chadwick is currently a part-time consultant at Mytime MEND. Dr. Venediktos Kapetanakis serves as a consultant statistician at Mytime MEND. Stavros Orfanos, Professor Tim Cole and Professor Atul Singhal have no conflicts of interest. Dr. Paul Sacher is currently employed as a Senior Research Fellow at the UCL Institute of Child Health as well as Consultant Chief Research and Devel-opment Officer at Mytime MEND.
Financial and nonfinancial support (e.g., staff and ven-ues) were provided by the following UK organizations: National Institute for Health Research, Sainsbury’s Su-permarkets Ltd., Bromley Mytime, Bromley Primary Care Trust (PCT), Great Ormond Street Hospital for Children NHS Trust, London Borough of Lewisham, MEND Cen-tral Ltd, New Cross Gate New Deal for Communities, Parkwood Leisure, Southwark PCT, The Lewisham Hospital NHS Trust, UCL Institute of Child Health, and Waveney PCT. Tim Cole was funded by MRC grant G0700961.
References
1. Abrams P, Levitt Katz LE. Metabolic effects of obesity causing disease in childhood.Curr Opin Endocrinol Diabetes Obes2010; 18:23–27.
2. Scottish Intercollegiate Guidelines Network. Management of Obesity: A national clinical guideline. 2011. Available at www .sign.ac.uk/pdf/sign115.pdf Last accessed June 1, 2013.
3. National Institute for Health and Clinical Excellence (NICE) Obesity: The prevention, identification, assessment and man-agement of overweight and obesity in adults and children.
2006. Available at www.nice.org.uk/cg43 Last accessed June 1, 2013.
4. American Dietetic Association. Position of the American Dietetic Association: Individual-, family-, school-, and community-based interventions for pediatric overweight.J Am Diet Assoc2006;106: 925–945.
5. Ford AL, Hunt LP, Cooper A, et al. What reduction in BMI SDS is required in obese adolescents to improve body composition and cardiometabolic health?Arch Dis Child2010;95:256–261. 6. Hunt LP, Ford A, Sabin MA, et al. Clinical measures of adiposity
and percentage fat loss: Which measure most accurately reflects fat loss and what should we aim for? Arch Dis Child2007;92: 399–403.
7. Reinehr T, Andler W. Changes in the atherogenic risk factor profile according to degree of weight loss.Arch Dis Child2004; 89:419–422.
8. Reinehr T, de Sousa G, Toschke AM, et al. Long-term follow-up of cardiovascular disease risk factors in children after an obesity intervention.Am J Clin Nutr2006;84:490–496.
9. Sacher PM, Kolotourou M, Chadwick PM, et al. Randomized controlled trial of the MEND program: A family-based community intervention for childhood obesity. Obesity 2010;18(Suppl 1):S62– S68.
10. Cole TJ, Freeman JV, Preece MA. Body mass index reference curves for the UK, 1990.Arch Dis Child1995;73:25–29. 11. Rudolf MC, Greenwood DC, Cole TJ, et al. Rising obesity and
expanding waistlines in schoolchildren: A cohort study.Arch Dis Child2004;89:235–237.
12. Farpour-Lambert NJ, Aggoun Y, Marchand LM, et al. Physical activity reduces systemic blood pressure and improves early markers of atherosclerosis in pre-pubertal obese children. J Am Coll Cardiol2009;54:2396–2406.
13. Hughes AR, Stewart L, Chapple J, et al. Randomized, controlled trial of a best-practice individualized behavioral program for treatment of childhood overweight: Scottish Childhood Overweight Treatment Trial (SCOTT).Pediatrics2008;121:e539– e546.
14. Nowicka P, Pietrobelli A, Flodmark CE. Low-intensity fam-ily therapy intervention is useful in a clinical setting to treat obese and extremely obese children. Int J Pediatr Obes 2007;2: 211–217.
15. Kolsgaard ML, Joner G, Brunborg C, et al. Reduction in BMI z-score and improvement in cardiometabolic risk factors in obese children and adolescents. The Oslo Adiposity Intervention Study— a hospital/public health nurse combined treatment.BMC Pediatr
2011;11:47.
16. Kirk S, Zeller M, Claytor R, et al. The relationship of health outcomes to improvement in BMI in children and adolescents.
Obes Res2005;13:876–882.
17. Pedrosa C, Oliveira BM, Albuquerque I, et al. Markers of meta-bolic syndrome in obese children before and after 1-year lifestyle intervention program.Eur J Nutr2011;50:391–400.
18. Cummings DM, Henes S, Kolasa KM, et al. Insulin resistance status: Predicting weight response in overweight children. Arch Pediatr Adolesc Med2008;162:764–768.
19. Tompkins CL, Moran K, Preedom S, et al. Physical activity-in-duced improvements in markers of insulin resistance in overweight and obese children and adolescents. Curr Diabetes Rev
2011;7:164–170.
20. Kuczmarski R, Ogden C, Guo S. 2000 CDC Growth Charts for the United States: Methods and development. National Center for Health Statistics.Vital Health Stat2002;11.
21. Cole TJ, Faith MS, Pietrobelli A, et al. What is the best measure of adiposity change in growing children: BMI, BMI %, BMI z-score or BMI centile?Eur J Clin Nutr2005;59:419–425.
22. Flegal KM, Ogden CL, Wei R, et al. Prevalence of overweight in US children: Comparison of US growth charts from the Centers for Disease Control and Prevention with other reference values for body mass index.Am J Clin Nutr2001;73:1086–1093.
23. Flegal KM, Wei R, Ogden CL, et al. Characterizing extreme values of body mass index-for-age by using the 2000 Centers for Disease Control and Prevention growth charts.Am J Clin Nutr 2009;90: 1314–1320.
24. Klesges LM, Williams NA, Davis KS, et al. External validity re-porting in behavioral treatment of childhood obesity: A systematic review.Am J Prev Med2012;42:185–192.
25. Oude Luttikhuis H, Baur L, Jansen H, et al. Interventions for treating obesity in children. Cochrane Database Syst Rev2009: CD001872.
Address correspondence to:
Paul M. Sacher, PhD Senior Research Fellow Childhood Nutrition Research Centre University College London, Institute of Child Health London, WC1N 1EH, United Kingdom