APPLICATION OF REMOTE SENSING AND GIS IN LAND USE/ LAND
COVER CHANGE DETECTION ANALYSIS
Dr. Kavita1 and Dr. M. Anji Reddy2
1
Associate professor, Dept. of Civil Engineering, Institute of Aeronautical Engineering, Dundigal, Hyderabad- 500043, India.
2
Directorate of Research and Development Cell, JNTU Campus, Kukatpally, Hyderabad 500 085, India.
ABSTRACT
Land use and land cover change has become a central constituent in existing strategies for organization of natural resources and monitoring environmental changes. City expansion has brought severe losses of water bodies, cultivation land, and vegetation. Land use land cover change is accountable for a variety of urban and rural environmental issues like increased runoff, decreased air quality, increased local temperature, , deterioration of water quality and subsequent flooding, , etc. In this work we have taken Audipudi village of karamchedu mandal as a case study. The village land use and land cover changes that took place in comparing the land use changes in 1988, 2002 and 2006 . Remote sensing and GIS methodology is adopted to study the geographical land use changes occurred during the study period. Satellite Imagery- IRS1D, LISS-III (23mt resolution) data and high resolution IRS P6 LISS IV MX with the resolution of 5.8 x5.8 mt) of three different years are taken into consideration. After pre-processing of the image, unsupervised classification has been performed to categorize the images in to unlike land use categories. Classification precision is as well expected using the field information obtained on or after field surveys. Information, land use and land cover change study is very useful to local government and micro level planners for sustainable development and betterment of the city or Village.
Keywords: Land Use/Land Cover; Remote Sensing, Arc GIS, Change detection, planning
GE-International Journal of Engineering Research
Vol. 4, Issue 12, December 2016 Impact Factor- 5.613 ISSN(O): 2321-1717, ISSN(P): 2394-420X
© Associated Asia Research Foundation (AARF) Publication
1.1 Introduction
Land use refers to anthropogenic activities and a variety of uses, which are carried on ground such as settlements, agriculture, industry etc”. Land cover refers to the substance present e.g. water bodies, vegetation, rocks /soils and other resulting from land transformations. Although land use is usually indirect based on the cover, yet both the conditions land use and land cover being closely related are interchangeable.[1]
Land use and Land cover change detection is one of the outlook of ecological aims. Preparing landscape individuality maps can help to change recognition. Land is the mainly essential natural resources on which every activity is based. Land use unlikely geology, is seasonally dynamic and indeed is more changing [2]. All agricultural, animal and forestry productions depend on productivity of the land [3].
Understanding changes and interactions between human activities, landscape patterns, and natural experience are necessary for appropriate land administration and decision improvement. Land Cover, defined as the assemblage of Biotic and a biotic component on the earth’s surface is one of the most crucial properties of the Earth system [4]. Land cover includes grassland, snow, water bodies, forest and bare Soil. Land Use includes recreation area, built up land, wildlife management area and agricultural land etc.
Geographic Information System (GIS) and Remote Sensing (RS) are at this moment providing new tools for sophisticated ecosystem management. For efficient planning and management, the classified data in a timely manner, in order to get the classified data of the ground; satellites are the best resources to provide the data in a timely manner[5].Identifying delineating and mapping land cover are important for global monitoring studies with the component of resource management and planning activities[6]. The gathering of remotely sensed data facilitates the synoptic analysis of patterning, Earth - system function, and change at global, regional and local scales eventually; such information also provide an main link between localized ecological research and regional, intensive, national and international management of biological diversity. Spatial patterns of land use/cover over different time periods in particular can be systematically mapped, monitored and accurately assessed from Satellite data accompanied with conventional ground data [7]. This study is to map out the Land use Land cover study to map out the status of land use land cover of Audipudi village in three different years view to distinguish the changes that has taken place in this status mainly in the agriculture land so as to forecast possible changes that might take place in this position in upcoming years by means of both Geographic Information System and Remote Sensing data.
2.1 Materials and Methods
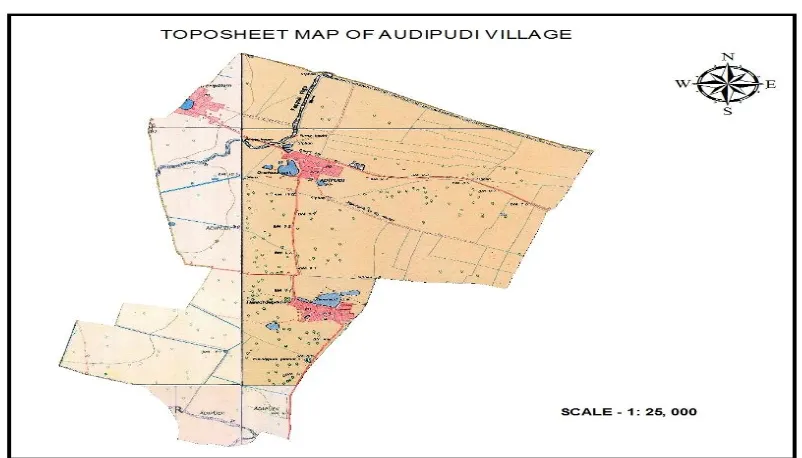
prosperous model village located 8.5 km from the busy commercial town of Chirala in Prakasam district of Andhra Pradesh in India. The study area Audipudi village is located at Longitude of 800 13’ 53” to 800 17’ 38” and Latitude of 150 55’ 46” to 150 55’ 46. Area of Audipudi village is 19.386 sq km (approximately). It has a total population of 4,848. Fig 1 shows the base map and location of the study area.
Figure 1 : Showing the base map of the study area.
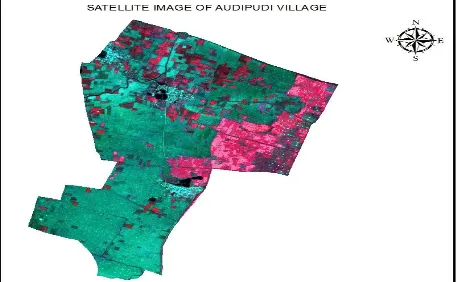
[image:3.612.108.509.427.656.2]Figure 3 : Showing the Satellite Imagery of the study area 2.1 Materials & Methodology
The main objectives of land use/ land cover classification system are Objectives
To develop a land use land cover map with high resolution data of the study area. To see the capability of high resolution satellite data of IRS- LISS IV MX (5.8 mt). Satellite data to delineate various land use/ land cover classifications through digital
Interpretation techniques (i.e. unsupervised classification) as well as visual interpretation techniques.
To study land use and land cover changes of study area.
The land use map will be utilized as a necessary record, which provide the information for allocate new land use practices. It will integrate economic demographic and environmental impacts, which have occurred in an area.
Land use land cover categorization scheme as devised by NRSA was used.
Not only will the information indicate where intensive development has already taken place and where there is open land suitable for future expansion, but it will also make it possible to
DATA COLLECTION
Primary Data Secondary Data
Data Base Creation
Spatial Data Base Attribute Data Base
Raw Satellite Data SOI Topo Sheets
Georefercing Extraction of GCPS Pre Processing
Mosaicing Enhancement
Final rectified Toposheet Final Merged geodata
out put
Thematic Layer (using visual interpretation technique)
Scanning Digitization Editing & overlay using Arc/GIS platform
Spatial and Attribute Data Linkage From Satellite Image/Top sheet
LU/LC
Soil
Base
Drainage
Transport
Transport
Land use land cover classification, identification of change detection
Flow chart 1: Showing the Methodology flowchat
Field work for confirmation of doughtful area and an collateral data using GPS
change detection Analysis
2.2 Acquisition and Processing of Top maps and Satellite Data
Acquisition and processing of raw data preparation of thematic maps involves the following steps.
Methodology used in Lu/Lc change detection studies.
Survey of India toposheets No. 66A01NE, 66A01SE, 66A05NW and 66A05SW on 1:25,000 scale from survey of India.
Acquisition of LISS III and IRS P6 LISS IV MX satellite data of the year 1998, 2002 and 2006 NRSC, Balanagar, Hyderabad and Toposheets from Survey of India,
Hyderabad.
Subsetting and Geo-referencing of toposheets from taking the reference of ground control points.
Preparation of digital mosaic depicting the study area and edge matching of the toposheets.
Geo-referencing and Geo-coding and of LISS III and IRS P6 LISS IV MX digital data by extracting the Ground Control Points (GCPs) from SOI toposheets.
Application Digital image enhancement of correction models for making the digital data free from errors and distortions both radiometry and geometry of the satellite data. Preparation of a mosaic, which shows the continuous imagery of the study area.
Generation of thematic maps using ARC GIS software.
2.3 Satellite Data Processing
Digital remote sensing data is used in the study area and is obtained by LISS III and IRS P6 LISS IV MX imagery with a resolution of 23 m. LISS IV MX is a higher resolution multispectral band ground resolution of 5.8 m.
Consequently, it is more suitable to give the sensor characteristics of LISS III and LISS IV MX. Map of 1:25,000 scale obtained from Survey of India covering the whole study area is used to extract the (GCPs) Ground Control Points and to separate the boundary of the given study area.
The individual values of the pixels deals with Image Enhancement. The objective of spectral improvement is to make certain features more visible in an image by bringing out more contrast. The following techniques have been adopted for Geo-referencing of LISS III and LISS IV MX data covering the study area. ERDAS 8.6 (Image Processing Software) has been used for the work.
For creating raster file for study area 1:25,000 scale toposheets are scanned. These are referenced based on the longitudinal & latitudinal co-ordinates. After geo-referencing in ERDAS software all the maps are mosaic together and a digital mosaic is prepared which depicts the continuity of the study area.
matching is carried out. At the end of this process the digital data, which is free from all distortions, is available for digital image enhancement, classification for Land use/land cover map preparation with the help of Digital image Interpretation and Visual image Interpretation techniques.
3.1 Results and Discussions
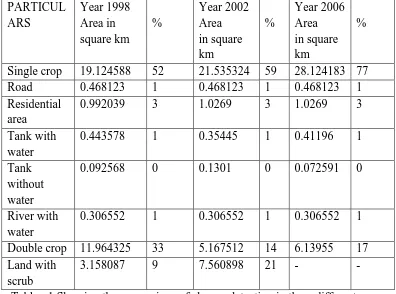
PARTICUL ARS Year 1998 Area in square km % Year 2002 Area in square km % Year 2006 Area in square km %
Single crop 19.124588 52 21.535324 59 28.124183 77
Road 0.468123 1 0.468123 1 0.468123 1
Residential area
0.992039 3 1.0269 3 1.0269 3
Tank with water
0.443578 1 0.35445 1 0.41196 1
Tank without water
0.092568 0 0.1301 0 0.072591 0
River with water
0.306552 1 0.306552 1 0.306552 1
Double crop 11.964325 33 5.167512 14 6.13955 17 Land with
scrub
[image:7.612.108.504.136.430.2]3.158087 9 7.560898 21 - -
Table : 1 Showing the comparison of change detection in three different years
[image:7.612.76.509.465.637.2]Figure 5: Showing the land use/ land cover changes in the year 2002
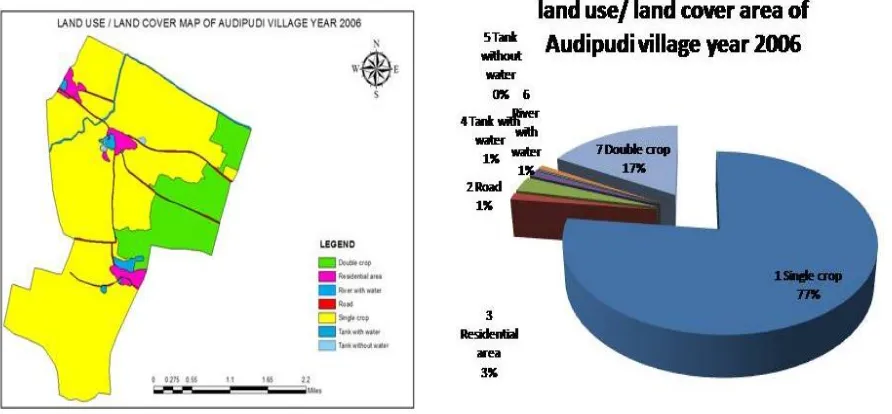
Figure 6: Showing the land use/ land cover changes in the year 2006
3.2 Conclusions
Change Detection Analysis (1998-2006):
[image:8.612.76.522.285.492.2]The given land use and land cover change detections of Audipudi village of Karamchedu mandal shows that the changes are mainly in the agriculture area.
References:
. [1] B. S. Chaudhary et al., Human Induced Land Use/ Land Cover Changes in Northern Part of Gurgaon District, Haryana, India:Natural Resources Census Concept, J. Hum. Ecol., 23(3): 243-252 (2008)
[2] vemu sreenivasulu et al., pinnamaneni udaya bhaskar, Change Detection In Landuse And Landcover Using Remote Sensing And Gis Techniques, International Journal Of Engineering Science And Technology, Vol. 2(12), 2010, 7758-7762
[3] K. sundarakumar et al., Land Use And Land Cover Change Detection And Urban Sprawl Analysis Of Vijayawada City Using Multitemporal Landsat Data, International Journal Of Engineering Science And Technology (IJEST), vol. 4 no.01,pg; 171-178, january 2012, ISSN : 0975-5462
[4] Prakasam.C, Land Use And Land Cover Change Detection Through Remote Sensing
Approach:A Case Study Of Kodaikanal Taluk, Tamil Nadu, International Journal Of Geomatics And Geosciences Volume 1, No 2, 2010
[5] Y.Babykalpana et al., Classification Of Lulc Change Detection Using Remotely Sensed Data For Coimbatore City, Tamilnadu, India, Journal Of Computing, Volume 2, Issue 5, MAY 2010, ISSN 2151-9617
[6] E.P. Nobi, Land Use And Land Cover Assessment Along Pondicherry And Its Surroundings Using Indian Remote Sensing Satellite And GIS, American-Eurasian Journal Of Scientific Research 4 (2): 54-58, 2009, ISSN 1818-6785.