ANALYSIS OF NIFTY FIFTY STOCKS BASED ON K-MEANS
CLUSTERING TECHNIQUE FOR STOCK MARKET PREDICTION
Dr. T.Chitra kalarani* and S.Indrakala**
*Associate professor, Kundavai Nachiaar Govt. Arts College(W) Autonomous, Thanjavur. **Assistant professor, Kundavai Nachiaar Govt. Arts College(W) Autonomous, Thanjavur.
ABSTRACT
The objective of this research paper is to construct clusters of Nifty companies for better investment. In this study, is used in stock market prediction for removing the redundant and outlier data to form Clusters, as a result the prediction data is reduced.
Key Words: Stock market, Clustering Analysis, K-mean Clustering, Prediction
1. INTRODUCTION
Nowadays, stock markets are an important component of the most countries' economies and play a major role in the international financial system. The stock markets are important from both the industry’s point of view as well as the investor’s point of view, but there are several uncertainties involved in the movement of the markets. Many factors interact in the stock market including political events, Economic Factors, and traders’ expectations. Therefore, predicting market price movements is quite difficult. In response to such difficulty, clustering techniques have been introduced and applied for financial prediction.
analysis of the Dow Jones index companies, in order to identify similar temporal behavior of the traded stock prices. Tola et al. (2008) underlined the importance of clustering technique in the advancement of the reliability of the portfolio considering the ratio between predicted and realized risk. Chen and Huang (2009) applied cluster analysis to group the huge amount of equity mutual funds based on four evaluation indices in order to help investment decisions. In addition, they offered a fuzzy model which gives the optimal investment proportion of each cluster. Narayan et al. (2011) examined share price clustering on twelve largest companies listed on Mexican stock exchange and pointed out that volume and risk impact price clustering negatively. Babu et al. (2012) analyzed the main clustering techniques to compare the performances and apply to 35 randomly selected stocks from a number of different sectors in India in order to be able to propose an effective method to predict the stock price movements. They indicated that the hierarchical agglomerative outperforms in terms of accuracy. D’Urso et al. (2013) handled the clustering of financial time series and proposed a new approach which combines fuzziness and GARCH models.
According to the literature reviewed, we could see that there are very few studies and researches in clustering stock market companies. In this paper, we demonstrate well known clustering technique namely K-means as well as some validity indexes to obtain the optimal number of clusters. The rest of this paper is organized as follows. Section 2 explains methodology and discuss about algorithm used in this research of research. Section 3 shows main findings. Finally, in Section 4 conclusion is presented. Some recommendation for further research will be given in the last section.
2. METHODOLOGY
2.1. Data Selection
The historical period of stock market data can be chosen in a wide range. The more number of training cases is used for predicting the stock. To create enough training cases, the historical period has to be long enough. On the other hand, too big historical period can diminish the accuracy of forecast due to the changing character of data (outdated patterns can make input data too noisy for neural network to extract useful information). The optimal Prediction depends on High Price, Low Price and Traded Data factors; normally, the dataset is in a range from 1000 to 12000. The number of possible training cases 𝑛_𝑐𝑎𝑠𝑒𝑠 is calculating using formula:
𝑛𝑐𝑎𝑠𝑒𝑠 = 𝑚𝑛𝑜 ∗ 360 = 𝑛_𝑜𝑢𝑡,
Where: 𝑚𝑛𝑜 - total number of historical trading years; 𝑛_𝑜𝑢𝑡 - number of outputs days to predict. 2.2. K-Means Clustering Algorithm
K-means is one of the simplest unsupervised learning algorithms that solve the clustering problem. The algorithm executes in simple way by classifying a given data set through a certain number of clusters (say k clusters) fixed apriori. The basic concept is to define k centers; one for each cluster. These centers should be placed in a tricky way because of different location causes different result. So, it is better way to place them as much as possible far away from each other. In next step it takes each point belonging to a given data set and associates it to the nearest center. When no point remains, the first step is completed and an early grouping is done. Here we need to re-calculate k new centroids as bary center of the clusters obtained from the previous step. After this there are k new centroids. At this point a new binding has to be done between the same data set points and the nearest new center. A loop is generated. As a result of this loop the k centers change their location step by step until no more changes are done. Finally, this algorithm aims at minimizing an objective function knows as squared error function given by:
This algorithm aims at minimizing an objective function, a squared error function i.e.
𝐽 = 𝑛𝑗 =0 𝑛𝑖=0 𝑥𝑖𝑗 − 𝑐𝑗 2 (1)
Where 𝑥𝑖𝑗 − 𝑐𝑗 2 is a chosen distance measure between a data point 𝑥𝑖(𝑗 )and the cluster
of objects with their attributes and grouping these objects into K cluster which the objects lying in one cluster should be as close as possible to each other, we are implementing in this study this algorithm.
2.3. Algorithm
The algorithm consists of the following steps:
(a) Place K points into the space represented by the objects that are being clustered. These points represent initial group centroids.
(b) Assign each object to the group that has the closest centroid.
(c) When all objects have been assigned, recalculate the positions of the K centroids.
(d)Repeat Steps 2 and 3 until the centroids no longer move. This produces a separation of the objects into groups from which the metric to be minimized can be calculated.
Although it can be proved that the procedure will always terminate, the k-means algorithm does not necessarily find the most optimal configuration, corresponding to the global objective function minimum. The algorithm is also significantly sensitive to the initial randomly selected cluster centers. The k-means algorithm can be run multiple times to reduce this effect.
3. RESULTS & ANALYSIS
Stock market values keeps on changing day by day, so it is very difficult to predict the future value of the market. Although there are various techniques implemented for the prediction of stock market values, but the predicted values are not very accurate and error rate is more. Hence an efficient technique is implemented for the prediction of the stock market values using hybrid combinatorial method of clustering and classification. The dataset is taken and first clustered using K-means clustering algorithm and this clustered value into sub-clusters so that most feature vectors in each sub cluster belong to the same class. Then, for each sub cluster, we choose its centroid as the representative feature vector. Finally, we employ the representative feature vectors to predict the stock price movements.
stock market index data, the open, close, high, low values were treated as attributes and every day are treated as objects.
Data Set Objects Attributes URL
[image:5.612.77.507.143.415.2]Nifty Fifty 144315 4 http://www.nseindia.com/products/content/e quities/indices/histrical_data.htm Table .1. Dataset
Figure 1 Cluster Visualization of Nifty Fifty Input Samples
Figure 2 K Means Clusters of Nifty Fifty Input Sample
The Figure 2 indicates the Clustering of Stock Market Data from Jan 2008 to Sep 2014. The Sample Data is clustered into 7 clusters based on the value 𝑘 in 𝑘 − 𝑀𝑒𝑎𝑛𝑠 Algorithm.
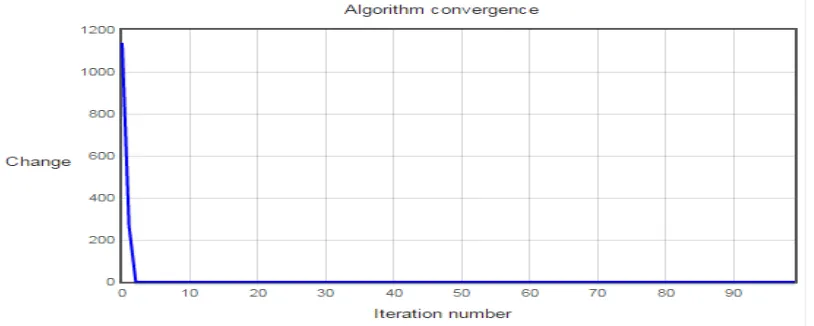
Figure 3 Convergence of Nifty Fifty Input Sample by K-Means Clusters
[image:6.612.92.499.367.530.2]Attribute (Predictors)
Cluster
1 2 3 4 5 6 7
Open Price 5649 13560.25 3205 9995 16785.9 10 14560 High Price 5161.1 13560.25 1925 8590 16399.75 10 9850
[image:7.612.98.522.97.487.2]Low Price 5540.05 13560.25 3200 9990 16399.75 10 9850 Close Price 5238.35 13560.25 2481.6 8882.7 16490.85 10 14107.5
Table 2 Performance of K-Means based on Nifty Fifty Index
Iteration Number of Cases in each Cluster
1 2 3 4 5 6 7
1 1416.37 923.33 1552.3 1552.3 1872.001 997.763 2460.365 2 1094.21 365.97 266.39 486 272.021 37.724 1218.169 3 707.825 483.84 217.77 1313.2 0 33.368 677.614 4 523.036 193.39 184.6 1852.4 0 27.905 450.204 5 504.491 193.39 192.47 1106.9 0 24.064 316.658 6 367.078 184.1 183.73 2420.3 0 25.905 312.298 7 395.47 434.39 177.99 2263.5 0 26.901 578.365 8 374.645 305.63 176.74 1072.4 0 27.983 304.805 9 248.344 0 153.96 581.52 0 27.723 270.517 10 198.261 0 129.12 475.28 0 27.533 518.683
Table 3 Iteration Samples in Clustering by K-Means Algorithm
The goal of stock market data clustering algorithm to market data and showed the results (Table .2) based on the stock market index. The clustering algorithms were successfully applied to cluster stock market data comprising into K-means clustering.
4. CONCLUSION
to closest clusters. The K- means Centroid Method is used in Stock market Prediction for removing the redundant and outlier data to form Clusters, as a result the prediction data is reduced.
REFERENCES :
[1]. Babu, M. S.; Geethanjali, N.; Satyanarayana, B. (2012). Clustering Approach to Stock Market Prediction, International Journal of Advanced Networking and Applications 3(84): 1281–91.
[2]. Basaltoa N, Bellottib R, De Carlob F, Facchib P, Pascazio S (2005). Clustering stock market companies via chaotic map synchronization, Physica A.
[3]. Chen, L. H., & Huang, L. 2009. Portfolio optimization of equity mutual funds with fuzzy return rates and risks. Expert Systems with Applications, 36(2), 3720-3727.
[4]. D’Urso, P.; Cappelli, C.; Di Lallo, D.; Massari, R. 2013. Clustering of financial time series, Phsica A 392: 2114–2129.
[5] Hartigan J. A, “Clustering Algorithms”, Wiley 1975
[6]. Narayan, P. K., Narayan, S., Popp, S., & D'Rosario, M. (2011). Share price clusering in Mexico. International Review of Financial Analysis , 113-119.
[7]. Tola, V.; Lillo, F.; Gallegati, M.; Montegna, R. N. 2008. Cluster analysis for portfolio optimization, Journal of Economic Dynamics & Control, 32: 235–258.