Citation:
Weaving, DA and Jones, BL and Till, K and Marshall, P and Abt, G (2017) Multiple measures are needed to quantify training loads in professional rugby league. International Journal of Sports Medicine, 38 (10). pp. 735-740. ISSN 1439-3964 DOI: https://doi.org/10.1055/s-0043-114007
Link to Leeds Beckett Repository record: http://eprints.leedsbeckett.ac.uk/3829/
Document Version: Article
The aim of the Leeds Beckett Repository is to provide open access to our research, as required by funder policies and permitted by publishers and copyright law.
The Leeds Beckett repository holds a wide range of publications, each of which has been checked for copyright and the relevant embargo period has been applied by the Research Services team.
We operate on a standard take-down policy. If you are the author or publisher of an output and you would like it removed from the repository, please contact us and we will investigate on a case-by-case basis.
Multiple measures are needed to quantify training loads in professional rugby league. Abstract
To investigate the effect of training mode (conditioning and skills) on multivariate training load relationships in professional rugby league via principal component analysis. Four measures of training load (internal: heart rate exertion index, session rating of perceived exertion; external: PlayerLoad™, individualised high-speed distance) were collected from 23 professional male rugby league players over the course of one 12-wk preseason period. Training was categorised by mode (skills or conditioning) and then subjected to a principal component analysis. Extraction criteria were set at an eigenvalue of greater than 1. Modes that extracted more than 1 principal component were subject to a Varimax rotation. Skills extracted 1 principal component, explaining 57% of the variance. Conditioning extracted 2 principal components (1st: internal; 2nd: external), explaining 85% of the variance. The presence of multiple training load dimensions (principal components) during conditioning training provides further evidence of the influence of training mode on the ability of individual measures of external or internal training load to capture training variance. Consequently, a combination of internal- and external- training load measures is required during certain training modes.
Introduction
To develop the wide range of physical qualities needed to succeed in professional rugby league competition, multiple modes are prescribed such as skills and traditional conditioning training [16, 27, 35]. Theoretically, the frequency, intensity and duration of the activities (e.g. sprinting, accelerations, collisions) performed by players during these modes (i.e. the external load) induce multiple psycho-physiological and mechanical responses termed the internal load [22, 33]. For a given external load, both the magnitude and type of internal load is likely to vary between players due to differences in individual characteristics which result in
multiple fitness and fatigue effects and ultimately varied training outcomes [14, 22]. Understanding these dose-response relationships are therefore important to balance the promotion of adaptations whilst minimising negative outcomes such as injury [9]. To ensure precision of an appropriate training prescription, it is important that practitioners use valid methods to quantify the internal and external loads placed onto players across all training modes.
physiological markers in the field [3, 27, 22]. For example, the validity of sRPE is inferred due to the large within-individual correlations found with Edward’s TRIMP which have been found to range from r = 0.54 [95% confidence interval (CI): 0.14 to 0.86] to 0.78 [0.45 to 0.92] [22].
Whilst we can be confident that a radar gun represents the true speed value, given the multi-facetted nature of training load described previously [33], it is likely that HR-based criterion measurements represent only an aspect of the actual internal load imposed. Therefore, the validity of adopting a single training load measure remains unclear. Given these difficulties, it is regularly suggested that a more robust approach to infer validity is to adopt the changes in training outcomes, such as measures of fatigue [30], injury incidence [14] or physical qualities [2. 28, 29], as the criterion method. As the theoretical internal load governs training-induced adaptations, the quantification of this construct is preferred for these load-outcome relationships [21]. However, external load methods have also been found to possess dose-response relationships with training outcomes. For example, total-distance (r = 0.86 [95% CI: 0.70 to 0.95]) and high-speed distance (r = 0.76 [95% CI: 0.51 to 0.91]) were associated with the changes in creatine kinase concentration 24-hours after professional rugby league match play [30]. Therefore, it is likely that both external and internal training load methods can contribute information to the outcomes of training, the extent to which is likely to change between modes of training [27, 36]. However, in most research investigating load-outcome relationships, single training load variables are used and there is limited consideration of whether a multivariate approach is needed to represent the training load and how his changes across modes of training.
In our previous study[36], we examined the influence of training mode on the multivariate relationships of external and internal training load measures in professional rugby league players across two 12-week pre-season periods. We reported that a combination of internal load (iTRIMP, sRPE) and external load (Bodyload™, total impacts and high-speed distance) explained a greater proportion of the variance during certain training modes (skills, speed, strongman and wrestle) when compared to either internal or external load measures alone. Moreover, the training load measures contributing to each principal component (PC) changed depending on the training mode. For example, during skills training the external load
measures explained 48% of the variance with internal load measures explaining a further 20%. However, during speed training it was the opposite, with internal load measures explaining 46% of the variance and external load measures explaining a further 21%. This strongly suggests that a single external or internal load measure is unable to capture all training-related stress across all training types. Alterations in the strength of the relationships between training load measures have also been shown in previous studies [27].
measures and how these changes across modes of training, plus the wide range of methods used to quantify both theoretical constructs in practice, a replication study is warranted to increase the generalisability of the findings [5, 23].
Therefore, the aim of the current study was to replicate our previous study[36], while using different but commonly utilised methods to represent the external (PlayerLoad™ and
individualised high-speed-distance) and internal (sRPE and heart-rate-exertion-index [HREI]) training load, together with a shorter training period, and with players competing at a
different standard of competition. For the current study we focused on two of the most frequently utilised training modes in rugby league (skills and traditional conditioning) [27, 36] and aimed to determine the structure of the interrelationships among measures of training load to define common underlying dimensions in the variables via a principal component analysis (PCA). PCA is a mathematical technique used to reduce the dimensionality of any given data set that consists of a number of highly correlated variables, while still keeping as much of the variation in the data set as possible [11, 25]. We hypothesised that the different external load structures of skills and conditioning training would influence the strength of the variance explained by an individual training load measure. If multiple principal components (PC) are extracted this would suggest an individual measure is unable to account for the variance of multiple measures. Within the PCA, by including only four training load
variables (two external and two internal) rather than the many more available to practitioners, we were able to provide the most conservative test to this hypothesis.
Methods Participants
Twenty-three professional rugby league players from the same Kingston Press Rugby League Championship team participated in this study. The Championship is the 2nd highest level of rugby league competition in England. The participants had the following characteristics (24 ± 3 years, 184.8 ± 6.7 cm, body mass 95.4 ± 8.6 kg). The study conforms with international ethical standards [18] was granted ethics approval by the Department of Sport, Health and Exercise Science human research ethics committee at The University of Hull. Written informed consent was obtained from each player before the start of the study.
Design
The study used a longitudinal observational research design in which training load data were collected during one 12-week preseason preparatory period during the 2014-2015 Kingston Press Rugby League Championship season.
Methodology
Skills: Focus on enhancing individual rugby league skills and team technical-tactical strategies
Conditioning: focus on linear- and shuttle-running which aimed to improve players capabilities to tolerate high-intensity running bouts. The distances for these running drills were prescribed for each player based on a percentage of the velocity they achieved during the 30-15 Intermittent Fitness Test (30-15IFT).
sRPE was calculated for each player during the study period using the method of Foster et al. [12]Exercise intensity for sRPE was determined using the Borg CR-10 scale [6]. sRPE was then multiplied by the training-session duration to calculate the sRPE training load in
arbitrary units (AU). All players who participated in the study had been familiarised with the RPE scale, including the interpretation of exertion in relation to the verbal anchors placed on the scale. sRPE for each player were collected ~30 minutes after the completion of each training session by the lead researcher into a custom-made spreadsheet with no third-party observation present throughout the study period.
Manufacturer-derived heart rate exertion index (HREI) was used to calculate the heart rate-derived internal load. This method follows the same principles as Edwards22 but utilises arbitrary exponential weighting factors:
(Duration in Zone 1 x 1) + (Duration in Zone 2 x 1.20) + (Duration in Zone 3 x 1.50) + (Duration in Zone 4 x 2.20) + (Duration in Zone 5 x 4.50)
Where zone 1 = 50-59% of HRmax, zone 2 = 60-69% HRmax, zone 3 = 70-79% HRmax, Zone 4
= 80-89% HRmax and zone 5 = 90-100% HRmax
HR was measured at 5 s intervals during each training session using Polar HR straps (T31 coded, Polar, Oy, Finland) that transmitted continuously to the GPS device (Optimeye X4, Catapult Innovations, Scoresby, Victoria).
External training load measures of the distance run above a players individualised high speed threshold (high-speed distance) and PlayerLoad™ were collected concurrently during each session using 10 Hz GPS devices with in-built 100 Hz tri-axial accelerometer (Optimeye X4, Catapult Innovations, Scoresby, Victoria). PlayerLoad™ was chosen as an overall measure of external load experienced by players that also includes accelerations and collision-based activity [13] which are key considerations within rugby league [15]. PlayerLoad™ is a modified vector magnitude and is expressed as the square root of the sum of the squared instantaneous rate of change in acceleration in each of the three axes (X, Y, and Z) and divided by 100. PlayerLoad™ data were expressed in arbitrary units (AU). PlayerLoad™ has previously been shown to possess acceptable reliability [7].High-speed-distance was chosen as an external load measure to represent the individualised “high-intensity” running demands experienced during training for each player [1].In order to individualise each player’s
demarcated high-speed threshold, players completed the 30-15IFT. The 30-15IFT consisted of
Statistical Analysis
Prior to performing a principal component analysis (PCA), training load data were centred and scaled with the Pearson correlation matrix was visually inspected to determine the factorability of the data for PCA[34].The suitability of the data was assessed using the Kaiser-Meyer-Olkin (KMO) measure of sampling adequacy and the Bartlett test of sphericity [4]. KMO (~chi-square) values were 0.60 (284) and 0.59 (562) for conditioning and skills training. A KMO value of 0.5 or above has been suggested as a threshold, above which the data set is suitable for PCA[17, 25, 36]. Bartlett’s test of sphericity was significant for both training modes (P <0.001). The four training load measures (HREI, PlayerLoad™, high-speed distance, sRPE) were subjected to a PCA for each training mode using a prior
communality estimate of less than 1. The stages involved in the PCA method are deletion of the mean, calculation of the covariance matrix of the data, determination of the eigenvalues and eigenvectors of the covariance matrix, and rotation of the original data onto a coordinate system spanned by the eigenvectors of the covariance matrix [11].A principal-axis method was used to extract the PC. As the number of PC will always equal the number the number of original inputted variables, PC with an eigenvalue of less than 1 (Kaiser criterion) were not retained for extraction [25]. This is due to the notion that any component displaying an eigenvalue greater than 1.00 is accounting for a greater proportion of variance than that contributed by any 1 variable.Varimax rotation was performed when two or more PC were retained and with the goal of making the component loadings more easily interpretable. For each extracted PC, only the original variables that possessed a PC loading of greater than 0.70 were retained for interpretation [17, 37].The Statistical Package for the Social Sciences (SPSS, version 20.0 for Windows, SPSS Inc, Chicago, IL) was used to conduct the analysis.
Results
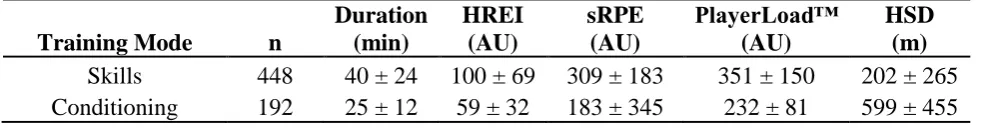
A total of 640 individual training sessions were observed during the study with 23 players providing 28 ± 5 sessions each. Table 1 highlights the number of sessions and mean training loads for conditioning and skills training.
**INSERT TABLE 1 ABOUT HERE**
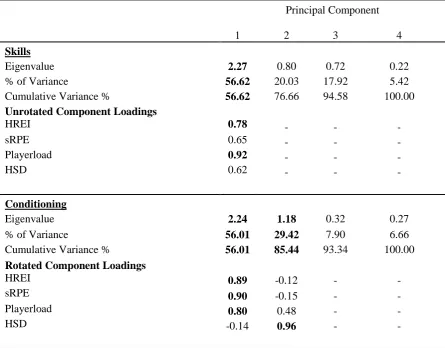
Table 2 displays the PCA, including eigenvalues for each principal component during skills and conditioning training and the total variance explained by each principal component for each training mode. There was a single principal component identified for skills training and two principal components identified for conditioning training, explaining 56.62% and
85.44% of the variance respectively. Pearson correlations including 95% confidence intervals between the training load methods for the two training modes are presented in Table 3.
***INSERT TABLE 2 ABOUT HERE***
***INSERT TABLE 3 ABOUT HERE***
The main finding of the study is the identification of multiple dimensions (two principal components) in one of the modes of training, thereby confirming the results of our previous study [36].In the current study, we identified one and two PC during skills and conditioning training, respectively. These findings demonstrate further evidence that a single training load measure, either external or internal, is unable to capture the variance of multiple measures across different modes of training in professional rugby league players. This has important implications for training load monitoring. Within a concurrent training programme, the load imposed during each mode contributes to the accumulation of load across acute (e.g. 7-day rolling mean) and chronic (e.g. 28-day rolling mean) training periods [14]. As single training load methods are commonly adopted to investigate load-outcome relationships such as injury [20] and changes in fitness [2, 28, 29], further research is required to determine whether a multivariate training load model (using methods such as PCA) provide a better representation of load for such investigations. This is important as despite the current and previous findings [35] only training load methods, including either singular or multiple measurements, that show a dose-response relationship with training outcomes such as changes in fitness or performance should be used [2, 27, 28].Ideally, this should involve a wide range of the currently utilised training load methods that are available to examine the most influential individual training load variables that contribute to a multivariate training load model.
More specifically, in our previous study[36]we identified a single PC during conditioning training, suggesting that the training load measures were providing similar information. However, in the current study we identified two PC during conditioning with the first PC including HREI, sRPE and PlayerLoad™. High-speed distance, individualised based on the maximal speed achieved during the 30-15 IFT, explained additional variance during
conditioning as it was the only variable to provide a meaningful component loading on the second PC. In our previous study[36], an arbitrary (>15 km.h-1) high-speed distance method was unable to account for additional variance, as only a single PC was identified during conditioning. As the major aim of conditioning training is to provide a high-intensity running stimulus, the speed in which players reach ‘high-intensity’ will likely differ between players [1]. Therefore, the use of an individualised approach would provide practitioners with additional information of the load prescribed during this mode. Additionally, differences in GPS sampling rate could have also influenced the findings, as greater validity of high-speed running quantification has been reported for the 10 Hz MinimaxX GPS devices when compared to the GPSports SPI Pro X 15 Hz devices used in our previous study [15].
The presence of one PC during skills training suggests that a single training load variable accounts for a meaningful proportion of the variance (56.6%) of four training load measures during this mode. As only HREI (0.78) and PlayerLoad™ (0.92) demonstrated meaningful (> 0.70) component loadings with the extracted PC, the methods could be used interchangeably to represent the variance of the four training load variables during skills training. However, the presence of a single PC conflicts with our previous findings [36]. Previously, we reported that external training load measures (Bodyload™, total impacts, high-speed distance)
fitness over a given training period in both endurance [27] and team sports players [2, 28]. It is also important to consider that whilst only 1 PC was eligible for extraction during skills training in the current study, the total variance explained (56.6%) by this PC leaves 43.4% of the total variance unexplained between the four training load measures. The Kaiser criterion (eigenvalue > than 1) is considered a conservative approach to extracting meaningful PC [17] and is one of multiple criteria that can be adopted [37] which include the assessment of the scree plot [37] and/or extraction of the number of PC that equal a set percentage of total variance explained [17]. Therefore, it is possible that the second PC (Table 2) could explain additional meaningful variance and therefore, multiple measures could actually be required during skills. A limitation of the current study is that due to the variety of skill and tactical qualities needed to succeed in rugby league competition, skills training will involve a wide range of activities that will subject players to different compositions of external load intensities (e.g. walk, run, sprint, collisions) between sessions including collision activity. Therefore, as skills training is prescribed frequently within training periods [27, 35], future research should determine the relationships between training load methods (either single or combined) and acute training outcomes such as changes in fatigue markers [30, 35] during skills training and consider the influence of collision based activity on those relationships to further elucidate their validity during this training mode. Finally, despite the discrepancies between the current and previous results [36], the findings highlight the importance of investigations that replicate previous research findings [23].
Practical Applications
Questions the use of a single measure when making decisions of the load imposed onto players.
Consider the influence that the training mode has on the capability of individual methods used to reflect the actual load imposed during that training session. Consider measuring the training load using combinations of external and internal
load. During conditioning, it appears one of either PlayerLoad™, HREI or sRPE plus individualised high-speed-distance should be adopted.
Conclusions
The current study has shown that the training mode (conditioning and skills) influences the capability of a single training load measure to explain the variation in multiple measures of the external and internal training load in professional rugby league players. This suggests practitioners shouldn’t rely on a single measure to inform decisions regarding the load imposed onto players and should use both an internal and external training load measure to monitor their prescription of training. The findings provide further evidence that a
multivariate training load model that combines internal and external training load measures should be considered. However, further research is needed to establish how this can be implemented in practice and whether this provides a better model of load-outcome relationships compared to a single measure.
References
2. Akubat I, Patel E, Barrett S, Abt G. Methods of monitoring the training and match load and their relationship to changes in fitness in professional youth soccer players. J Sports Sci. 2012; 30: 1473–1480.
3. Alexiou H, Coutts AJ. A comparison of methods used for quantifying internal training load in women soccer players. Int J Sports Physiol Perform. 2008; 3: 320-330.
4. Bartlett MS. A note on the multiplying factors for various chi square approximations. J R Stat Soc Ser C Appl Stat. 1954; 16: 296–298.
5. Bishop D. An applied research model for the sports sciences. Sports Med. 2008; 38: 253-263.
6. Borg G, Ljunggren G, Ceci R. The increase of perceived exertion, aches and pain in the legs, heart rate and blood lactate during exercise on a bicycle ergometer. Eur J Appl Physiol.1985; 54: 343–349.
7. Boyd LJ, Ball K, Aughey RJ. The reliability of MinimaxX accelerometers for measuring physical activity in Australian football. Int J Sports Physiol Perform. 2011; 6:311–321.
8. Buchheit M. The 30-15 intermittent fitness test: accuracy for individualising interval training of young intermittent sport players. J Strength Cond Res. 2008; 22: 365-374.
9. Colby MJ, Dawson B, Heasman J, Rogalski B, Gabbett TJ. Accelerometer and GPS-derived running loads and injury risk in elite Australian footballers. J Strength Cond Res 2014; 28: 2244-2252.
10. Edwards S. High performance training and racing. In: The Heart Rate Monitor Book. Edwards, ed. Sacramento, CA: Feet Fleet press. 1993.
11. Federolf P, Reid R, Gilgien M, Haugen P, Smith G. The application of principal
component analysis to quantify technique in sports. Scand J Med Sci Sports. 2014; 24: 491-499.
12. Foster C, Florhaug JA, Franklin J, et al. A new approach to monitoring exercise training. J Strength Cond Res. 2001; 15: 109–115.
13. Gabbett TJ. Relationship between accelerometer load, collisions, and repeated high-intensity-effort activity in rugby league players. J Strength Cond Res 2015; 29: 3424-3431.
14. Gabbett TJ. The training-injury prevention paradox: should athletes be training smarter and harder? Br J Sports Med 2016; 50: 273-280.
15. Gabbett TJ, Jenkins DG, Abernethy B. Physical demands of professional rugby league training and competition using microtechnology. J Sci Med Sport. 2012; 15: 80-86.
16. Gabbett TJ, Stein JG, Kemp JG, Lorenzen C. Relationship between tests of physical qualities and physical match performance in elite rugby league players. J Strength Cond Res 2013; 27: 1539-1545.
17. Hair J, Anderson RE, Tatham RL, Black WC. Multivariate Data Analysis. 4th ed. Upper Saddle River, NJ: Prentice-Hall; 1995.
19. Hopkins WG. Measures of reliability in sports medicine and science. Sports Med 2000; 30, 1-15.
20. Hulin BT, Gabbett TJ, Lawson DW, Caputi P, Sampson JA. The acute:chronic workload ratio predicts injury: high chronic workload may decrease injury risk in elite rugby league players. Br J Sports Med 2016; 50: 231-236.
21. Impellizzeri F, Rampinini E, Marcora S. Physiological assessment of aerobic training in soccer. J Sports Sci. 2005; 23: 583-592.
22. Impellizzeri FM, Rampinini E, Coutts AJ, Sassi A, Marcora SM. Use of RPE-based training load in soccer. Med Sci Sports Exerc. 2004; 36: 1042-1047.
23. Ioannidis JPA (2005) Why most published research findings are false. PLoS Med. 2005; 2: e124
24. Johnston RJ, Watsford ML, Kelly SJ, Pine MJ, Spurrs RW. Validity and interunit
reliability of 10 Hz and 15 Hz GPS units for assessing athlete movement demands. J Strength Cond Res. 2014; 28: 1649-1655.
25. Kaiser HF. The application of electronic computers to factor analysis. Educ Psychol Meas. 1960; 20: 141–151.
26. Kelly SJ, Murphy AJ, Watsford ML, Austin D, Rennie M. Reliability and validity of sports accelerometers during static and dynamic testing. Int J Sports Physiol Perform. 2015; 10: 106-111.
27. Lovell TWJ, Sirotic AC, Impellizzeri FM, Coutts AJ. Factors affecting perception of effort (session rating of perceived exertion) during rugby league training. Int J Sports Physiol Perform 2013; 8: 62–69.
28. Manzi V, Iellamo F, Impellizzei F, D’Ottavio S, Castagna C. Relation between
individualized training impulses and performance in distance runners. Med Sci Sports Exerc. 2009; 41: 2090–2096.
29. Manzi V, Bovenzi A, Impellizzeri FM, Carminati I, Castagna C. Individual training-load and aerobic fitness variables in premiership soccer players during the precompetitive season. J Strength Cond Res. 2013; 27: 631–636.
30. Oxendale CL, Twist C, Daniels M, Highton, J. The relationship between match-play characteristics of elite rugby league and indirect markers of muscle damage. Int J Sports Physiol Perform. 2016; 11: 515-521.
31. Rampinini E, Alberti G, Florenza M, Riggio M, Sassi R, Borges TO, Coutts AJ. Accuracy of GPS devices for measuring high-intensity running in field-based team sports. Int J Sports Med. 2015; 36: 49-53.
32. Roe G, Darrall-Jones J, Black C, Shaw W, Till K, Jones B. Validity of 10 Hz GPS and timing gates for assessing maximum velocity in professional rugby union players. Int J Sports Physiol Perform 2016; 13: 1-14.
34. Tabachnick BG, Fidell LS. Using Multivariate Statistics. Boston, MA:Pearson Education; 2007.
35. Twist C, Highton J. Monitoring fatigue and recovery in rugby league players. Int J Sports Physiol Perfom 2013; 8: 467-474.
36. Weaving D, Marshall P, Earle K, Nevill A, Abt G. Combining internal- and external-training-load measures in professional rugby league. Int J Sports Physiol Perform 2014; 9: 905-912.
Table 1. Mean ± SD training load measures and session durations during each training mode.
sRPE: Session rating of perceived exertion; HREI: Heart rate exertion index; HSD: High-speed distance
Training Mode n
Duration (min)
HREI (AU)
sRPE (AU)
PlayerLoad™ (AU)
HSD (m)
Skills 448 40 ± 24 100 ± 69 309 ± 183 351 ± 150 202 ± 265
Table 2. Results of the PCA, showing the Eigenvalue, percentage (%) of variance explained and the cumulative % of variance explained by each Principal Component (PC) for skills and
conditioning. Also showing the unrotated (1 PC extracted) or rotated (> 1 PC extracted) training load component loadings for each PC that were extracted. Loadings that met interpretation criteria (> 0.70) are highlighted in bold.
Principal Component
1 2 3 4
Skills
Eigenvalue 2.27 0.80 0.72 0.22
% of Variance 56.62 20.03 17.92 5.42
Cumulative Variance % 56.62 76.66 94.58 100.00
Unrotated Component Loadings
HREI 0.78 - - -
sRPE 0.65 - - -
Playerload 0.92 - - -
HSD 0.62 - - -
Conditioning
Eigenvalue 2.24 1.18 0.32 0.27
% of Variance 56.01 29.42 7.90 6.66
Cumulative Variance % 56.01 85.44 93.34 100.00
Rotated Component Loadings
HREI 0.89 -0.12 - -
sRPE 0.90 -0.15 - -
Playerload 0.80 0.48 - -
HSD -0.14 0.96 - -
Table 3: Pearson's product-moment coefficients for each training load measure during skills and conditioning training. Includes 95% Confidence Intervals (CI) for each significant correlation. * Significant at 0.05 level ** Significant at 0.001 level *** Significant at 0.0001 level
Hopkins (2002) qualitative correlation coefficient descriptors: t: trivial (0-0.09), s: small (0.1-0.29), m: moderate (0.3-0.49), l: large (0.7-0.89), vl: very large (0.9-0.99)
sRPE 95% CI PlayerLoad™ 95% CI HSD 95% CI
Skills
HREI 0.30***m [0.23 to 0.40] 0.72***l [0.67 to 0.76] 0.22***s [0.13 to 0.31]
sRPE 1.00 - 0.47***m [0.39 to 0.54] 0.27***s [0.18 to 0.35]
PlayerLoad™ - - 1.00 - 0.47***m [0.39 to 0.54]
Conditioning
HREI 0.73***l [0.66 to 0.79] 0.55***l [0.44 to 0.64] -0.19**s [-0.32 to -0.05]
sRPE 1.00 - 0.56***l [0.45 to 0.65] -0.21**s [-0.34 to -0.07]
PlayerLoad™ - - 1.00 - 0.24***s [0.10 to 0.37]