Citation:
Shannon, O and Barlow, M and Duckworth, L and Woods, D and Griffiths, A and Grindrod, A and O’Hara, J (2016) The reliability of a pre-loaded treadmill time-trial in moderate normobaric hypoxia. International Journal of Sports Medicine, 37 (10). pp. 825-830. ISSN 1439-3964 DOI: https://doi.org/10.1055/s-0042-108651
Link to Leeds Beckett Repository record: http://eprints.leedsbeckett.ac.uk/2698/
Document Version: Article
The aim of the Leeds Beckett Repository is to provide open access to our research, as required by funder policies and permitted by publishers and copyright law.
The Leeds Beckett repository holds a wide range of publications, each of which has been checked for copyright and the relevant embargo period has been applied by the Research Services team.
We operate on a standard take-down policy. If you are the author or publisher of an output and you would like it removed from the repository, please contact us and we will investigate on a case-by-case basis.
Title
The reliability of a pre-loaded treadmill time-trial in moderate normobaric hypoxia
Journal
International Journal of Sports Medicine
Authors
Oliver Shannona, Matthew John Barlowa, Lauren Duckwortha, David Woodsab, Ashley Grindroda, Alex Griffithsa, John Paul O’Haraa
Affiliations
a Research Institute for Sport, Physical Activity, and Leisure, Leeds Beckett University,
Leeds, LS16 3QS
b Defence Medical Services, Royal Centre for Defence Medicine
Corresponding Author
Oliver Michael Shannon [email protected]
Carnegie Research Institute
Leeds Beckett University
Headingley Campus
Leeds
Abstract
The purpose of this study was to assess the reliability of a pre-loaded 1500 m treadmill time-trial, conducted in moderate normobaric hypoxia. Eight trained runners/ triathletes (24 ± 3 years, 73.2 ± 8.1 kg, 182.5 ± 6.5 cm, altitude specific V̇O2max: 52.9 ± 5.5 ml·kg-1·min-1)
completed three trials (the first as a familiarisation), involving two, 15 minute running bouts at 45 % and 65 % V̇O2max, respectively, and a 1500 m time-trial in moderate normobaric hypoxia
equivalent to a simulated altitude of 2500 m (FiO2 ~ 15 %). Heart rate, arterial oxygen
saturation, skeletal muscle and cerebral tissue oxygenation (StO2), expired gas (V̇O2 and
V̇CO2), and ratings of perceived exertion were monitored. Running performance (Trial 1:
352.7 ± 40; Trial 2: 353.9 ± 38.2 s) demonstrated a low CV (0.9 %) and high ICC (1). All physiological variables demonstrated a global CV ≤ 4.2 %, and ICC ≥ 0.87, with the exception of muscle (CV 10.4 %; ICC 0.70) and cerebral (CV 4.1 %; ICC 0.82) StO2. These data
Introduction
The assessment of exercise performance is central to many investigations in the field of Sport and Exercise Science, allowing researchers to monitor the efficacy of a treatment or training schedule, compare different populations, and track performance over a particular time period. It is important to know the reliability of the performance test being applied, alongside accompanying physiological parameters, for similar conditions and participant cohorts, to allow accurate interpretation of results. This may include estimating the magnitude of a treatment effect, exploring individual differences, and calculating the smallest worthwhile effect [14]. Likewise, knowledge of protocol reliability can help inform sample size estimations for future investigations [14].
Typically, exercise performance is assessed using a time to exhaustion (TTE) or a time trial (TT) exercise test. The assessment of TTE involves exercise to volitional fatigue at a fixed intensity such as a percentage maximal oxygen uptake (V̇O2max), and affords the opportunity
to monitor steady-state physiology whilst simultaneously providing an indication of performance response. However, TTE tests have been criticised for lacking face validity, inflicting participant boredom, and demonstrating poor reproducibility [18], with coefficient of variation (CV) values often > 25 % [18]. In contrast, TTs, which involve the completion of a
set distance or amount of work (W) in the shortest possible time, more closely represent ‘real world’ competition, and typically demonstrate a coefficient of variation (CV) < 5 % [8].
Exercise testing in a hypoxic (i.e. low oxygen) environment is common across a range of research areas. Notably, exercise physiologists explore the effects of hypoxia on physiological functioning and exercise performance, or else evaluate the efficacy of interventions designed to mitigate the ergolytic effect of hypoxia. This has relevance for the thousands of individuals ascending to altitude (i.e. hypobaric hypoxia) each year for recreational and sporting purposes. However, it is unclear whether protocols predominantly designed for application in normoxia (i.e. sea-level) are appropriate for testing unacclimatised individuals exercising in hypoxia. Indeed, exposure to even mild hypoxia (≥ 580 m simulated altitude) reduces V̇O2max
[11,22,24,28] and has a deleterious effect on exercise performance [10,29,35] relative to normoxia. Likewise, it remains to be established whether hypoxic exercise demonstrates similar reliability to sea-level tests, given, for example, the hypoxic exercise environment will likely be unfamiliar to most participants, and it is possible that individuals may struggle to correctly self-regulate their pacing in this environment [13].
At present, the reproducibility of the hypoxic exercise response is poorly understood. MacNutt and others [23] reported good reliability (≤ 10 %) of physiological and metabolic responses across five testing sessions involving cycling in hypoxia (FiO2 13.0 %). However, exercise
designed to offset the decline in exercise performance in hypoxia [25]. Amann and colleagues [1] observed a CV of 1.0 % for a 5 km cycle ergometry TT in hypoxia (FiO2 15.0 %), and
Arnold et al. [2] reported a CV of 3.9 % for a 10 km run TT in hypoxia (FiO2 15.4 %). The
CV values suggest similar reliability to sea-level performance tests (i.e. < 5 %) [8]. However, in both studies, reliability data was reported secondary to a wider investigation, and only involved a sub-group of participants (four and six, respectively). Likewise, reliability of physiological variables was not reported, and limited information was provided on participant characteristics, making replication difficult. To the best of the authors’ knowledge, no studies have assessed the reliability of a pre-loaded treadmill TT in normobaric hypoxia.
Therefore, the aim of this study was to investigate the reliability of a short-duration high-intensity (1500 m) treadmill TT performed in moderate normobaric hypoxia equivalent to 2500 m altitude (FiO2 ~15.0 %), and pre-loaded with two, 15 minute bouts of steady-state exercise
corresponding to low (45 % V̇O2max) and moderate (65 % V̇O2max) exercise intensities. The
TT was designed to provide a measure of high-intensity continuous running performance at a moderate altitude equivalent to that experienced by athletes on training camps or competing at altitude. The pre-load affords the opportunity to monitor important steady-state variables, which may provide useful mechanistic information to inform the performance measure. Such a protocol, if sufficiently reproducible, could be used to determine the effect of acclimatisation, training, nutritional or other interventions on physiological response and exercise performance in moderate normobaric hypoxia.
Methods
Subjects
Eight trained male runners / triathletes aged 24 ± 3 years, with a body mass of 73.2 ± 8.1 kg, height of 182.5 ± 6.5 cm, and maximal oxygen consumption (V̇O2max) (assessed at a simulated
altitude of 2500 m) of 52.9 ± 5.5 ml·kg-1·min-1 volunteered to take part in this study. The study received institutional ethical approval and was conducted in line with the journals ethical standards [12].
Study overview
Subjects attended the laboratory on four separate occasions, all of which involved exercise in a normobaric hypoxic facility, equivalent to 2500 m altitude (FiO2 ~ 15.0 %). FiO2 was adjusted
daily to account for fluctuations in barometric pressure. The first visit to the laboratory involved an incremental running test to volitional exhaustion to determine V̇O2max, whilst the
second visit involved a familiarisation trial. The third and fourth visits (Trial 1 and Trial 2) constituted the experimental trials, comprising a 1500 m treadmill TT preceded by two, 15 minute steady-state exercise bouts at 45 % and 65 % of altitude V̇O2max, respectively. All
Preliminary testing
A two-part incremental running test was conducted on a motorised treadmill (Woodway, Cranlea, Birmingham, UK) [19]. Participants completed five to eight sub-maximal stages of three minutes duration, interspersed with one minute recovery periods during which time finger-tip blood samples were obtained to determine blood lactate concentrations (YSI 2300 STAT plus, Yellow Springs, Ohio). Running speed was increased by 1 km·h-1 each stage. The treadmill gradient was set to 1 %, to approximate the energetic demands of outdoor running
[20]. Exercise was continued until blood lactate concentrations exceeded 4 mM or ratings of perceived exertion (RPE) reached 18. Following approximately 5 minutes recovery, the second phase of the test commenced. Running speed was fixed at the final speed obtained during the first part of the test, minus 2 km·h-1. Gradient was increased by 1 % every minute, until volitional exhaustion. Expired gas was monitored continuously throughout exercise using an online gas analysis system calibrated before each trial according to the manufacturer’s instructions (MedGraphics Ultima CPX, MGC Diagnostics, MN, USA). Gas data was used to determine V̇O2max (highest 30 second average in V̇O2), and the required sub-maximal running
speeds for the experimental trials, via regression analysis of the V̇O2-speed relationship.
Participants were deemed to have obtained V̇O2max when at least two of the following criteria
were met: A plateau in V̇O2 observed in the last stage [34], RER ≥ 1.15 [17], heart rate (HR)
within 10 b·min-1 of age-predicted maximum (220 – age), RPE ≥ 19, and blood lactate concentrations ≥ 8 mmol [26].
Experimental protocol
Participants completed three separate experimental testing sessions, with the first serving as a familiarisation trial and the following two sessions used to calculate reliability of the exercise protocol.
Participants sat comfortably in a chair in normoxia for 15 minutes on arrival, before entering the normobaric hypoxic chamber, where they rested for a further 30 minutes. The exercise protocol then began. Participants ran on a treadmill for 15 minutes at 45 % V̇O2max. This was
followed by a 5 minute rest period before a second 15 minute run commenced at 65 % V̇O2max.
Participants rested for a further 5 minutes, after which they ran a 1500 m TT. Participants ran at speed approximating 80 % V̇O2max for 30 seconds, before the TT commenced. This served
as a rolling start, to limit the time taken to reach running velocity [36]. Participants manipulated speed manually using the control buttons on the treadmill unit. Running speed and time were not visible during the TT, although feedback on distance covered was given at 200 m intervals. A fixed gradient of 1 % was applied throughout the exercise protocol [20].
Measurements
recorded during the final 2 minutes of pre-hypoxic exposure rest and pre-exercise rest, during the final 2 minutes of each 15 minute steady-state exercise bout, and immediately post-TT.
Muscle and cerebral tissue oxygenation was monitored continuously throughout the testing session using near-infrared spectroscopy (NIRS) (INVOS 5100C, Medtronic, Minneapolis, MN). Prior to analysis, NIRS data was averaged over the final 5 minutes of pre-hypoxic exposure rest, pre-exercise rest, and each 15 minute steady-state exercise bout, throughout the entire TT, and the first 5 minutes of post-TT recovery. The INVOS 5100C measures the reflection of NIR light to determine the ratio of oxygenated and deoxygenated haemoglobin at the measurement site. Data is expressed as a percentage of regional oxygen saturation (StO2),
with the measurable range between 15 and 95 %. Little is known about the reproducibility of StO2 measures obtained via this device during running. A probe was placed in the middle
portion of the lateral gastrocnemius on the left leg, parallel to the longitudinal axis of the lower leg. A second probe was positioned horizontally on the forehead, approximately 2 cm above the left eyebrow to measure oxygenation of the pre-frontal cortex [25]. Probes were held in place via elastic non-compressive bandages to prevent displacement and shield from external light. Hair underneath the probes was removed prior to placement via electric clippers, to avoid attenuation of the NIR light.
Statistical analysis
A combined approach to assessing test-retest reliability was applied [14]. Firstly, prior to analysis, data was naturally log-transformed to minimise heteroscedasticity [14]. Mean values were compared between Trial 1 and Trial 2 to assess systematic changes using a paired t-test (TT data) and two-way repeated measures analysis of variance (ANOVA) (all other variables) using IMB SPSS Statistics version 21.0. The degrees of freedom were adjusted in cases of asphericity, with the Greenhouse Geisser correction applied for ε < 0.75, and the Huynh-Feldt correction was adopted for ε > 0.75. A significant difference was accepted at an alpha level of p < 0.05. A custom made spreadsheet was then used to calculate typical error as a CV (%) and intraclass correlation coefficient (ICC) [Hopkins, W.G. Precision of measurement (2011) in internet: newstats.org/precision.html; (01/06/2015)]. An ICC > 0.90 was considered as high, 0.80 - 0.90 as moderate, and < 0.80 as low. Global data (i.e. reliability of data averaged throughout the trial) was calculated alongside time point specific data, which is relevant for analyses comparing mean values across an entire trial (e.g. ANOVA treatment effect). The smallest worthwhile change (SWC) (0.3 x within subject SD) was also computed for performance data, to determine the minimum effect necessary to represent a ‘real world’ change [31]. As the effects of familiarisation on TT reliability are well established [3,8], only data from Trial 1 and Trial 2 (i.e. the test-retest) is reported.
Results
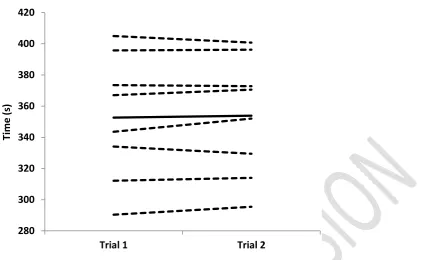
1500 m TT performance
s. Fig. 1 shows a spaghetti plot of individual 1500 m TT times and their pattern of change between trials.
Physiological variables
There was no significant difference between any of the physiological variables between trials overall or at specific measurement points (Table 1.) (p > 0.05). Mean HR and SpO2 had the
lowest CV (≤ 1 %) and ICC (0.98) of measured physiological variables when averaged across the different time points (Table 2.). StO2 measured at the gastrocnemius muscle showed poor
reliability across the trial (Table 1.). Further, CV increased and ICC decreased for gastrocnemius StO2 with running speed (Table 2). Descriptive data of physiological variables
are presented in Table 1. The reliability statistics for each measurement time point and global data are displayed in Table 2.
Discussion
Performance
The main novel finding of the present study was that a pre-loaded 1500 m treadmill TT conducted in moderate normobaric hypoxia (FiO2 ~ 15 %) is a highly reliable test of running
performance in healthy males. The CV for 1500 m TT performance (0.9 %) is superior to values reported for an isolated (i.e. not preceded by a pre-load) 1500 m treadmill TT in well-trained runners conducted in normoxia (CV: 3.3 %) [21]. Likewise, these results compare favourably against other preloaded treadmill TTs conducted in normoxia (CV: 1.0 – 5.0 %) [8]. When viewed alongside the results of Amann and colleagues [1] who reported a CV of 1.0 % for a 5 km treadmill TT in four male runners in hypoxia (FiO2 15 % ) and Arnold et al. [2] who
observed a CV of 3.9 % for a 10 km treadmill TT in six male runners in hypoxia (FiO2 15.4
%), it is apparent that the addition of a moderate hypoxic stress does not necessarily affect the reproducibility of an endurance running performance test. The high ICC (1.0) and low SWC (0.8 s) also suggest this is an appropriate performance test for intervention studies conducted in hypoxia, allowing the detection of small but potentially meaningful performance changes.
Physiological measurements
Reliability statistics were also calculated for physiological parameters commonly monitored during exercise in hypoxia. There were no systematic changes in physiological variables between Trial 1 and Trial 2. This is perhaps not surprising, as significant adaptation/ acclimatisation is unlikely to occur following such a brief period of exercise in moderate normobaric hypoxia [23]. Reliability statistics averaged across the whole experimental trial for HR, RPE, V̇O2, V̇CO2 and SpO2 are good (CV: ≤ 4.2, ICC: ≥ 0.87), and comparable to
those reported during cycling (CV: ≤ 6.0 %, ICC: 0.89) [37] and running (CV: < 5.0 %, ICC: >0.9) [33] TTs conducted in normoxia.
This is the first study to investigate the reliability of StO2 measures obtained from the INVOS
5100C during running. The assessment of StO2 may of value to the researcher or practitioner
in exercise performance in hypoxia [25]. The INVOS 5100C was primarily designed for use in a clinical environment [9], but has been used to monitor recovery from a mixed exercise protocol [6] and during arterial occlusion, with and without the addition of dorsiflexion exercise [27]. Previous investigations conducted in normoxia have reported good reliability across a range of resting StO2 values using this device [15,16].
Average CV for cerebral tissue StO2 across the experimental trial was good (4.5 %) and at
specific time-points (< 7.0 %), although ICC ranged from low to moderate (0.66 – 0.85). There was no apparent decrement in reliability statistics for cerebral tissue StO2 measurements during
exercise (Table 2.). In contrast, the reliability of StO2 at the gastrocnemius was highly variable.
During low intensity exercise (45 % V̇O2max) (CV: 5.0 %, ICC: 0.96), gastrocnemius StO2
showed superior reliability to that previously reported for running at lactate threshold (ICC: 0.87) and V̇O2max (ICC: 0.88) [4], and comparable to during a 5 km TT (CV: 3 %, ICC: 0.94) [33] in other NIRS devices. However, variability increased during moderate intensity exercise (CV: 10.9 %, ICC: 0.88) and TT (CV: 28.8 %, ICC: -0.18), suggesting decreasing reliability at faster running speeds. Considerable muscle deformation during high-intensity running likely changed the pathlength of NIR light through the muscle, leading to motion artefacts which may have been misinterpreted as alterations in the relevant chromophore (i.e. oxyhaemoglobin and deoxyhaemoglobin) concentrations [5]. Anecdotally, there was also regular loss of signal during high-intensity running, probably due to separation of the NIRS probe and skin, which may have introduced further variability into the NIRS signal. This suggests an unsuitability of this device during high-intensity running, when trying to measure StO2 at the gastrocnemius,
as considerable measurement variability would likely mask any changes in StO2 subsequent to
an intervention. Whether there would be improved reliability at a different muscle group or non-exercising muscle is yet to be established. There may be a viable role for this device in monitoring changes in cerebral tissue StO2, and gastrocnemius StO2 during resting/
low-intensity exercise.
Interestingly, reliability appeared to be better for both resting cerebral and gastrocnemius tissue StO2 in hypoxia relative to normoxia (Table 2). This is puzzling, but may be related to the
duration of rest prior to measurement. Pre-exposure measurements were taken after 10 minute of rest, which was assumed to be sufficient to provide a consistent baseline value. Conversely, pre-exercise measurements were preceded by 25 minutes of rest in hypoxia, deemed necessary to elicit a physiological response to the low oxygen environment. The longer period of rest may have allowed a more consistent resting value to be obtained.
Conclusion
The current research suggests that a pre-loaded 1500 m treadmill TT conducted in moderate normobaric hypoxia is a highly reliable test of running performance in trained men. The majority of physiological variables demonstrated good reliability. Caution is advised when applying the INVOS 5100C to monitor StO2 at the gastrocnemius during higher-intensity
References
1 Amann M, Eldridge MW, Lovering AT, Stickland MK, Pegelow DF, Dempsey JA. Arterial
oxygenation influences central motor output and exercise performance via effects on peripheral locomotor muscle fatigue in humans. J Physiol 2006; 575: 937–952
2 Arnold JT, Oliver SJ, Lewis-Jones TM, Wylie LJ, Macdonald JH. Beetroot Juice Does Not
Enhance Altitude Running Performance in Well-Trained Athletes. Appl Physiol Nutr Metab 2015; 40: 590–595
3 Atkinson G, Nevill AM. Selected issues in the design and analysis of sport performance research. J
Sports Sci 2001; 19: 811–827
4 Austin KG, Daigle KA, Patterson P, Cowman J, Chelland S, Haymes EM. Reliability of
near-infrared spectroscopy for determining muscle oxygen saturation during exercise. Res Q Exerc Sport 2005; 76: 440–449
5 Barker T, Midwinter M, Porter K. The diagnosis of acute lower limb compartment syndrome:
Applications of near infrared spectroscopy. Trauma 2011; 13: 125–136
6 Barker T, Spencer P, Kirkman E, Lambert A, Midwinter M. An evaluation of the normal range of
StO2 measurements at rest and following a mixed exercise protocol. J R Army Med Corps 2014;
7 Bourdillon N, Mollard P, Letournel M, Beaudry M, Richalet J-P. Interaction between hypoxia and
training on NIRS signal during exercise: contribution of a mathematical model. Respir Physiol Neurobiol 2009; 169: 50–61
8 Currell K, Jeukendrup AE. Validity, Reliability and Sensitivity of Measures of Sporting
Performance. Sports Med 2008; 38: 297–316
9 Dullenkopf A, Frey B, Baenziger O, Gerber A, Weiss M. Measurement of cerebral oxygenation
state in anaesthetized children using the INVOS 5100 cerebral oximeter. Paediatr Anaesth 2003; 13: 384–391
10 Fulco CS, Rock PB, Cymerman A. Maximal and submaximal exercise performance at altitude.
Aviat Space Environ Med 1998; 69: 793–801
11 Gore CJ, Hahn AG, Scroop GC, Watson DB, Norton KI, Wood RJ, Campbell DP, Emonson DL.
Increased arterial desaturation in trained cyclists during maximal exercise at 580 m altitude. J Appl Physiol 1985 1996; 80: 2204–2210
12 Harriss DJ, Atkinson G. Ethical standards in sport and exercise science research: 2016 update·. Int
J Sports Med 2015; 36:1121–1124
13 Henslin Harris KB, Foster C, de Koning JJ, Dodge C, Wright GA, Porcari JP. Rapidity of
response to hypoxic conditions during exercise. Int J Sports Physiol Perform 2013; 8: 330–335
14 Hopkins WG. Measures of reliability in sports medicine and science. Sports Med 2000; 30: 1–15
15 Hyttel-Sorensen S, Hessel TW, Greisen G. Peripheral tissue oximetry: comparing three commercial
near-infrared spectroscopy oximeters on the forearm. J Clin Monit Comput 2014; 28: 149–155
16 Hyttel-Sorensen S, Sorensen LC, Riera J, Greisen G. Tissue oximetry: a comparison of mean
17 Issekutz B, Birkhead NC, Rodahl K. Use of respiratory quotients in assessment of aerobic work
capacity. J Appl Physiol 1962; 17: 47–50
18 Jeukendrup A, Saris WH, Brouns F, Kester AD. A new validated endurance performance test. Med
Sci Sports Exerc 1996; 28: 266–270
19 Jones AM. Middle- and Long-distance running. In: Winter EM, Jones AM, Davison R, Bromley
PD, Mercer TH (eds.). Sport and Exercise Physiology Testing Guidelines: Volume I - Sport Testing. The British Association of Sport and Exercise Sciences Guide. London, UK: Routledge, 2007
20 Jones AM, Doust JH. A 1% treadmill grade most accurately reflects the energetic cost of outdoor
running. J Sports Sci 1996; 14: 321–327
21 Laursen PB, Francis GT, Abbiss CR, Newton MJ, Nosaka K. Reliability of time-to-exhaustion
versus time-trial running tests in runners. Med Sci Sports Exerc 2007; 39: 1374–1379
22 MacInnis MJ, Nugent SF, MacLeod KE, Lohse KR. Methods to Estimate VO2max upon Acute
Hypoxia Exposure: Med Sci Sports Exerc 2015; 1
23 MacNutt MJ, Peters CM, Chan C, Moore J, Shum S, Sheel AW. Day-to-day variability in
cardiorespiratory responses to hypoxic cycle exercise. Appl Physiol Nutr Metab 2015; 40: 155–161
24 Martin D, O’Kroy J. Effects of acute hypoxia on the VO2max of trained and untrained subjects. J
Sports Sci 1993; 11: 37–42
25 Masschelein E, Van Thienen R, Wang X, Van Schepdael A, Thomis M, Hespel P. Dietary nitrate
improves muscle but not cerebral oxygenation status during exercise in hypoxia. J Appl Physiol 2012; 113: 736–745
26 Midgley AW, McNaughton LR, Polman R, Marchant D. Criteria for determination of maximal
oxygen uptake: a brief critique and recommendations for future research. Sports Med 2007; 37: 1019–1028
27 Nygren A, Rennerfelt K, Zhang Q. Detection of changes in muscle oxygen saturation in the human
leg: a comparison of two near-infrared spectroscopy devices. J Clin Monit Comput 2013; 28: 57– 62
28 Robergs RA, Quintana R, Parker DL, Frankel CC. Multiple variables explain the variability in the
decrement in VO2max during acute hypobaric hypoxia. Med Sci Sports Exerc 1998; 30: 869–879
29 Romer LM, Haverkamp HC, Amann M, Lovering AT, Pegelow DF, Dempsey JA. Effect of acute
severe hypoxia on peripheral fatigue and endurance capacity in healthy humans. Am J Physiol - Regul Integr Comp Physiol 2007; 292: R598–R606
30 Rupp T, Perrey S. Effect of severe hypoxia on prefrontal cortex and muscle oxygenation responses
at rest and during exhaustive exercise. Adv Exp Med Biol 2009; 645: 329–334
31 Schabort EJ, Hawley JA, Hopkins WG, Mujika I, Noakes TD. A new reliable laboratory test of
endurance performance for road cyclists. Med Sci Sports Exerc 1998; 30: 1744–1750
32 Scheeren TWL, Schober P, Schwarte LA. Monitoring tissue oxygenation by near infrared
33 Stevens CJ, Hacene J, Sculley DV, Taylor L, Callister R, Dascombe B. The Reliability of Running
Performance in a 5 km Time Trial on a Non-motorized Treadmill. Int J Sports Med 2015; 36: 705– 709
34 Taylor HL, Buskirk E, Henschel A. Maximal oxygen intake as an objective measure of
cardio-respiratory performance. J Appl Physiol 1955; 8: 73–80
35 Wehrlin JP, Hallén J. Linear decrease in VO2max and performance with increasing altitude in
endurance athletes. Eur J Appl Physiol 2006; 96: 404–412
36 Wiles JD, Bird SR, Hopkins J, Riley M. Effect of caffeinated coffee on running speed, respiratory
factors, blood lactate and perceived exertion during 1500-m treadmill running. Br J Sports Med 1992; 26: 116–120
37 Zavorsky G, Murias J, Gow J, Kim D, Poulin-Harnois C, Kubow S, Lands L. Laboratory 20-km
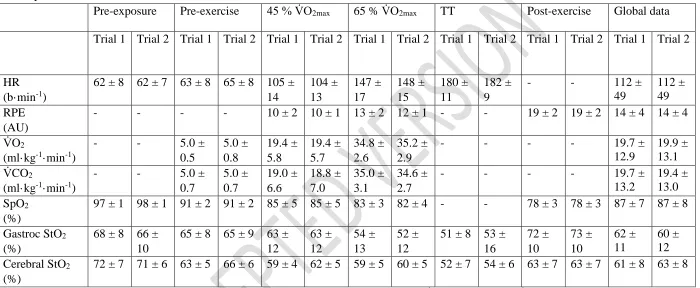
Table 1. Descriptive statistics of physiological variables calculated at individual time points and globally throughout the experimental trials. Data is presented as Mean ± SD.
Pre-exposure Pre-exercise 45 % V̇O2max 65 % V̇O2max TT Post-exercise Global data
Trial 1 Trial 2 Trial 1 Trial 2 Trial 1 Trial 2 Trial 1 Trial 2 Trial 1 Trial 2 Trial 1 Trial 2 Trial 1 Trial 2
HR (b·min-1)
62 ± 8 62 ± 7 63 ± 8 65 ± 8 105 ± 14 104 ± 13 147 ± 17 148 ± 15 180 ± 11 182 ± 9
- - 112 ±
49
112 ± 49 RPE
(AU)
- - - - 10 ± 2 10 ± 1 13 ± 2 12 ± 1 - - 19 ± 2 19 ± 2 14 ± 4 14 ± 4
V̇O2
(ml·kg-1·min-1)
- - 5.0 ±
0.5 5.0 ± 0.8 19.4 ± 5.8 19.4 ± 5.7 34.8 ± 2.6 35.2 ± 2.9
- - - - 19.7 ±
12.9
19.9 ± 13.1 V̇CO2
(ml·kg-1·min-1)
- - 5.0 ±
0.7 5.0 ± 0.7 19.0 ± 6.6 18.8 ± 7.0 35.0 ± 3.1 34.6 ± 2.7
- - - - 19.7 ±
13.2
19.4 ± 13.0 SpO2
(%)
97 ± 1 98 ± 1 91 ± 2 91 ± 2 85 ± 5 85 ± 5 83 ± 3 82 ± 4 - - 78 ± 3 78 ± 3 87 ± 7 87 ± 8
Gastroc StO2
(%)
68 ± 8 66 ± 10
65 ± 8 65 ± 9 63 ± 12 63 ± 12 54 ± 13 52 ± 12
51 ± 8 53 ± 16 72 ± 10 73 ± 10 62 ± 11 60 ± 12 Cerebral StO2
(%)
72 ± 7 71 ± 6 63 ± 5 66 ± 6 59 ± 4 62 ± 5 59 ± 5 60 ± 5 52 ± 7 54 ± 6 63 ± 7 63 ± 7 61 ± 8 63 ± 8
s = seconds, b·min-1 = beats per minute, AU = arbitrary units, SpO
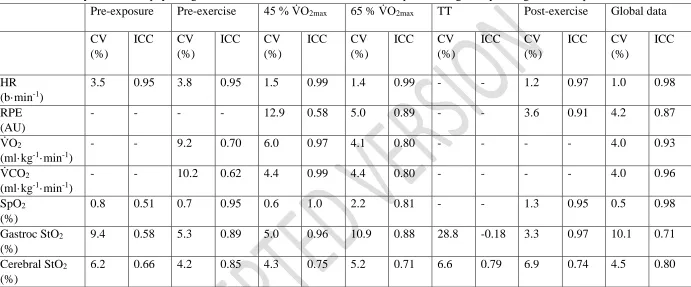
Table 2. Reliability statistics of physiological variables calculated at individual time points and globally throughout the experimental trials.
Pre-exposure Pre-exercise 45 % V̇O2max 65 % V̇O2max TT Post-exercise Global data
CV (%)
ICC CV
(%)
ICC CV
(%)
ICC CV
(%)
ICC CV
(%)
ICC CV
(%)
ICC CV
(%)
ICC
HR (b·min-1)
3.5 0.95 3.8 0.95 1.5 0.99 1.4 0.99 - - 1.2 0.97 1.0 0.98
RPE (AU)
- - - - 12.9 0.58 5.0 0.89 - - 3.6 0.91 4.2 0.87
V̇O2
(ml·kg-1·min-1)
- - 9.2 0.70 6.0 0.97 4.1 0.80 - - - - 4.0 0.93
V̇CO2
(ml·kg-1·min-1)
- - 10.2 0.62 4.4 0.99 4.4 0.80 - - - - 4.0 0.96
SpO2
(%)
0.8 0.51 0.7 0.95 0.6 1.0 2.2 0.81 - - 1.3 0.95 0.5 0.98
Gastroc StO2
(%)
9.4 0.58 5.3 0.89 5.0 0.96 10.9 0.88 28.8 -0.18 3.3 0.97 10.1 0.71
Cerebral StO2
(%)
6.2 0.66 4.2 0.85 4.3 0.75 5.2 0.71 6.6 0.79 6.9 0.74 4.5 0.80
s = seconds, b·min-1 = beats per minute, AU = arbitrary units, SpO
Figure 1. Spaghetti plot of individual performance times (dashed lines) and mean TT time (solid line) for 2 repeat pre-loaded 1500 m running TTs.
280 300 320 340 360 380 400 420
Trial 1 Trial 2
Ti
me
(s
[image:16.595.80.503.76.336.2]