Citation:
Darbyshire, K and Waterworth, G and Webb, DC (2010) The Investigation of Pump Performance and
Evaluation over the Internet. In: 20th CIRP Design Conference, April 19 - 21, 2010, Nantes, France.
Link to Leeds Beckett Repository record:
http://eprints.leedsbeckett.ac.uk/774/
Document Version:
Conference or Workshop Item
The aim of the Leeds Beckett Repository is to provide open access to our research, as required by
funder policies and permitted by publishers and copyright law.
The Leeds Beckett repository holds a wide range of publications, each of which has been
checked for copyright and the relevant embargo period has been applied by the Research Services
team.
We operate on a standard take-down policy.
If you are the author or publisher of an output
and you would like it removed from the repository, please
contact us
and we will investigate on a
case-by-case basis.
The Investigation of Pump Performance and Evaluation over the Internet
K J Darbyshire, G Waterworth, D Webb
Leeds Metropolitan University, Innovation North, Headingley Campus, Leeds, LS6 3QS, England, UK. [email protected]
Abstract
Selection and configuration are widely met tasks in design; this is an example of a web-based selection/configuration tool with embedded optimisation. Pumps inevitably deteriorate over their product lifecycle, in which interaction generally occurs in terms of flow, pressure and electricity consumption. Practical implementations of pump scheduling suggest that a 10% of the annual expenditure on energy costs may be saved. The object is to minimise the energy cost incurred, while selecting the best schedule of legal available pumps. The results illustrate that the recording of pump characteristics over the internet provides an efficient method of pump performance and evaluation.
Keywords:
Design/Product Development. Pump Asset Management, Carbon Footprint Reduction Strategies, Pump Efficiency and Scheduling, Pump Identification and Interaction.
1 INTRODUCTION
This paper describes the development of a secure web-based database that gives support to hydraulic engineers enabling them to select cost efficient pump combinations over the Internet Throughout the water industry, many methodologies of cost management have been adopted to enable the reduction of significant energy costs. Methods such as the refurbishment of deteriorated pumps, the use of high efficient motors, employing the most efficient pumps and ensuring that water is pumped using the smallest hydraulic head will enable substantial savings. The techniques of optimal scheduling are relevant to many areas of manufacturing and production engineering, such as scheduling of material flow, production planning, tool and plant scheduling, job shop scheduling and single machine scheduling. Optimal scheduling will effectively reduce the average job response time, thus improving system efficiency and cost reduction. Using the combined methods of pump modelling, factorial analysis, linear programming and the Internet technologies, will provide an efficient process to enable the monitoring of pump performance and evaluation.
2 PROBLEM FORMULATED
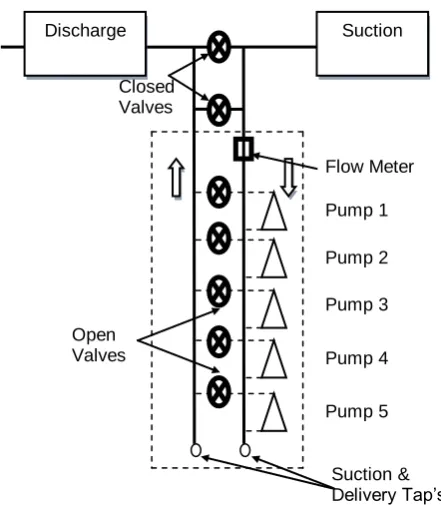
Figure 1 illustrates a typical high-lift water pumping station (WPS) that consists of five fix speed water pumps connected in a parallel configuration. Each pump extracts clean water from a close by water supply tank and provides the customer with clean water via a water storage tank. The pumps are operated over a twenty-four hour period and individually monitored using micro-controller processors (MCP). The MCP’s enable the parameters of pump flow, pressure and energy consumption, on the delivery side of the pumps, to be recorded [1]. Figure 2 illustrates the total power consumption produced by the pumps over a twenty-four hour period. Figure 3 illustrates how the logged data is transmitted to the ‘pump control room’ through an outstation, commonly known as a remote telemetry unit (RTU) [2]. The hydraulic engineer may then analyze the data and enable the construction of pump characteristic
[image:2.595.334.555.356.609.2]models and cost effective schedules to improve system efficiency.
Figure 1: Water Supply System Schematic
Since the WPS consist of five high-lift pumps, there are 32 (25) possible pump combinations during each two hourly switch over. The cost of generating electricity is more economical throughout the night than during the expensive daytime period. Due to this nightly rebate, optimum pumping is more cost effective through the hours of 1800hrs to 2400hrs [3]. The electricity tariff for nightly use is 1.2p per hour, where the more expensive day period i.e. 0000hrs to 1800hrs is 2.86p per hour. The cost function for the applied problem is illustrated as follows:
Suction & Delivery Tap’s Pump 2 Pump 1
Pump 4 Pump 3 Flow Meter Closed
Valves
Suction Discharge
Pump 5 Open
Rn Pn
t n t
fn
Cost .
24 1
5 1 ( )
[image:3.595.51.264.251.435.2]
Figure 2: Total Pump Power Consumption
Figure 3: Data Transfer Between WPS and Pump Operator (1) Where: R=Tariff P=Power (kWh) Q=Flow D=Demand X=Reservior Level F=On/Off t=Time(hrs) n=Pump Number T=Total
Other constraints for the optimisation model are that the maximum discharge capacity of the WPS must not exceed 2500m3 and the minimum must not fall below 1250m3 as illustrated below:-
(2)
While constrained to the maximun and minimum limits:
(3)
(4)
3 WEB TECHNOLOGIES
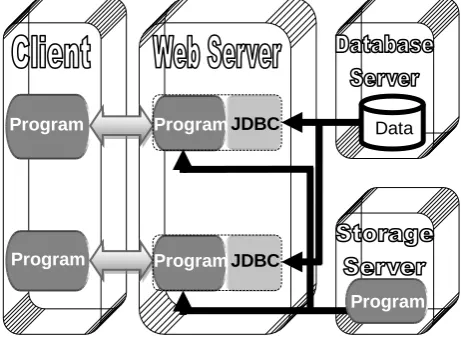
[image:3.595.305.536.341.510.2]Over the last decade, the use of the Internet has been used broadly to circulate information globally. Due to the rise of Web 2.0 technologies such as e-commerce, online learning and online resources etc, there is the increased need for server side applications. Using the existing technologies of Hypertext Mark-Up Language (HTML), Java Server Pages (JSP) and Server Query Language (SQL), with a secure web based server, power, flow and pressure produced by the individual pumps may be monitored over the Internet [4]. JSP enables the use of static HTML content with server side scripting to produce a dynamic output and is implemented as a classic three-tier client/server as illustrated in Figure 4.
Figure 4: Client / Server: Three-Tier Architecture
The Java Database Connectivity (JDBC) Application-Programming Interface (API) allows the hydraulic engineer situated in the control room to interact with the SQL database server. Using Microsoft Excel and Direct Data Access (DDA), pump characteristics may be displayed in the form of a spreadsheet. The information may then be used to construct pump models using Matlab®, to calculate their best efficiency point (BEP) of operation as illustrated in Figure 5. A pump is then selected so that it runs at its best efficiency BEP relating to the expected system curve at the pumps BEP [5]. This is achieved using the pump affinity laws to help derive maximum flow, power and pump efficiency.
(5) (6) RTU Data Data Analysis Data Validation Data Storage P1 P5 P2 P3 P4 WPS Control Room Program Program Program Program Program JDBC
JDBC Data
) ( 1
5 1 () )
( Qn Dt
T
t n t
fn T
Level
) ( 24 1 51 () max t n
fn
tQn
tx
) ( 24 1 5
1 () min t n
fn
tQn
tx
) 1 ( 10 , 1 0F n
F
05 . 0 , 888 . 95 ) 1 ( 10 , 1
0F p
F n
96 . 4 05 . 0 ) 10 , 1 (
0F
F (7)
(8)
Where:
H = Head
Hcut = Head is at zero
Hsyst = System Head Curve
Hstat = Static Head Component
Qmax =Maximum Flow
hf = Valve and Pipe Losses
c = Pump Manufactures Coefficients SpGr = Specific Gravity
[image:4.595.65.245.61.269.2]The pump models are verified against the pump manufactures characteristics to identify any problems as illustrated in Figure 6. The graph illustrates the manufactures bench test curve, for the efficiency of a pump, against the live conditions of a currently monitored pump. By comparing the two curves, it is evident that at BEP the pump has deteriorated by 8.5%
Figure 5: Best Efficiency Point of Pump Modelled in Matlab®
Figure 6: Pump Characteristics Modelled in Matlab®
4 PUMP INTERACTION
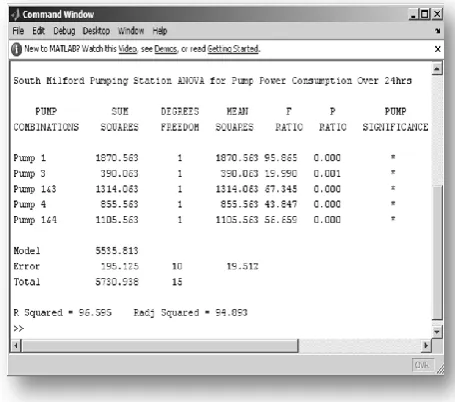
[image:4.595.334.562.238.439.2]Pumps operating in combinational sequences show evidence of interaction, in which certain configurations prove more efficient than the sum of each running alone. If there is evidence of interaction between pumps, then the data may be used to construct a comprehensive scheduling package using this additional information. The implementation of fractional analysis enables important pump information to be established by the extraction of interactive data from the database [1]. This is a statistical technique used to simultaneously analyse data considering several factors in an experiment [6]. Figure 7 depicts a screen shot of the Matlab® command window illustrating which of the pumps are significant to the experiment.
Figure 7: Pump Significance Modelled in Matlab®
The Matlab® simulation has been verified by using the statistical f-distribution tables to identify the observed significance of each pump under test.
(9)
At the significance level of α=0.05 the critical value for Pump 1, from the statistical f- distribution table, is 5.32. Hence, the significance limits for pump number one are:
(10)
(11)
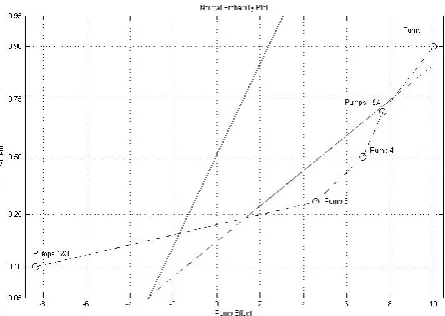
By implementing a normal probability plot of effects as illustrated in Figure 8, pump interaction is more evident. The plot shows that they are no middle point pump effects or interactions that follow a normal distribution. This concludes that the pump effects and interactions have a significant effect on the experiment. The normal probability plot also clearly illustrates that the two-way interaction of Pumps 1 and 3 have a negative effect on the response and with the aid of optimal scheduling a significant cost reduction for power consumption may be achieved.
P SpGr H Q Efficiency . .
f h
Q stat H syst H
2
[image:4.595.59.284.373.532.2] [image:4.595.67.282.585.734.2]Figure 8: Matlab® Normal Probability of Pump Effects
5 PUMP SCHEDULING
The fundamental aim of optimisation is to minimise or maximise a cost function, which is a measure of the performance of some aspect of the process under consideration [7]. This paper uses the mathematical technique of Linear Programming (LP) to calculate an optimum policy using a sequence of decisions [8]. There are many optimisation techniques that have been previously implemented such as Dynamic Programming (DP), Genetic Algorithms (GA’s), Simulated Annealing (SA) [9]. Linear programming has been implemented in this paper due its short computational time taken to find an optimum solution. LP implements a systematic approach to calculate a minimum objective in the terms of linear equations [10]. The time taken to run the algorithm depends on the required accuracy of the results. For a WPS incorporating five pumps the algorithm takes less than thirty seconds to compute. Figure 9 illustrates the optimised pumping schedule adhering to the system constraints discussed earlier in this paper.
0 500 1000 1500 2000 2500
1 3 5 7 9 11 13 15 17 19 21 23
Re
s
e
rv
o
ir
Ca
p
a
c
it
y
(
c
u
m
)
[image:5.595.301.544.190.389.2]Time (hrs)
Figure 9: Optimised Pump Schedule
6 CONCLUSION
Selection and configuration are widely met tasks in design. This paper has successfully illustrated an example of a web-based selection/configuration tool with embedded optimisation. The results demonstrate a cost effective method of pump performance and evaluation over the Internet. Due to implementing the combined methodologies of Internet technologies, linear programming and factorial analysis an effective and
accurate process of secure pump asset management has been implemented. The results illustrate that the web server may be remotely accessed, which enables hydraulic engineers to compare pump manufactures data to identify deterioration or any irregularities in the water distribution system. The pump characteristics have been modelled in Matlab®, which calculates the pumps best efficiency point using the resistance system curve of the water system. Factorial analysis and subsequent optimal scheduling enables a significant cost reduction. Figure 10 illustrate the product development cycle of pump performance and evaluation over the Internet.
Figure 10: Pump Performance and Evaluation Over the Internet
[image:5.595.37.265.491.643.2]The full extent of this knowledge management system is illustrated in Figure 11. This aspect will bring potential savings in manpower cost due to the system being operated according to scenarios generated by the pump asset management system rather than a hydraulic engineer. Ultimately, the tasks required to enable such a system are pump data collection, monitoring the results of the pump conditions and raising alarm either audible, an email or short message service (SMS) [11][12].
Figure 11: Pump Asset Management System Alarms
Pumps Available
Pump
Characteristics
Required Flow
Data
Validation
Pump Scheduling
Demand Prediction
Archive
Pump Trends Manual
[image:5.595.308.515.542.721.2]7 REFERENCES
[1] Darbyshire, K, J. Waterworth, G. (2004) Pump Asset Operation and Performance Monitoring over the Internet. Advances in e-Engineering and Digital Enterprise Technology. Fourth International Conference on e-Engineering and Digital Enterprise Technology (e-ENGDET), Edited by Cheng, K. Webb, D. and Marsh, R. Professional Engineering Publishing Limited.
[2] Reynolds, L. (2004) Developments in Control in the Water Industry. IEE Computing and Control Engineering. February/March 2004. Pages 39-43.
[3] Darbyshire, K, J. Waterworth, G. (2003) Optimal Scheduling Utilizing Factorial Analysis and Constrained Optimisation. The International Journal for Manufacturing Science & Production. Advances in Manufacturing Research in the UK. Selected Papers from the 18th National Conference on Manufacturing Research National Conference on Manufacturing Research in the UK, Guest Editors by Cheng, K. Webb, D. Vol 5, NOS 1-2, 2003, Freud Publishing House Limited.
[4] Kang, B, L et al. (2000) Distributed Measurement and Control Based on the IEEE 1451 Smart Transducer Interface Standards. IEEE Transactions on Instrumentation and Measurement. Vol 49, No 3, June.
[5] Bunn, S. (2009) Operating Pumps to Maximise Efficiency. Pump & Pipelines. Water. June 2009.
[6] Montgomery, D, C. (2009) Design and Analysis of Experiments. International Student Version. Seventh Edition, John Wiley & Sons (Asia) Pte Ltd.
[7] Chen, Y. C. Coulbeck, B. (1991) Optimized Operation of Water Supply Systems Containing a Mixture of Fixed and Variable Speed Pumps. International Conference on Control 91, pp 1200-1205.
[8] Bryds, M. A. Ulanicki, B. (1994) Operational Control of Water Systems: Structures, Algorithms and Applications. Prentice Hall.
[9] Darbyshire, K, J. Waterworth, G. (2001) Comparison of Methods of Pump Scheduling in Water Supply Systems. European Simulation and Modelling Conference, ESM2001, ENGIN-28 Prague, June 2001.
[10] Levin, R. Lamone, R. (1969) Linear Programming for Management Decisions. Richard, D. Irwin Inc, Homewood, Illinois.
[11] Mustard, S. Harrison, S. (2004) Future Requirements for Remote Telemetry Units. IEE Computing and Control Engineering. February/March 2004. Pages 45-47.